Ballast Stop Sizer MT4

Stop-loss and take-profit levels sized from the expected daily range, with the lot that risks exactly your chosen % of balance.

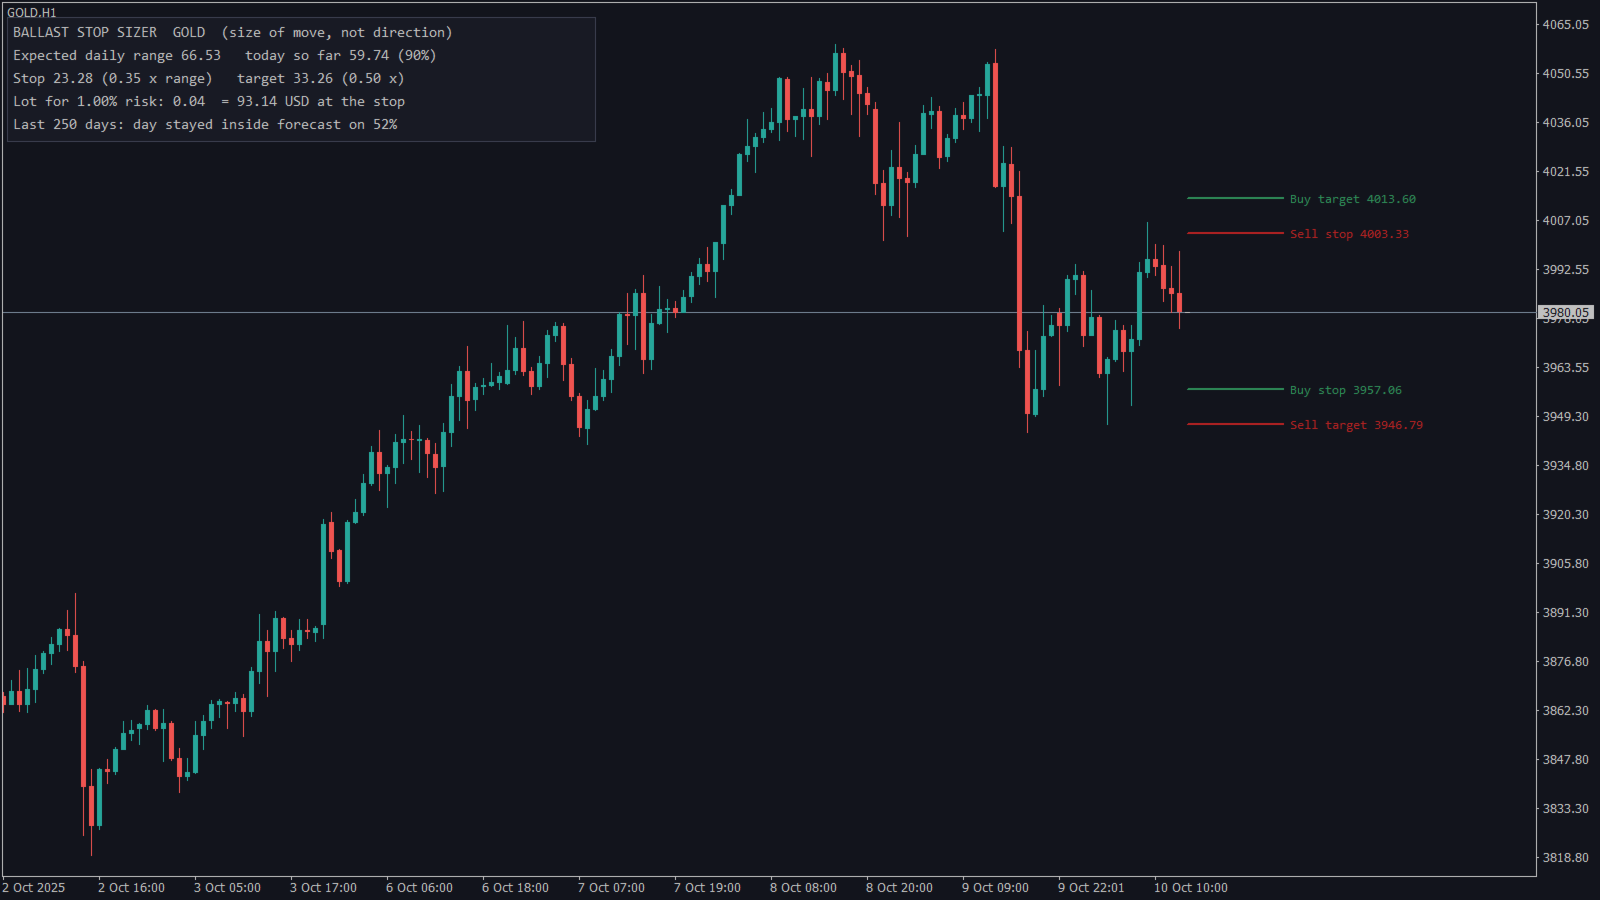
A stop that is too tight gets hit by normal noise; a stop that is too wide makes the lot tiny. Ballast Stop Sizer sizes the stop from how much the market is expected to move today.

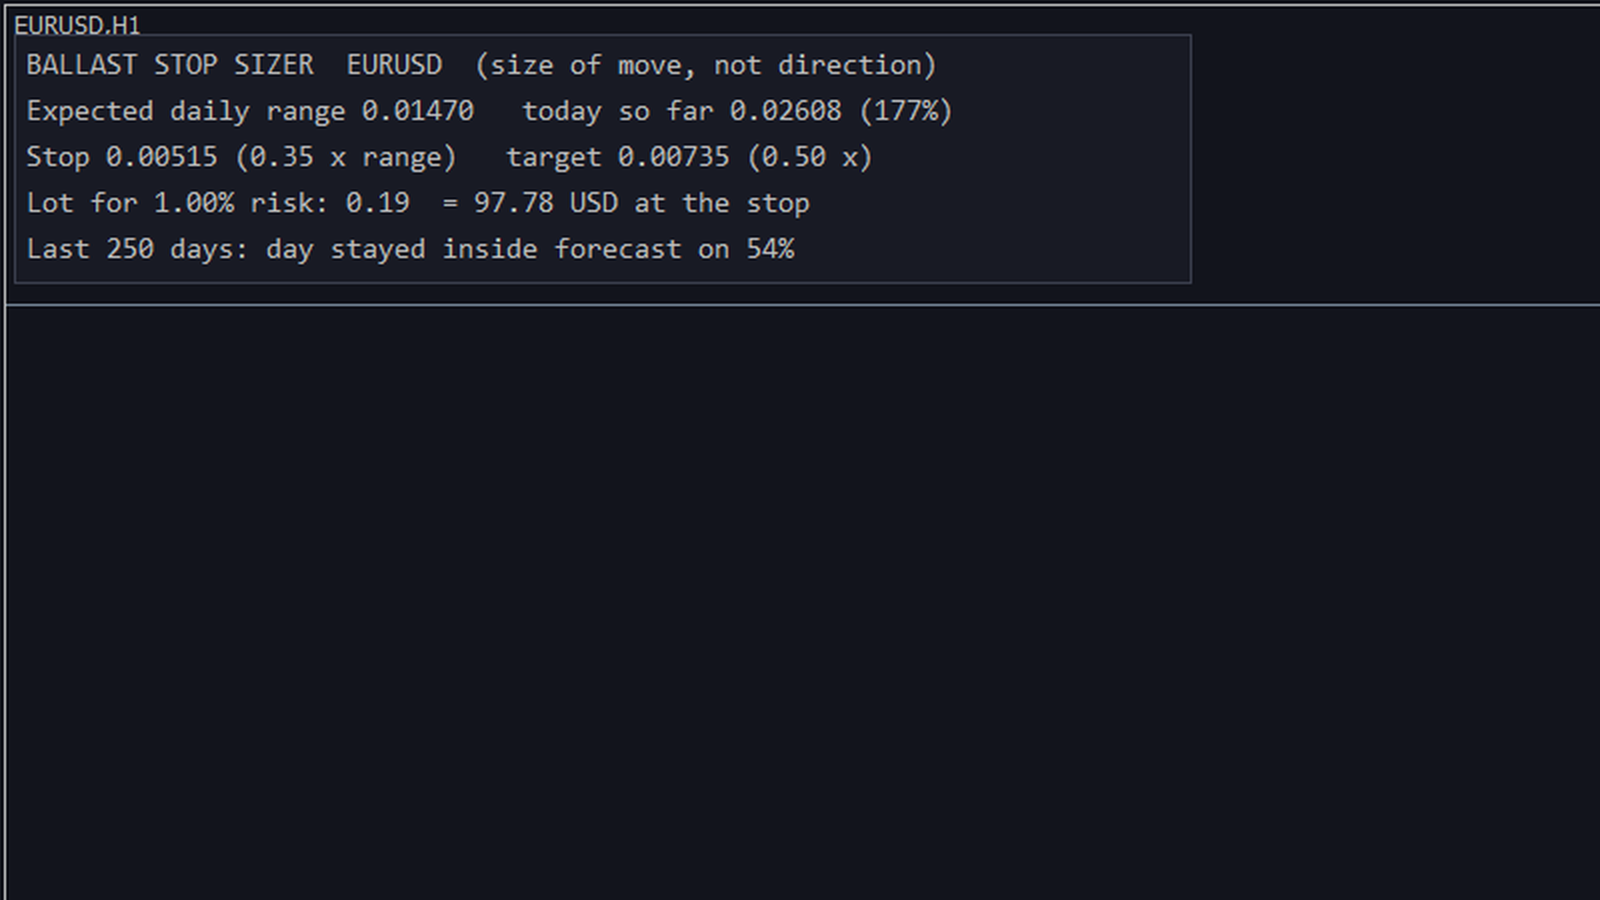
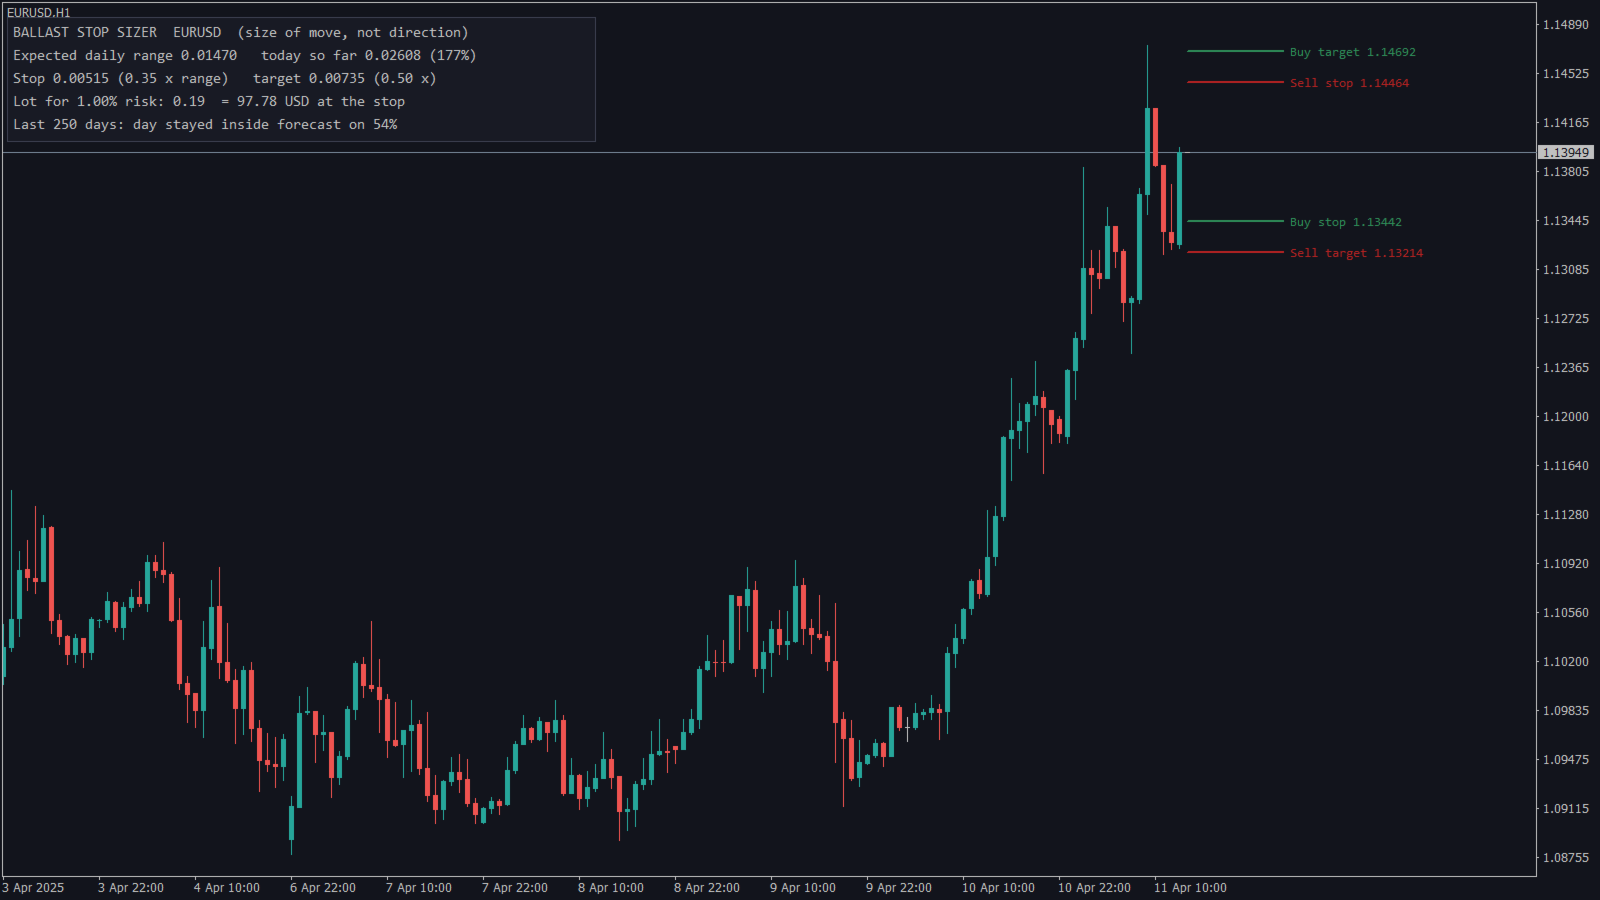
  • Expected daily range — from the average range of the last 5 and the last 20 trading days (weekend bars are ignored). Shown with how much of it today has already used.
  • Buy and sell stop-loss and target lines at a chosen fraction of the expected range (default stop 0.35×, target 0.50×), drawn next to the current price.
  • Lot size for your risk % and the money lost at the stop.
  • Honest check: how often a past day stayed inside its forecast, measured on the last 250 days.
  • Optional alert when today's range reaches the expected range.
  • Three buffers for EA developers (iCustom): expected range, buy stop-loss and sell stop-loss for every bar.

The indicator forecasts the size of the move, never its direction.

Tested on MT4

  • 406 trading days in the MT4 Strategy Tester (EURUSD H1 for one year, Gold M5 for seven months). Each day's range, buy stop and sell stop were compared with values calculated independently by the test from the daily bars: 0 mismatches.
  • Ran without errors in the MT4 Strategy Tester on EURUSD M1, M15, H1 and H4 and on Gold H1 and M15, with USD and EUR accounts from 100 to 10,000.

Inputs

  • Stop = × expected range — 0.35
  • Target = × expected range — 0.50 (0 = none)
  • Risk % for the lot size — 1.0
  • Days used for the check — 250
  • Alert at 100% — false
  • Colours, font size, panel corner — adjustable

Next step

Ballast Stop Sizer is free. If you want the lot size and stop placed for you on every trade, see Ballast Risk Panel; for prop-firm challenges, see Ballast Prop Guard.

  • This is the MT4 version. The MT5 version is a separate product on the Market.
Recommended products
The   Pivot Point indicator   automatically calculates and displays the pivot point line and support and resistance levels. Pivot can be calculated according to the Classic, Floor, Fibonacci, Woodie, Camarilla or DeMark formula. It is also possible to select the period for calculating the indicator. A trader can choose from daily, weekly, monthly, or user-defined periods. Types of pivots Classic Floor Fibonacci Woodie Camarilla DeMark Main features The indicator shows the current and historic
FREE
FREE for the First 50 Users ================================================================   ShowKillZones v1.0   - Corrected NY AM end time from 11 to 10, and NY PM end time from 17 to 16 (adjusted to Kill Zone hours) [cite: 321, 326]   - Changed NY AM/PM labels to Kill Zone [cite: 321, 326] v1.0  -  User Manual [cite: 321] ================================================================ [Overview] This indicator displays ICT Kill Zones (session hours) on the chart as background zones an
FREE
RelicusRoad Daily Pivots is a daily pivot points indicator for MetaTrader 4 and MetaTrader 5 that divides the previous day's range into Fibonacci levels and extends them above and below it, from minus 100 to plus 200 percent. Instead of classic floor pivots, the previous completed range is treated as a scale where the low is 0% and the high is 100%. Nineteen levels are printed as compact colored markers at the right edge of the chart, so the size of today's move reads as a fraction or a multiple
FREE
The indicator represents the session boxes for the Asian, European and American sessions. It is possible to change the time of each session, such as color. It is also possible to disable the display of each session. You will find in input parameters variables to modify time sessions  in format hh:mm and  the color of boxes of each sessions. If you need some implementations please contact me.
FREE
Swap Detector
Dustin Ricardo Pierenz
The Swap Detector is an essential MQL4 utility that displays the swap costs of any instrument when applied to a chart. It helps traders make informed decisions by visually indicating the swap value in customizable colors— green for positive (good) and red for negative (bad) by default. This tool ensures transparency in overnight holding costs, enabling better trade planning and risk management
FREE
ZigZag Support and Resistance Levels  is an indicator that identifies support and resistance levels based on ZigZag pivot points, now with an interactive on-chart control panel. It groups nearby levels into zones using a clustering method to help visualize areas where price has reacted multiple times, and distinguishes broken (breakout) levels from active (extension) levels. Key Features 1. ZigZag Pivot Detection Detects swing highs and lows using configurable Depth, Deviation, and Backstep par
FREE
Market Sessions Time MT4
Juan Facundo Valdes
3.5 (4)
Displays the current major markets session and the remaining time to start the next ones. Markets New York London Frankfurt Tokio Sidney 1 more session with custom name, open and close time Clock time GMT / UTC Local (from computer) Broker (server time) Default time on settings is GMT. After changing to Local or Broker time, is needed to adjust each session open and close hour manually based on the time type choosed. Each market open and close hour can be ajusted Graphics settings Each Sessi
FREE
Automatic Fibonacci Pivots
Martin Alejandro Bamonte
Now free. The key Fibonacci pivot levels, drawn for you automatically every day, on any timeframe. Automatic Fibonacci Pivots calculates the daily support and resistance from the Fibonacci sequence and plots them clean on your chart: the daily pivot, S1/S2/S3 below and R1/R2/R3 above. These are the price zones where the market tends to react, bounce or break, and now you see them without drawing a single line. What it does: - Daily Fibonacci pivot levels (pivot, S1/S2/S3, R1/R2/R3), updated
FREE
VR Watch list and Linker
Vladimir Pastushak
4.63 (8)
VR Watch list and Linker is a screener application for the MetaTrader terminal. Makes it easier to find the most interesting and technical financial instruments. This screener is used by traders for trading on such exchanges as bybit, Moscow Exchange, American Exchange, foreign exchange and cryptocurrencies market, metal market, and is used for trading in prop companies. The selection of financial instruments is carried out manually. The screener connects open charts in the MetaTrader terminal a
FREE
Silver Bullet MT4
Saksham Solanki
5 (2)
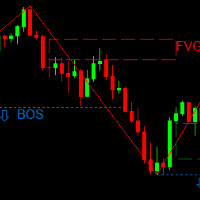
Contact me for any queries or custom orders, if you want to use this in an EA. Key Features: Pattern Recognition : Identifies Fair Value Gaps (FVGs) Spots Break of Structure (BOS) points Detects Change of Character (CHoCH) patterns Versatile Application : Optimized for candlestick charts Compatible with any chart type and financial instrument Real-Time and Historical Analysis : Works seamlessly with both real-time and historical data Allows for backtesting strategies and live market analysis Vi
FREE
Show Pips
Roman Podpora
4.27 (59)
This information indicator will be useful for those who always want to be aware of the current situation on the account. The indicator displays data such as profit in points, percentage and currency, as well as the spread for the current pair and the time until the bar closes on the current timeframe. VERSION MT5 - More useful indicators There are several options for placing the information line on the chart: 1. To the right of the price (runs behind the price); 2. As a comment (in the upper
FREE
MQLTA Support Resistance Lines is an indicator that calculates the historical levels of Support and Resistance and display them as Lines on chart. It will also Alert you if the price is in a Safe or Dangerous zone to trade and show you the distance to the next level. The indicator is ideal to be used in other Expert Advisor through the iCustom function. This DEMO only works with AUDNZD, the full product can be found at https://www.mql5.com/en/market/product/26328 How does it work? The indicator
FREE
Shadow Flare MT4
Kestutis Balciunas
Shadow Flare Indicator is a non-repainting trend & liquidity tool for MetaTrader 4. It runs a configurable moving-average baseline (HMA, EMA, SMA, or RMA) wrapped in an Average True Range envelope and produces a sticky trend state that only flips when price closes through the upper or lower band. The same trend engine drives an automatic supply/demand zone module that detects pivot highs and pivot lows, draws coloured boxes around them, and mitigates each zone the moment price closes through it.
FREE
AC Pivot Panel – Your Ultimate Pivot Trading Tool The   AC Pivot Panel   is a powerful yet user-friendly pivot point indicator designed to help traders identify key support and resistance levels with ease. Whether you’re a beginner or an experienced trader, this indicator simplifies pivot trading and enhances your decision-making process. Key Features : Interactive Selection Panel : Easily adjust pivot settings directly on the chart with a compact and intuitive panel. Multiple Pivot Methods : C
FREE
Maps
Pavel Shutovskiy
4.75 (4)
The indicator displays on the chart a map, on which markers show the current trading session, as well as shows a text. The indicator provides two types of background display: white and black. The indicator is displayed as the background and does not hinder tracking the current market situation. Parameters: GMT -  the time difference of the terminal and GMT. Background - selection of background - black or white.
FREE
The selective pin bar is designed to identify reversals. To use the selective pin bar effectively, traders typically look for Strong Rejection: The tail of the pin bar should extend significantly beyond the surrounding price action. It indicates that there was a sharp rejection of higher or lower prices during the trading period. A strong rejection suggests that the market sentiment may be changing.
FREE
Free automatic Fibonacci is an indicator that automatically plots a Fibonacci retracement based on the number of bars you select on the BarsToScan setting in the indicator. The Fibonacci is automatically updated in real time as new highest and lowest values appears amongst the selected bars. You can select which level values to be displayed in the indicator settings. You can also select the color of the levels thus enabling the trader to be able to attach the indicator several times with differe
FREE
Ava Dragon Pro Signal
Nirundorn Promphao
1 (1)
The principle of this indicator is very simple: detecting the candlestick pattern in D1 timeframe, then monitoring the return point of graph by using the pullback of High-Low of D1 Candlestick and finally predicting BUY and SELL signal with arrows, alerts and notifications. The parameters are fixed and automatically calculated on each time frame. Example: If you install indicator on XAUUSD, timeframe D1: the indicator will detect the reversal, pullback, price action on this timeframe (for exam
FREE
Skdon2
Igor Bulyshev
A revised version of a very well-known trend indicator, SkDon Trend Signal. This is an assistant indicator that shows the strength and direction of price movement. It colors the chart with colored bars (histograms): blue bars grow upward, red bars downward. Blue bar - bullish sentiment (price may go up). Red bar - bearish sentiment (price may go down). The taller the bar, the stronger the signal. If the bars are short or almost absent, the market is calm, it is better not to enter. Why is it nee
FREE
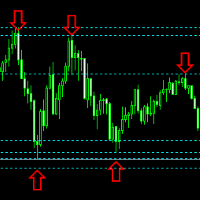
.....................................hi....................... ................for showing high s and low s and support and resistanses .....................we have a lot of ways............................... it can be helpful for finding trends , higher highs , higher lows , lower highs , lower lows .......................today i write on of thems.......................... ........................you can enter the number of last support and resistanses .........................and it will dra
FREE
Pivot Points Classic and Camarilla draws Classic pivot levels (P, R1-R3, S1-S3) and Camarilla levels (H1-H4, L1-L4) directly on the chart. The levels are calculated from the High, Low and Close of the previous period of the timeframe you choose (D1 by default), and every period is drawn as a horizontal line over the period it applies to, so you can see how price reacted to the levels on previous days, weeks or months. Features Classic pivots - the central pivot P with three resistance (R1-R3) an
FREE
Liquidity Grab X — Liquidity Sweep & Grab Detector (MT4 & MT5) Liquidity Grab X automatically detects buyside and sellside liquidity sweeps (stop-hunts) at swing pivots and classifies each grab by strength — helping you spot exhaustion moves and potential reversal zones in real time, with instant push notifications to your phone. Full Description Liquidity Grab X is a free rule-based indicator for MetaTrader 4 and MetaTrader 5 that identifies liquidity grabs — moments where price sweeps above a
FREE
MASi Three Screens
Aleksey Terentev
5 (2)
MASi Three Screens is based on the trading strategy by Dr. Alexander Elder. This indicator is a collection of algorithms. Algorithms are based on the analysis of charts of several timeframes. You can apply any of the provided algorithms. List of versions of algorithms:     ThreeScreens v1.0 - A simple implementation, with analysis of the MACD line;     ThreeScreens v1.1 - A simple implementation, with analysis of the MACD histogram;     ThreeScreens v1.2 - Combines the first two algorithms in
FREE
Chart Symbol Changer for MT4
Juvenille Emperor Limited
5 (9)
Chart Symbol Changer for MT4 is an indicator/utility that offers you the option to change the current chart symbol that is attached onto with a click of a symbol button on its panel.  Chart Symbol Changer for MT4  gives you the option to configure the 32 symbol buttons to your personal preference, by adding the pairs you want to keep any eye on and trade the most. This way you will never miss an opportunity, because you can have a faster view of the market on your chart with just a few clicks.
FREE
Colored Candle Time
Saeed Hatam Mahmoudi
Candle Time (MT4) The Candle Time indicator shows the remaining time for the current candle on the active chart timeframe. It adapts automatically to the chart period and updates on every tick. This is a charting utility; it does not provide trading signals and does not guarantee any profit. Main functions Display the time remaining for the current candle on any timeframe (M1 to MN). Color-coded state: green when price is above the open (up), gray when unchanged, and red when below the open (do
FREE
Trendline indicator
David Muriithi
2 (1)
Are you tired of drawing trendlines every time you're analyzing charts? Or perhaps you would like more consistency in your technical analysis. Then this is for you. This indicator will draw trend lines automatically when dropped on a chart. How it works Works similar to standard deviation channel found on mt4 and mt5. It has 2 parameters: 1. Starting Bar 2. Number of bars for calculation The   starting bar   is the bar which drawing of the trend lines will begin, while the   number of bars for c
FREE
Order blocks from any timeframe, with alerts - and a table that tells you honestly whether they work on your chart. ICT Order Blocks Honest Stats draws order blocks from this or a higher timeframe, marks each one fresh, tested or broken, alerts you when price comes back to a fresh block, and measures on your chart's own history how often the blocks held next to fake zones of the same size. Free, part of the Honest Stats series. Market Structure MT4 (free) | MT5 version (free) | Free: FVG Honest
FREE
MQLTA Support Resistance Lines
MQL4 Trading Automation
4.33 (12)
MQLTA Support Resistance Lines is an indicator that calculates the historical levels of Support and Resistance and display them as Lines on chart. It will also Alert you if the price is in a Safe or Dangerous zone to trade and show you the distance to the next level. The indicator is ideal to be used in other Expert Advisor through the iCustom function. This indicator can be tested LIVE on AUDNZD with the following DEMO https://www.mql5.com/en/market/product/26572 How does it work? The indicato
FREE
SR indicator
Alexander Chertnik
5 (3)
SR is a support and resistance indicator, it shows major highs and lows by different colors. The color of a level is changing if the last high or low are touching it. After the closing of a bar above or below level, it will delete it. extern inputs: loop for candles / colors / drawing time *This indicator signal is not perfect and have to be used with other market analysis and confirmations.
FREE
UPD1 Volume Footer
Vitaliy Kuznetsov
4.85 (13)
The indicator shows the vertical volume. In the settings there are 2 coefficients for determining high and extreme volume and 1 for determining low volume. A similar algorithm is also used in the UDP1 Volume Pixel indicator . When the specified volume is detected, the histogram is painted in the appropriate color. The width of the histogram is selected automatically, depending on the scale. As a rule, the price reacts to the maximum and minimum volume. But it is necessary to use confirmation si
FREE
Buyers of this product also purchase
Currency Strength Wizard is a very powerful indicator that provides you with all-in-one solution for successful trading. The indicator calculates the power of this or that forex pair using the data of all currencies on multiple time frames. This data is represented in a form of easy to use currency index and currency power lines which you can use to see the power of this or that currency. All you need is attach the indicator to the chart you want to trade and the indicator will show you real str
Trend SniperX MT4
Sarvarbek Abduvoxobov
5 (6)
Trend Sniper X is a multi-timeframe trend-following indicator for MetaTrader 5 that helps traders identify trend direction and potential reversal points with clarity and precision. For MT5: https://www.mql5.com/en/market/product/181101 Price Information: The current price is promotional and is subject to change as upcoming updates and new features are released. Code2Profit Channel Master the Market with Multi-Timeframe Analysis! How to Maximize Your Win Rate with Trend Sniper X: Key Rules & Sess
Scalper Vault
Oleg Rodin
4.9 (41)
Scalper Vault is a powerful, fully-equipped trading system designed for traders who want to achieve consistency in intraday trading . This high-precision indicator serves as a complete, standalone trading system that delivers institutional-grade analysis for both Forex and Binary Options traders. PLEASE CONTACT ME AFTER PURCHASE TO GET MY TRADING TIPS PLUS A GREAT BONUS! By eliminating the guesswork and complex manual analysis, Scalper Vault allows you to focus purely on execution using easy t
Smart Trend Trading System is a chart indicator for MetaTrader 4 that brings trend information, entry and exit signals, and price levels into one workspace. It combines 10+ trading tools into one system, including trend detection, reversal zones, smart cloud, trailing stop logic, support and resistance, candle coloring, alerts, and multi-timeframe analysis. The system is designed to help you trade different market conditions: Trending markets: Identify the main trend, detect pullbacks, follow mo
SIO Oscillator: Self-Optimizing Semivariance Imbalance Oscillator Buy the indicator and get the Expert Advisor based on it for FREE. Most oscillators treat all price movement the same. SIO separates upside and downside market pressure and measures the imbalance between them, showing which side is really in control: buyers or sellers. When the imbalance reaches an extreme, SIO prints a clear signal with entry, Stop Loss and Take Profit levels. What makes SIO different is that it doesn’t rely on f
Advanced Supply Demand
Bernhard Schweigert
4.91 (302)
BLACK FRIDAY – 40% OFF Best Solution for any Newbie or Expert Trader! This indicator is a unique, high quality and affordable trading tool because we have incorporated a number of proprietary features and a new formula. With this update, you will be able to show double timeframe zones. You will not only be able to show a higher TF but to show both, the chart TF, PLUS the higher TF: SHOWING NESTED ZONES. All Supply Demand traders will love it. :) Important Information Revealed Maximize the potent
M1 Sniper
Oleg Rodin
4.97 (30)
M1 SNIPER  is an easy to use trading indicator system. It is an arrow indicator which is designed for M1 time frame. The indicator can be used as a standalone system for scalping on M1 time frame and it can be used as a part of your existing trading system. Though this trading system was designed specifically for short-term trading, it still can be helpful for all traders. This trading system can be used with any forex pair and time frame, though lower time frames are recommended from M1 up to M
Non repaint MT4
Yan Zhen Du
5 (2)
This is a professional chart indicator designed for traders focused on stability and clear price action. It helps filter market noise and provides clear visual entry and exit zones for your trading decisions. Core Features: Strictly Non-Repainting: The system is built with strict non-repaint logic. What you see on the chart is the true historical performance. Confirmed Signals: Signals are triggered and confirmed only after the candle closes . Once a trading arrow appears on a closed candle, it
Gann Made Easy
Oleg Rodin
4.84 (174)
Gann Made Easy is a professional and easy to use Forex trading system which is based on the best principles of trading using the theory of W.D. Gann. The indicator provides accurate BUY and SELL signals including Stop Loss and Take Profit levels. You can trade even on the go using PUSH notifications. PLEASE CONTACT ME AFTER PURCHASE TO GET TRADING  INSTRUCTIONS   AND GREAT EXTRA INDICATORS  FOR FREE! Probably you already heard about the Gann trading methods before. Usually the Gann theory is a
BLACK FRIDAY – 40% OFF Best Solution for any Newbie or Expert Trader! This dashboard software is working on 28 currency pairs plus one. It is based on 2 of our main indicators (Advanced Currency Strength 28 and Advanced Currency Impulse). It gives a great overview of the entire Forex market plus Gold or 1 indices. It shows Advanced Currency Strength values, currency speed of movement and signals for 28 Forex pairs in all (9) timeframes. Imagine how your trading will improve when you can watch th
Introducing ON Trade Waves Patterns Harmonic Elliot Wolfe, an advanced indicator designed to detect various market patterns using both manual and automated methods. Here's how it works: Harmonic Patterns: This indicator can identify harmonic patterns that appear on your chart. These patterns are essential for traders practicing harmonic trading theory, as popularized by Scott Carney's book "Harmonic Trading vol 1&2." Whether you draw them manually or rely on automated detection, ON Trade Waves
Zoryk Gold mt4
Reda El Koutbane
5 (3)
discount ends soon original price 69 $ ZORYK — Advanced XAUUSD Signal System for MetaTrader 4 You know the feeling. You spend time analyzing gold. You wait for the entry. You finally open the trade, and price immediately moves against you. You close too early, move the Stop Loss, or hesitate for a few seconds. Then the market reaches the exact destination you originally expected without you. The direction was not always the problem. The real problem was uncertainty. You did not know exactl
RFI levels PRO
Roman Podpora
5 (2)
RFI LEVELS PRO identifies reversal structures and key price-return zones where major market participants may become active. The indicator helps you detect the formation of a new trend, identify potential entry points, and control risk and profit levels in advance. VERSION MT5   —   The indicator reaches its full potential when used together with TREND LINES PRO . What the indicator shows: Reversal structures and levels activated at the beginning of a new trend. Potential entry points in the dire
Atomic Analyst
Issam Kassas
5 (14)
Atomic Analyst — MetaTrader 4 For product questions, setup guidance, or technical support, message me directly here on MQL5. The indicator turns complex market calculations into simple visual signals, color-coded candles, trend readings, stop-loss levels, and multiple take-profit zones that traders can understand quickly and use in real market conditions. Main Trading Uses: Scalping and intraday trading: Designed for fast decision-making, clear arrows, alerts, candle colors, and structured entry
ShapeRadar - Classic Chart Pattern Indicator ShapeRadar automatically finds classic technical analysis patterns on the chart: double and triple tops and bottoms, Head and Shoulders and its inverse, rising and falling wedges, rectangles, triangles, flags and pennants. When price closes beyond a pattern boundary, the indicator draws the pattern, the entry point, the stop-loss level and the target, and an information panel summarizes all detected patterns. MetaTrader 5 version:  https://www.mql5.co
Liquidity Scalper System: a liquidity-based trading system in indicator form. Most indicators only show an arrow, and the trader then has to decide where the stop goes, where the target is and whether the signal can be trusted at all. Liquidity Scalper System covers the full trade cycle: it finds liquidity pools, gives a signal when they are broken, immediately calculates Entry, Stop Loss and three targets, and shows statistics and out-of-sample test results on the panel. The system picks its o
PRO Renko System
Oleg Rodin
5 (31)
PRO Renko System is a highly accurate trading system specially designed for trading RENKO charts. The ARROWS and Trend Indicators DO NOT REPAINT! The system effectively neutralizes so called market noise giving you access to accurate reversal signals. The indicator is very easy to use and has only one parameter responsible for signal generation. You can easily adapt the tool to any trading instrument of your choice and the size of the renko bar. I am always ready to provide extra support to help
SR Liquidity
Oleg Rodin
5 (2)
SR Liquidity is a trading indicator designed to reveal the hidden zones where market liquidity concentrates and price reacts most strongly. These special liquidity areas act as powerful support and resistance levels, giving you a clear map of where the market is most likely to reverse. Instead of drawing ordinary Support/Resistance lines, SR Liquidity analyzes real price behavior to detect the zones where buying and selling pressure accumulate. These are actually the pools of liquidity that driv
Auto Optimized SpeedAngle is an institutional-grade momentum vectoring system that eliminates curve-fitting through continuous Walk-Forward Optimization (WFO). Rather than relying on static inputs that degrade when market regimes shift, the indicator dynamically recalibrates its parameters using Out-of-Sample (OOS) validation, ensuring the displayed signals represent genuine statistical edges rather than historical anomalies. By shifting the focus from subjective visual angles to normalized, qua
Italo Volume Indicator
Italo Santana Gomes
4.92 (79)
BUY INDICATOR AND GET EA FOR FREE AS A BONUS + SOME OTHER GIFTS! ITALO VOLUME INDICATOR  is the best volume indicator ever created, and why is that? The Indicator works on all time-frames and assets, indicator built after 7 years of experience on forex and many other markets. You know many volume indicators around the internet are not complete, does not help, and it's difficult to trade, but the Italo Volume Indicator is different , the Italo Volume Indicator shows the wave volume, when market
It estimates the most likely short-term price movement based on advanced mathematical calculations. Features Estimation of the immediate price movement on the chart's timeframe and every higher one; Calculation of the real market trend; Calculation of the most important support and resistance levels; Alerts for congestion zones, level crossings and trend changes; Light on system resources: lines and panel are only updated when a value changes; Self-adjusting: works on any symbol and any timefra
Route Lines Prices
Vitalyi Belyh
3 (1)
Route Lines Prices is an indicator designed for finding price directions. Its simple interface contains multiple algorithms for price behavior and future direction calculations. These algorithms include volatility calculations and price smoothing based on the timeframes used. The indicator has a single parameter for changing the " Calculating Price Values " value. The default value of 1 provides a balanced automatic calculation, which can be used without manually configuring the indicator. By m
CRT Candle Range Theory HTF MT4 - Ultimate CRT Indicator: Advanced ICT Concepts and Malaysian SnR Trading System Master the Market Maker's Footprints with the Most Advanced Candle Range Theory Indicator. Unlock the true power of Smart Money Concepts (SMC) and trade precisely like the institutions with the Ultimate CRT Indicator. Built exclusively for serious traders, this indicator automates the highly effective Candle Range Theory (CRT), a core pillar of ICT Concepts (Inner Circle Trader), and
All in One package includes the  Oscillator Predictor ,  MACD Predictor ,  Thrust Scanner  and  Advanced Fibonacci  indicators which are mandatory for applying  Dinapoli  trade plans.  Please visit below links for detailed explanations of indicators. Advanced Fibonacci Indicator =>  https://www.mql5.com/en/market/product/52834 Thrust Scanner Indicator => https://www.mql5.com/en/market/product/52830 Overbought /Oversold Predictor indicator => https://www.mql5.com/en/market/product/52621 Macd P
Imbalance Pro
Ivan Stefanov
5 (4)
Imbalance Pro is a volume imbalance indicator for MetaTrader 4 that measures the buying and selling volume of bulls and bears over the period you choose and draws a coloured line between the two points on your chart: green when the bulls have more volume, red when the bears do, with the percentage difference. Its window shows how the volume developed in time, and an adjustable alert is included. Use it to confirm trends, breakouts and support and resistance, and to spot reversals, on Forex, gol
AW Prime Oscillator
AW Trading Software Limited
5 (1)
A combination of two oscillators. The first one displays the entry points, the second shows the current trend . The indicator can display oscillator signals by arrows in two modes, all fast oscillator signals or signals only in the direction of the current trend. It has a multi-timeframe panel and three types of signal notifications. Benefits: Suitable for day and scalping trading Trend filtering Simple and sensitive setup Multi-timeframe panel Suitable for integration into an advisor. Works on
True Direction Oscillator
Muhammad Elbermawi
4.85 (364)
Or (TDO)  which is an index that measures the price rate of change using the principle of " Pure Momentum ". When a security price advances from 10 to 15 then the price rate of change is 150% but when it declines back from 15 to 10 then the price rate of change is 33.3% only. That is why technical analysis indicators like "Price Rate of Change" (ROC) or "Momentum" give higher readings for ascending price movements than those given to descending ones. TDO fixes this problem to help traders at rea
Indicator for manual trading and technical analysis for Forex. It consists of a trend indicator with the opening level of the trading day and a arrow indicator for determining entry points. The indicator does not recolor; it works when the candle closes. Contains several types of alerts for signal arrows. Can be configured to work on any chart, trading instrument or time frame. The work strategy is based on searching for price movements along the trend.  To make " Buy " transactions: The tre
Dark Support Resistance  is an Indicator for intraday trading. This Indicator is programmed to identify  Support and Resistance Lines , providing a high level of accuracy and reliability. Key benefits Easily visible lines Only the most important levels will be displayed Automated adjustment for each timeframe and instrument Easy to use even for beginners Never repaints, never backpaints, Not Lag 100% compatible with Expert Advisor development All types of alerts available: Pop-up, Email, Push
Volume Profile: multi-mode, multi-profile, drawn on the price chart The indicator draws a volume profile directly on the price chart, together with the Point of Control (POC) line, the Value Area (VAH and VAL) and optional peaks and valleys. Instead of reading volume in a separate bottom panel, the volume is shown at the price levels where it was traded, so price and volume can be read in one place. What the indicator displays POC (Point of Control) line : the price level with the highest traded
More from author
Stop-loss and take-profit levels sized from the expected daily range, with the lot that risks exactly your chosen % of balance. A stop that is too tight gets hit by normal noise; a stop that is too wide makes the lot tiny. Ballast Stop Sizer sizes the stop from how much the market is expected to move today. Expected daily range — from the average range of the last 5 and the last 20 trading days (weekend bars are ignored). Shown with how much of it today has already used. Buy and sell stop-loss a
FREE
Direct translation of blackcat's L3 Banker Fund Flow Trend Oscillator. Get push notifications on your phone app when a signal bar has formed. Historical signals are shown with buy/sell arrow right on the main chart. Indicator uses two data calculations to check for a cross below 25% level (a signal to go long) and above 75% level (a signal to short). For any further questions  feel free to contact me directly. Including requests for product improvements.
Two lines are being drawn in a separate window. And both are representing an angle of a trendline. One trendline is measured going across two price highs, but the other is measured across two lows. You get to choose the period from which the first price high and first price low is being determined. The second high and low comes from identical time period preceding the first one. Feel free to experiment with the period count until you get the confirmation you are looking for.
Line1: simple calculation of change in closing price for the chosen input period - named Velocity. Line2: simple calculation of change in velocity for the chosen input period - named Acceleration. Feel free to play with the input periods to find a profitable combination. For faster results it is best to do it in MT Optimizer. Can assist in either manual or automatic trading.
This is an Expert that gives you a control panel with two buttons - 'Hide Stops' and 'Show Stops'. With a click of a button you can hide your stoploss and takeprofit levels from your broker and restore them if necessary. When levels are hidden Expert tracks orders in the background and closes them as soon as the price exceeds hidden levels. It is not opening new orders just working with existing ones, only stoploss and takeprofit levels are not visible to the market. Choose zero as magic number
Keeps your prop-firm challenge inside its rules: fits every stop to the loss you have left, closes and locks before the daily or total limit, locks a reached profit target. A prop-firm challenge is usually lost to one rule: the maximum daily loss or the maximum total loss. Ballast Prop Guard watches the whole account — manual trades and every EA — and makes those limits very hard to break. What it does Fitted stops — every open trade gets a stop-loss so that, even if price jumps straight to all
One-click trading that sizes every lot from your risk %, adds a stop-loss to any trade without one, and locks trading after your daily loss limit. Most accounts are not lost by a bad strategy. They are lost by one trade without a stop, one oversized lot, or one bad day that turns into revenge trading. Ballast Risk Panel stops all three. 1. Buy / Sell with the right lot size Press BUY or SELL. Ballast Risk Panel calculates the lot so that the stop-loss loses exactly your chosen % of balance (defa
Manages your open trades for you: break-even, partial profit, ATR trailing stop and time exit — measured in R, never loosening a stop. Opening a trade is the easy part. Ballast Exit Manager handles the rest, the same way every time, for manual trades and trades from other EAs. Everything is measured in R = the trade's initial risk (the distance from entry to the first stop-loss). A trade at +1R has made as much as it risked. Break-even — at +1R (default) the stop moves to the entry price plus a
Closes all your trades together when their combined profit or loss reaches your target — in money or % of balance — with an optional trailing profit lock. Many trades open at once — from you, from several EAs, or a grid/basket strategy. Ballast Equity Target watches their combined result and closes them all together: Profit target in money and/or % of balance (the first one reached wins). Loss limit in money and/or % of balance. Trailing profit lock — once the basket is up X%, it may give back a
Hidden stop-loss and take-profit: your levels stay in the EA, not at the broker. Drag the lines to move them; a wider emergency stop stays as insurance. Ballast Stealth Stops keeps your stop-loss and take-profit inside the EA. When price reaches a level, the trade is closed at market. The broker sees only a much wider emergency stop (or nothing, if you choose). Takes over existing broker stops/targets, or sets hidden levels (fixed points or ATR multiple, target as a multiple of the stop). Drag t
One-cancels-other for MT4: when one pending order fills, the others are deleted at once. One-click straddle with stop, target, expiry and a risk-based lot. MetaTrader 4 has no built-in OCO. Place a buy stop above and a sell stop below before the news, one of them fills, and the other one is still waiting to open a second trade against you. Ballast OCO Orders deletes it for you. What it does OCO for any pending orders — buy/sell stop, buy/sell limit. Placed by hand, from the one-click button, or
One line at the price where all your open trades on the symbol together are at zero — swaps and commission included — plus lines for your basket profit target and loss limit. Three buys at different prices, one sell, a few EAs on the same chart: where is the price at which all of it together is back at zero? MT4 does not show it. Ballast Break Even draws that price as one line and keeps it up to date on every tick. What it shows Break-even line — the Bid price at which all open trades on the sym
Asia, London and New York session boxes, with statistics from the symbol's own history: average ranges, how often London breaks the Asian range, when the day's high and low form. Session boxes show where each session traded. Ballast Session Ranges also tells you what usually happens next on the symbol you are looking at, measured on its own history. On the chart Boxes for the Asian, London and New York sessions, with the range of each session in points. Session hours are inputs (server time), in
Shows what your open trades really add up to: net long/short per currency, index and metal exposure, and the money lost if every stop is hit. Buy EURUSD, buy EURJPY, buy USDJPY — three different trades? Not really: you are long EUR twice and short JPY twice. Ballast Exposure Meter adds up every open trade on the account and shows the real picture. Net exposure per currency — long or short, the amount in that currency and its value in your account currency, largest first. Indices, metals, stocks,
Your account on your phone: push notifications for equity drops, low margin, trades without a stop, AutoTrading switched off, lost connection, every trade and a daily summary. Running EAs on a VPS, or leaving a manual trade open while you are away? Ballast Account Alerts watches the whole account and tells your phone (MetaTrader mobile app push), the terminal (alert) or your e-mail. Alarms Equity down X% since the start of the day (default 5%), or below a fixed amount. Margin level below X% (def
Shows where your account loses money: trades without a stop-loss, worst symbols, weekdays, hours and holding times. Drop Ballast Loss Finder on any chart. In a second it reads your closed trades and tells you in plain words where the money goes: Total result, win rate, and how much of all your losses came from trades without a stop-loss . How much of your losses came from your 5 worst trades, and your longest losing streak. Biggest leaks: the worst symbol, direction, weekday, hour and holding ti
FREE
Averaging grid with a worst case you know before you start: a real broker stop on every trade, lots sized so all levels filled plus the stop = your chosen % of balance. Averaging grids win often and lose rarely, but when they lose, many accounts are gone. The cause is almost always the same: no stop, and lots that grow until the margin runs out. Ballast Grid Manager keeps the useful part of a grid and removes the unlimited part. How it works You decide the direction: click Start BUY grid or Star
L3 Banker Fund Flow Trend Oscillator v5 is a simple translation of blackcat's work from pine script (language used by TradingView platform) to mql5. It generates buy and sell signals when two calculated buffers cross over each other in the oversold and overbought oscillator territory. Current version does not offer any changable inputs, but could be easily added in the modified version if requested.
Keeps your prop-firm challenge inside its rules: fits every stop to the loss you have left, closes and locks before the daily or total limit, locks a reached profit target. A prop-firm challenge is usually lost to one rule: the maximum daily loss or the maximum total loss. Ballast Prop Guard watches the whole account — manual trades and every EA — and makes those limits very hard to break. What it does Fitted stops — every open position gets a stop-loss so that, even if price jumps straight to a
One-click trading that sizes every lot from your risk %, adds a stop-loss to any trade without one, and locks trading after your daily loss limit. Most accounts are not lost by a bad strategy. They are lost by one trade without a stop, one oversized lot, or one bad day that turns into revenge trading. Ballast Risk Panel stops all three. 1. Buy / Sell with the right lot size Press BUY or SELL. Ballast Risk Panel calculates the lot so that the stop-loss loses exactly your chosen % of balance (defa
Manages your open trades for you: break-even, partial profit, ATR trailing stop and time exit — measured in R, never loosening a stop. Opening a trade is the easy part. Ballast Exit Manager handles the rest, the same way every time, for manual trades and trades from other EAs. Everything is measured in R = the trade's initial risk (the distance from entry to the first stop-loss). A trade at +1R has made as much as it risked. Break-even — at +1R (default) the stop moves to the entry price plus a
Closes positions and blocks trading around important news, using MT5's built-in economic calendar. Protects manual trades and other EAs. Big news (interest rates, jobs reports, inflation) can move price more in one minute than in the whole day before it, with wide spreads and slippage. Many prop firms forbid holding trades through it. Ballast News Shield handles it for you. Reads the built-in MT5 economic calendar — no DLL, no web requests, no settings to allow URLs. A set number of minutes befo
Shows where your account loses money: trades without a stop-loss, worst symbols, weekdays, hours and holding times. Drop Ballast Loss Finder on any chart. In a second it reads your closed trades and tells you in plain words where the money goes: Total result, win rate, and how much of all your losses came from trades without a stop-loss . How much of your losses came from your 5 worst trades, and your longest losing streak. Biggest leaks: the worst symbol, direction, weekday, hour and holding ti
FREE
Closes all your positions together when their combined profit or loss reaches your target — in money or % of balance — with an optional trailing profit lock. Many trades open at once — from you, from several EAs, or a grid/basket strategy. Ballast Equity Target watches their combined result and closes them all together: Profit target in money and/or % of balance (the first one reached wins). Loss limit in money and/or % of balance. Trailing profit lock — once the basket is up X%, it may give bac
Hidden stop-loss and take-profit: your levels stay in the EA, not at the broker. Drag the lines to move them; a wider emergency stop stays as insurance. Ballast Stealth Stops keeps your stop-loss and take-profit inside the EA. When price reaches a level, the position is closed at market. The broker sees only a much wider emergency stop (or nothing, if you choose). Takes over existing broker stops/targets, or sets hidden levels (fixed points or ATR multiple, target as a multiple of the stop). Dra
Your account on your phone: push notifications for equity drops, low margin, trades without a stop, Algo Trading switched off, lost connection, every trade and a daily summary. Running EAs on a VPS, or leaving a manual trade open while you are away? Ballast Account Alerts watches the whole account and tells your phone (MT5 mobile app push), the terminal (alert) or your e-mail. Alarms Equity down X% since the start of the day (default 5%), or below a fixed amount. Margin level below X% (default 2
Shows what your open trades really add up to: net long/short per currency, index and metal exposure, and the money lost if every stop is hit. Buy EURUSD, buy EURJPY, buy USDJPY — three different trades? Not really: you are long EUR twice and short JPY twice. Ballast Exposure Meter adds up every open position on the account and shows the real picture. Net exposure per currency — long or short, the amount in that currency and its value in your account currency, largest first. Indices, metals, stoc
One line at the price where all your open trades on the symbol together are at zero — swaps and commission included — plus lines for your basket profit target and loss limit. Three buys at different prices, one sell, a few EAs on the same chart: where is the price at which all of it together is back at zero? MT5 does not show it. Ballast Break Even draws that price as one line and keeps it up to date on every tick. What it shows Break-even line — the Bid price at which all open positions on the
Asia, London and New York session boxes, with statistics from the symbol's own history: average ranges, how often London breaks the Asian range, when the day's high and low form. Session boxes show where each session traded. Ballast Session Ranges also tells you what usually happens next on the symbol you are looking at, measured on its own history. On the chart Boxes for the Asian, London and New York sessions, with the range of each session in points. Session hours are inputs (server time), in
One-cancels-other for MT5: when one pending order fills, the others are deleted at once. One-click straddle with stop, target, expiry and a risk-based lot. MetaTrader 5 has no built-in OCO. Place a buy stop above and a sell stop below before the news, one of them fills, and the other one is still waiting to open a second trade against you. Ballast OCO Orders deletes it for you. What it does OCO for any pending orders — buy/sell stop, buy/sell limit, stop-limit. Placed by hand, from the one-click
Filter:
No reviews
Reply to review