ShapeRadar MT4
- Indicators
- Version: 1.0
- Activations: 20

ShapeRadar - Classic Chart Pattern Indicator
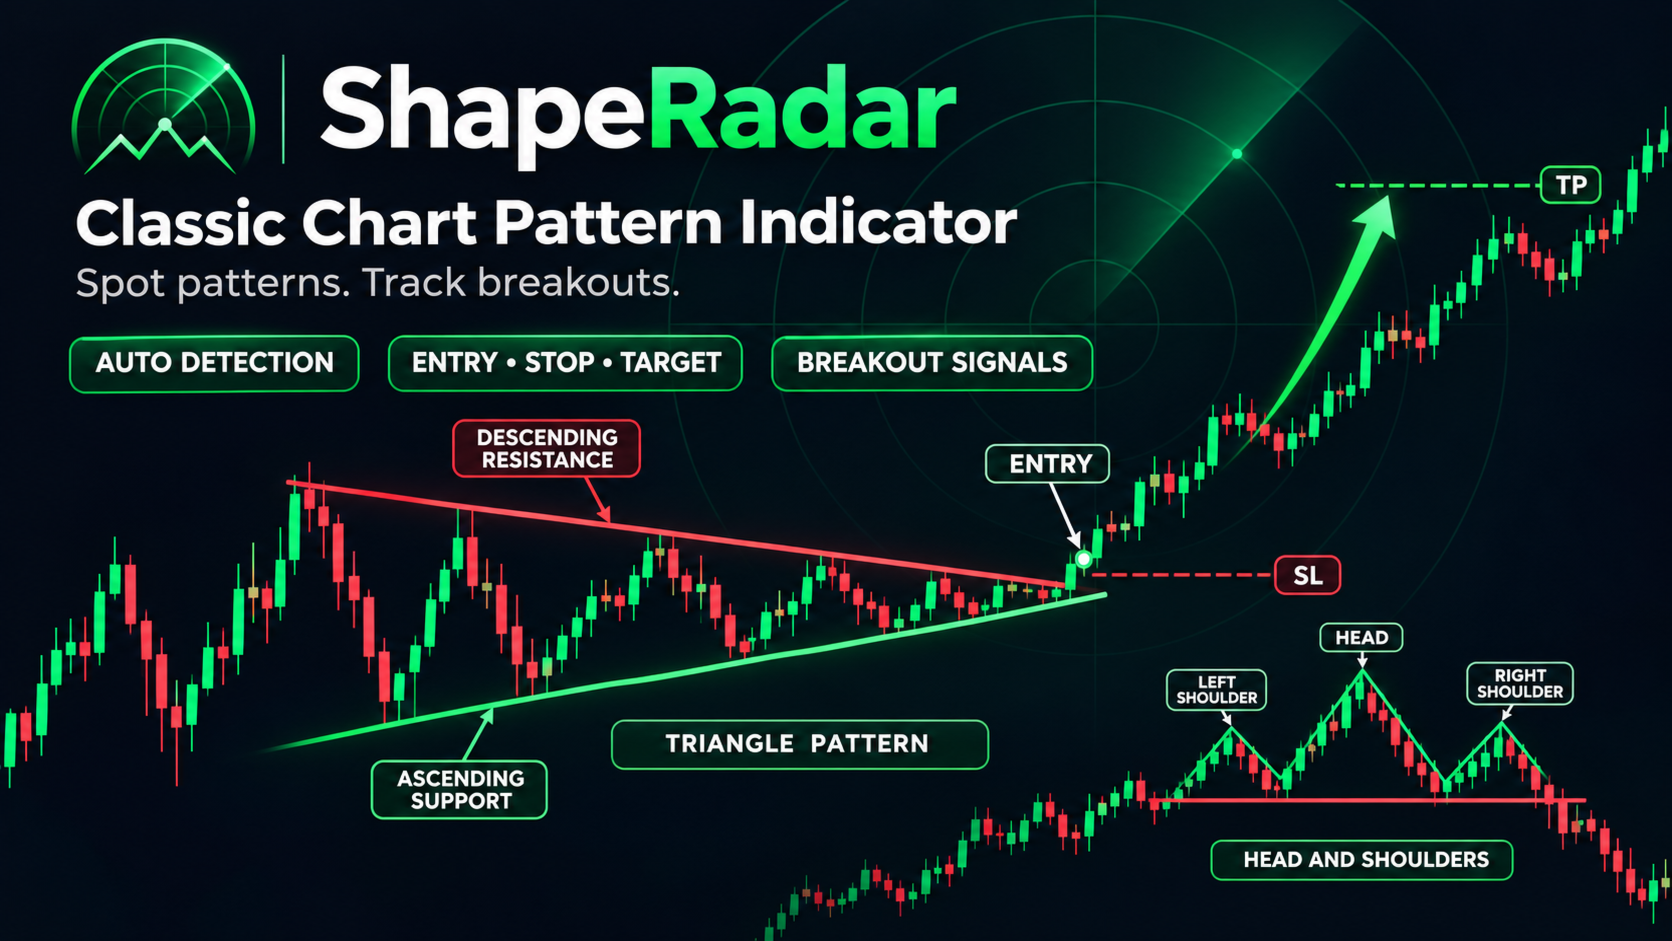
ShapeRadar automatically finds classic technical analysis patterns on the chart: double and triple tops and bottoms, Head and Shoulders and its inverse, rising and falling wedges, rectangles, triangles, flags and pennants. When price closes beyond a pattern boundary, the indicator draws the pattern, the entry point, the stop-loss level and the target, and an information panel summarizes all detected patterns.
MetaTrader 5 version: https://www.mql5.com/en/market/product/208462
The indicator works on any symbol and timeframe. A signal is confirmed only on a candle close, so marks that are already drawn do not disappear or repaint on the current bar. The chart shows where the pattern is, where the breakout happened, and where the entry, stop and target are, while the panel collects everything in one place.
Please subscribe to my channel: https://www.mql5.com/en/channels/algotrader
ATTENTION - A GIFT! PLEASE CONTACT ME AFTER PURCHASE TO GET ANY OF MY INDICATORS FOR FREE!
Patterns detected
- Double Top and Double Bottom
- Triple Top and Triple Bottom
- Head and Shoulders, Inverse Head and Shoulders
- Rising and Falling Wedge
- Rectangle
- Symmetrical, Ascending and Descending Triangles
- Bull and Bear Flags
- Bull and Bear Pennants
What you see on the chart
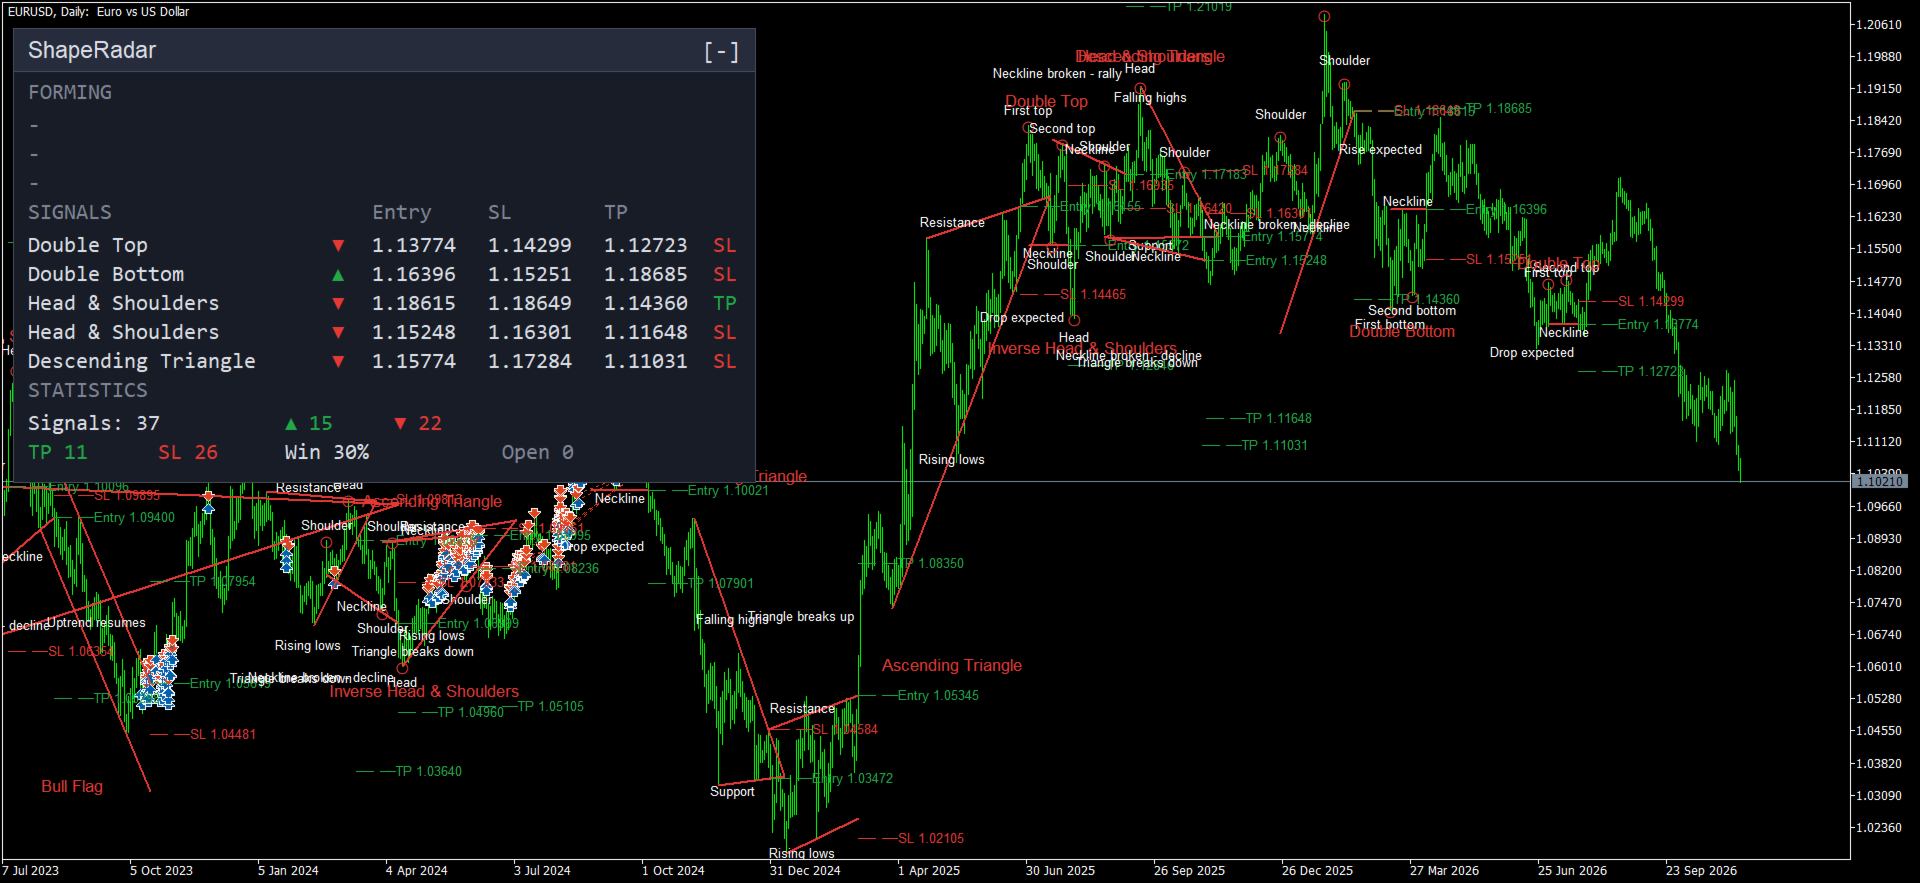
- Pattern lines: the neckline, or the boundaries of a wedge, triangle, flag or rectangle.
- Circles and captions on key points (tops, bottoms, head, shoulders) and a caption describing the expected move.
- The pattern name above or below the figure.
- Entry, SL and TP levels as short dashed lines with prices. The target is projected from the size of the pattern, and the stop is placed according to its geometry.
- Gray dashed lines for patterns that are complete but not yet broken (the “Forming patterns” setting).
Information panel
The panel sits in the upper left corner by default. You can drag it with the mouse from any spot, collapse it with the [-] / [+] button in the header, and scale it. Its position and state are remembered for each chart. It has three blocks.
The “Forming” block
This block shows patterns that are fully formed on the chart but where price has not yet closed beyond their boundary. These are patterns waiting for a breakout. There are three rows, one per group: reversals from tops, reversals from bottoms, and two-line shapes (wedges, triangles, rectangle, flags, pennants). Each row shows:
- the name of the detected pattern;
- an arrow with the expected direction: red down, green up, and two arrows mean a breakout is possible either way;
- a waiting counter in the form “elapsed / maximum bars”. The maximum is set by “Bars to wait for breakout”.
Why it is useful: it is an early warning. The trader sees the pattern before the breakout and can prepare a scenario in advance: know the level to watch, set an alert or a pending order near the boundary, and estimate the distance to the entry and the target. A pattern leaves the block in one of these cases:
- price closed beyond the boundary and it became a signal (it moves to the “Signals” block);
- the pattern was cancelled: price closed beyond the opposite boundary;
- the waiting time expired;
- the pattern reached its end, for example the apex of a triangle;
- the chart structure changed and the pattern was rebuilt.
A dash in the block means there are no completed patterns waiting right now. This is normal: patterns do not appear all the time, and in many cases price breaks the boundary right after the pattern is finally confirmed, so it goes straight to the “Signals” block.
The “Signals” block
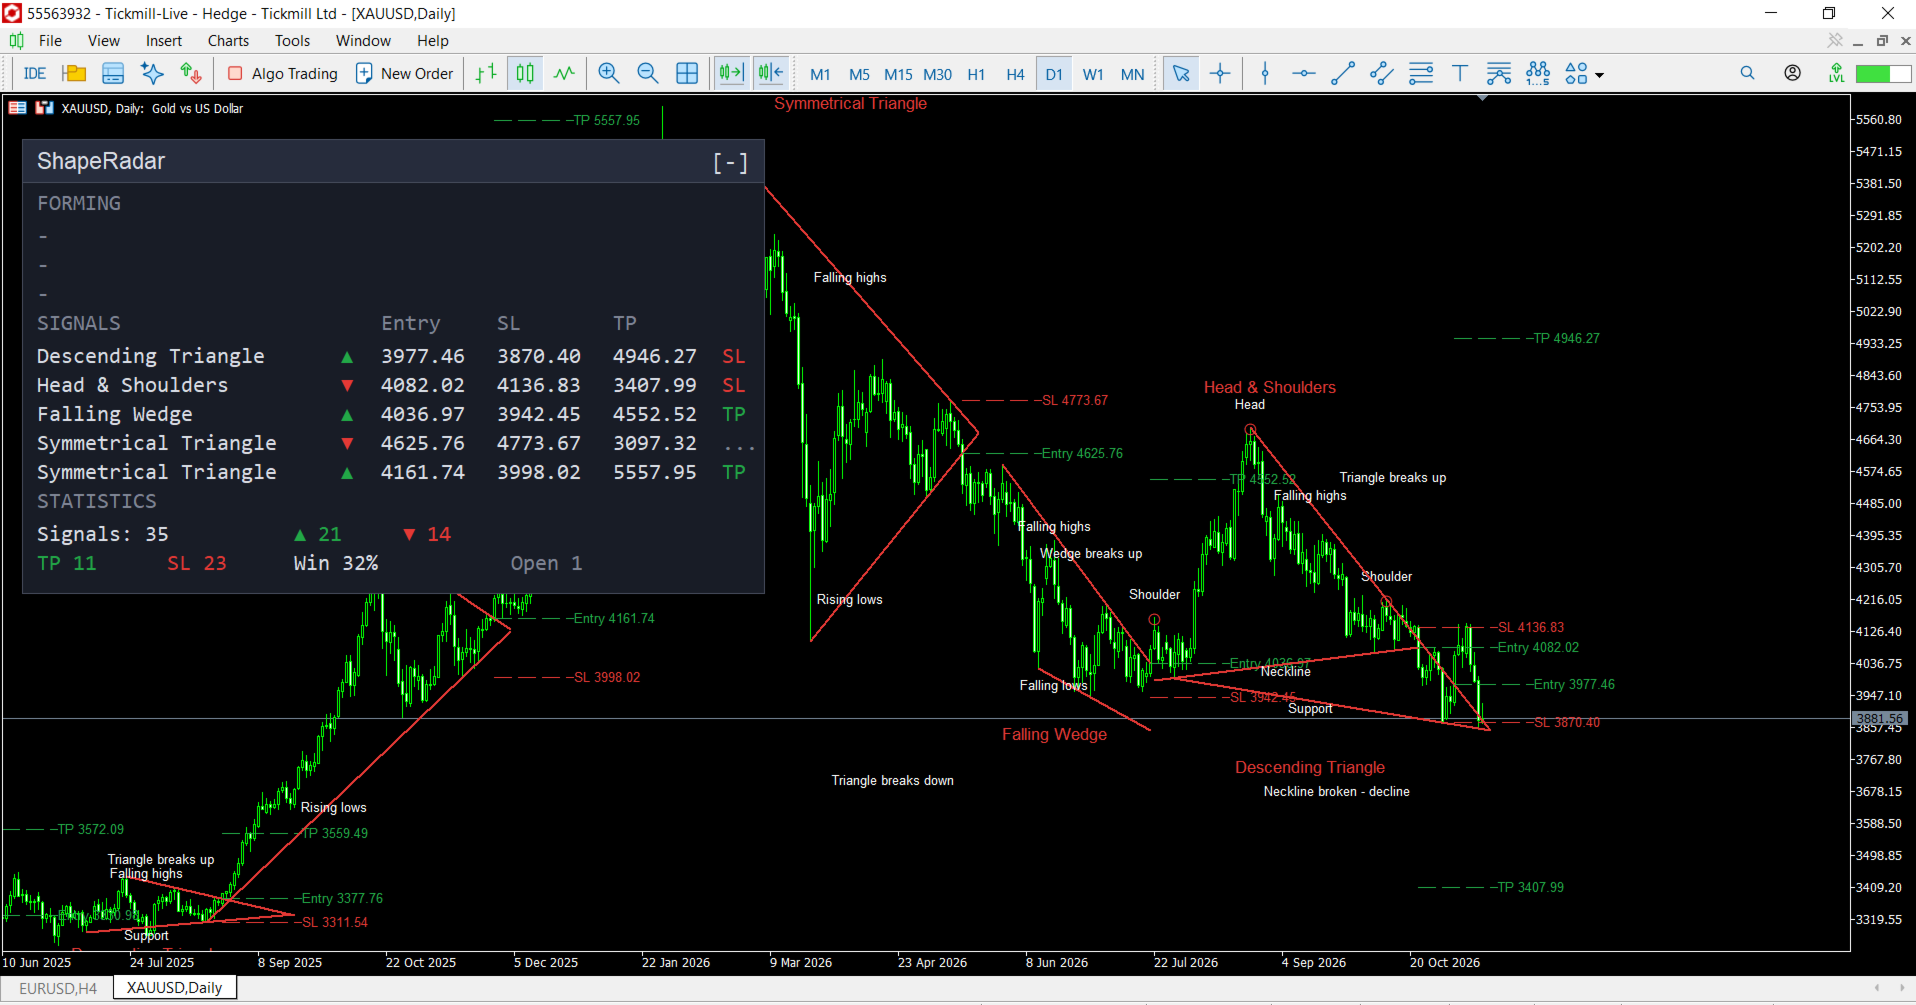
The last 5 signals, newest first. Columns:
- pattern name;
- direction arrow (green up for buy, red down for sell);
- Entry - entry price;
- SL - stop-loss level;
- TP - target;
- result: “TP” - target reached, “SL” - stop hit, “...” - the signal is still active, “-” - neither was reached for a long time.
The block lets you match a signal on the chart with exact prices and quickly see how the previous ones ended.
The “Statistics” block
- Signals - total number of detected signals, with the number of up and down signals next to it.
- TP - how many signals reached the target.
- SL - how many signals ended with a stop.
- Win - the share of signals that reached the target among completed ones (TP / (TP + SL)).
- Open - how many signals are still active.
The statistics are calculated over the analyzed history and help you judge how patterns behave on a specific symbol and timeframe. If both the stop and the target are touched within one candle, the stop is counted. Choose instruments and settings where the numbers suit you.
How to use
- Attach the indicator to a chart and keep the default settings.
- Watch the “Forming” block: it shows where a signal may appear soon.
- After a signal, use the Entry, SL and TP from the chart as reference points for a trade.
- To refine results, turn off patterns you do not need and change sensitivity.
- Judge quality with the “Statistics” block on your chosen instrument.
- Enable alerts so you do not have to watch the chart all the time.
- Expert Advisors can read 4 hidden buffers: signal code (pattern number, the sign shows direction), entry price, stop loss and take profit.
Settings
Detection
- Swing length (bars on each side) - how many bars on each side a peak or trough needs to count as significant. A lower value gives more patterns but more noise; a higher value gives fewer, larger patterns.
- Equal highs/lows tolerance, % - how much the tops or bottoms of double and triple patterns and the boundaries of a rectangle may differ, as a percentage of the pattern height.
- Shoulder symmetry, % - the allowed difference between the shoulders in Head and Shoulders.
- Trendline touch tolerance, % - how far a point may be from a line and still count as a touch; the same tolerance limits how far candle bodies may cut through the lines.
- Flat line tolerance, % - how much a line may slope and still count as horizontal (rectangle, triangles).
- Parallel / converging, % - tolerance for lines being parallel (flags) or converging (wedges, triangles, pennants).
- Flag/pennant pole >= x first pullback - how much larger the impulse before a flag or pennant must be than the first pullback inside the pattern. A higher value means stricter selection.
- Minimum pattern height (ATR) - the minimum pattern height measured in ATR. It filters out small, insignificant patterns.
- Bars to wait for breakout - how many bars to wait for a breakout after the pattern completes before dropping it.
- Longest pattern (bars) - the maximum pattern length in bars.
- Head & Shoulders target measured from - what the Head and Shoulders target is based on: Head or Shoulder.
- History bars to analyze (0 = all) - how many history bars to analyze. A lower value loads faster; 0 means all history.
Patterns
- Double Top / Bottom, Triple Top / Bottom, Head & Shoulders (+ inverse), Rising / Falling Wedge, Rectangle, Triangles, Flags, Pennants - enable or disable the corresponding patterns.
Drawing
- Circles and captions - circles on key points and text captions.
- Entry / SL / TP levels - lines and labels for the entry, stop and target.
- Pattern name - the pattern name on the chart.
- Forming patterns - gray dashed lines for patterns waiting for a breakout.
- Patterns kept on chart - how many recent patterns to keep on the chart; older ones are removed.
- Level line length (bars) - the length of the Entry / SL / TP lines in bars.
- Line width - the thickness of pattern lines.
- Text size - text size on the chart: Small, Normal, Large.
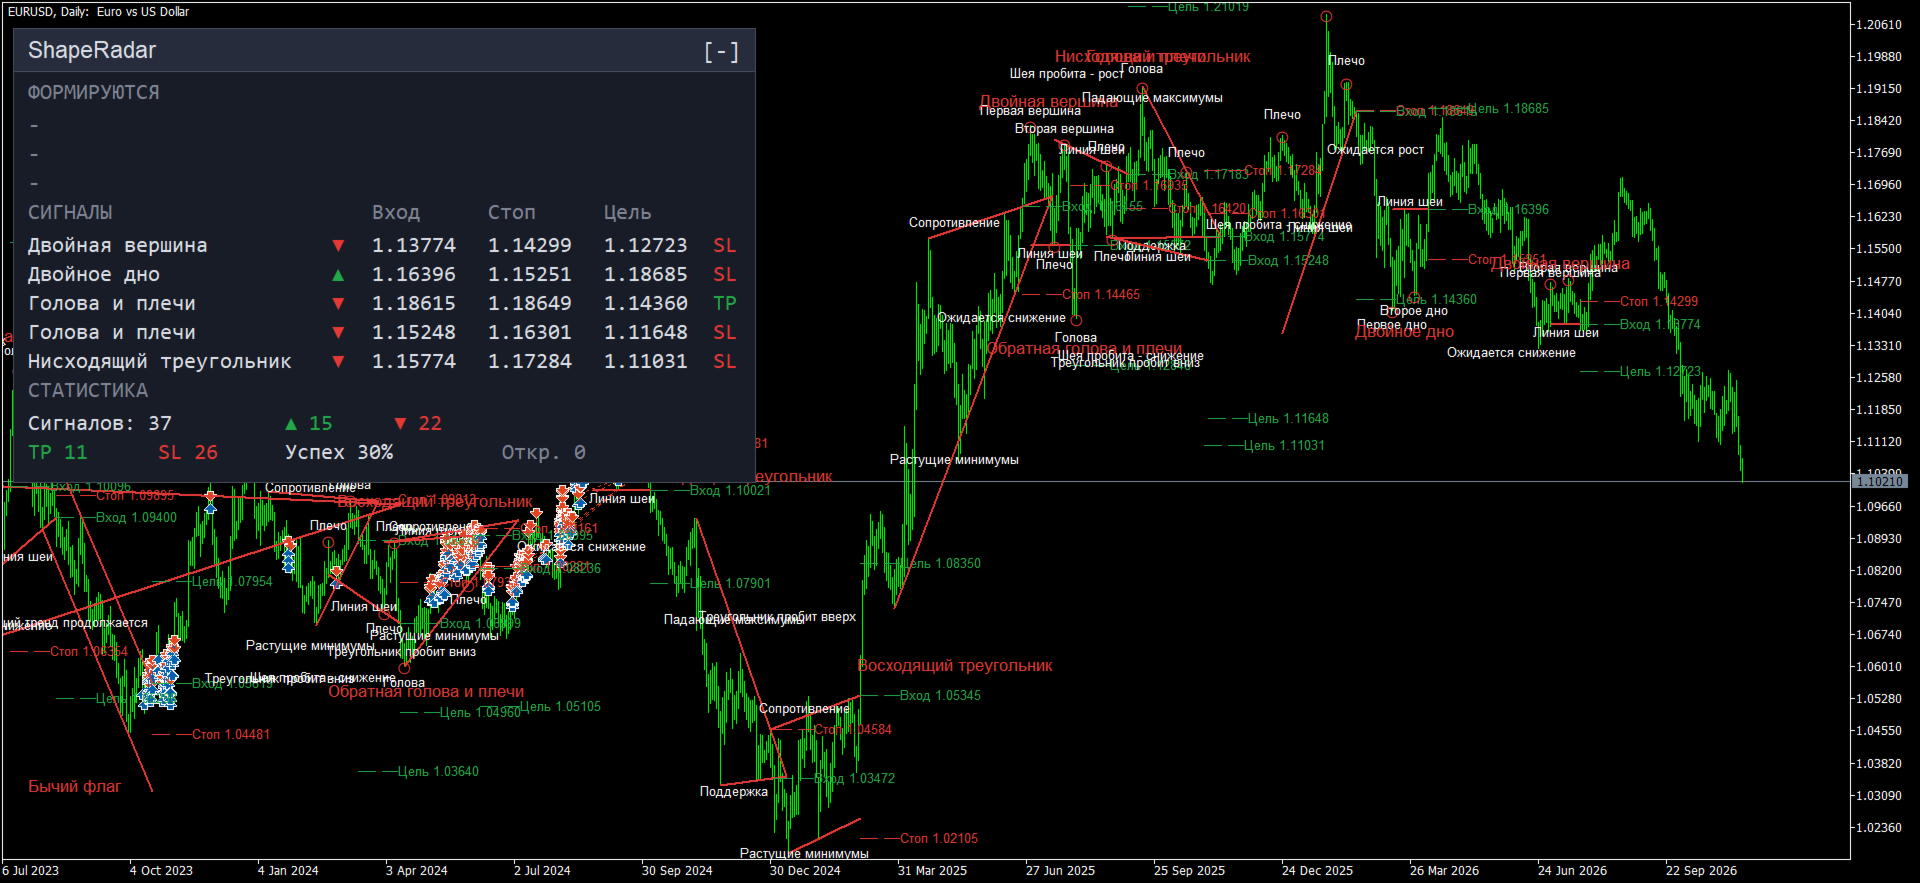
- Chart text language - language of chart labels and the panel: English or Russian.
Alerts
- Popup alert, Push notification, Email - ways to be notified about a new signal.
Colors
- Pattern lines - color of pattern lines and the pattern name.
- Entry and TP - color of the entry, the target and buy arrows.
- Stop loss - color of the stop and sell arrows.
- Forming patterns - color of the lines of forming patterns.
Panel
- Show panel - show or hide the panel.
- Panel scale, % (0 = adaptive to chart) - panel scale in percent. At 0 the panel adjusts itself to the chart window size.
- Panel X offset (from left) and Panel Y offset (from top) - the starting position of the panel. The default is the upper left corner.
- Panel background, Panel border, Panel text - panel colors.