Ballast Stop Sizer MT4

Stop-loss and take-profit levels sized from the expected daily range, with the lot that risks exactly your chosen % of balance.

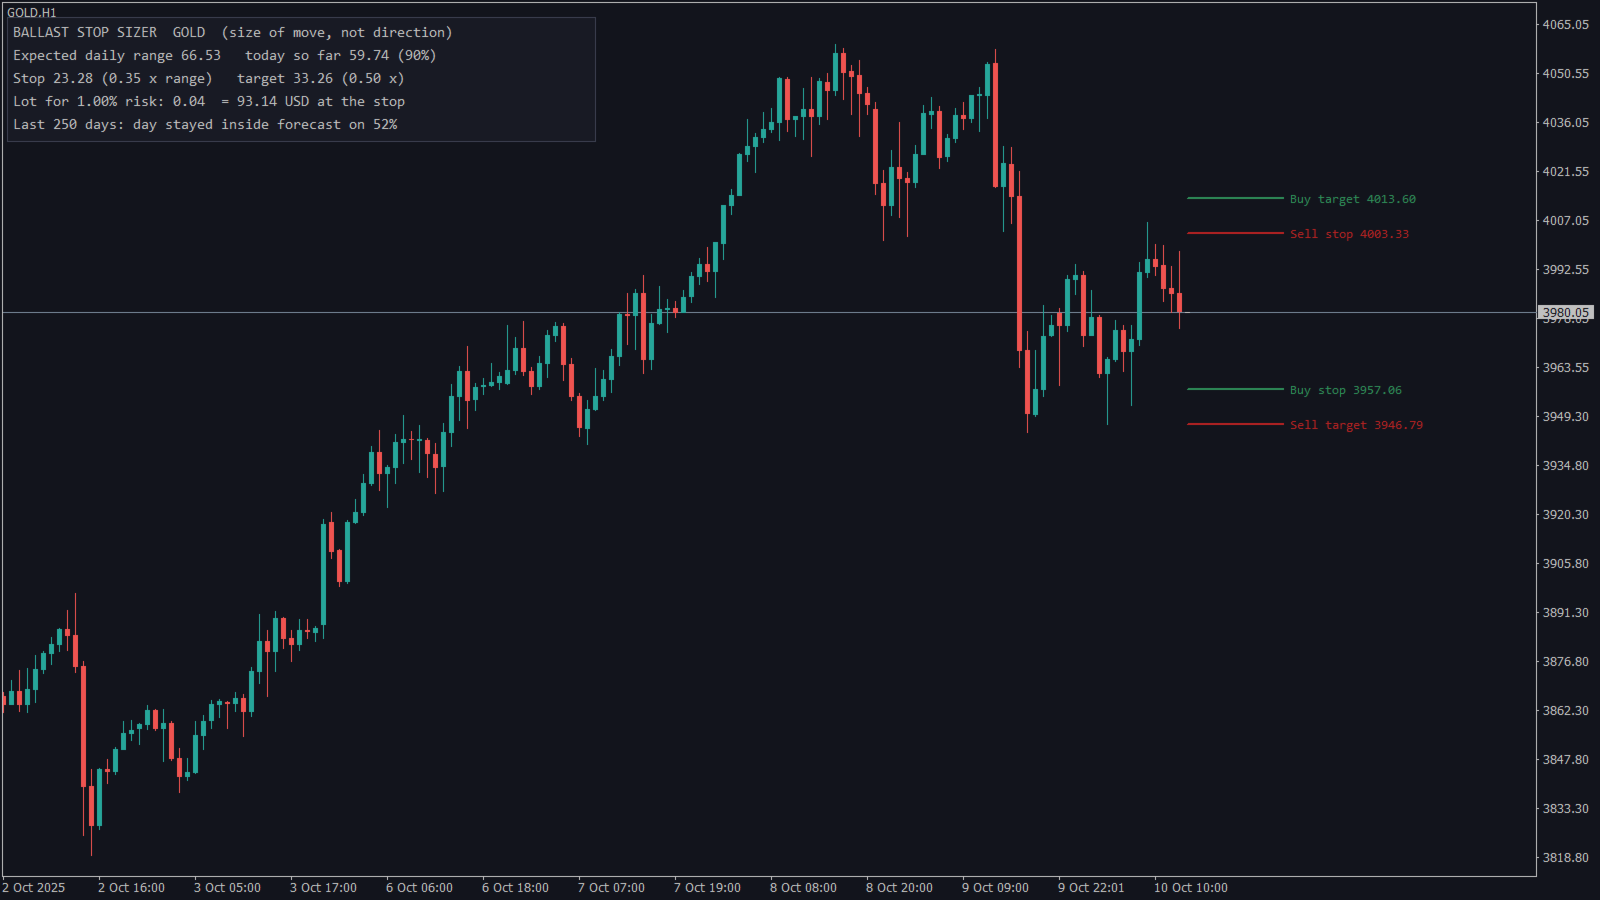
A stop that is too tight gets hit by normal noise; a stop that is too wide makes the lot tiny. Ballast Stop Sizer sizes the stop from how much the market is expected to move today.

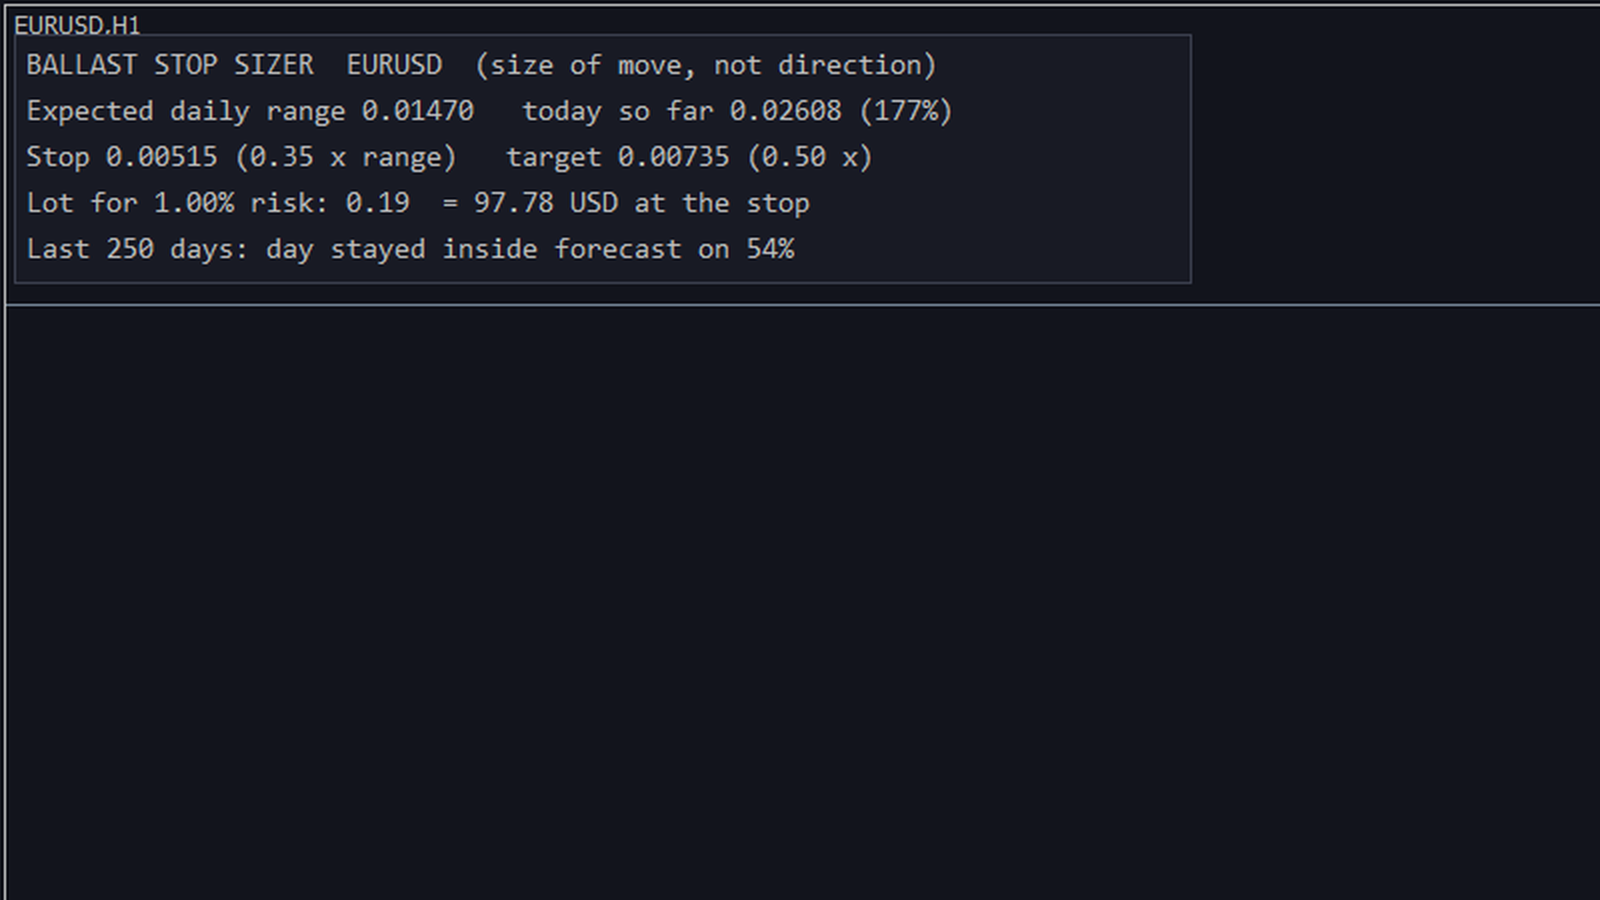
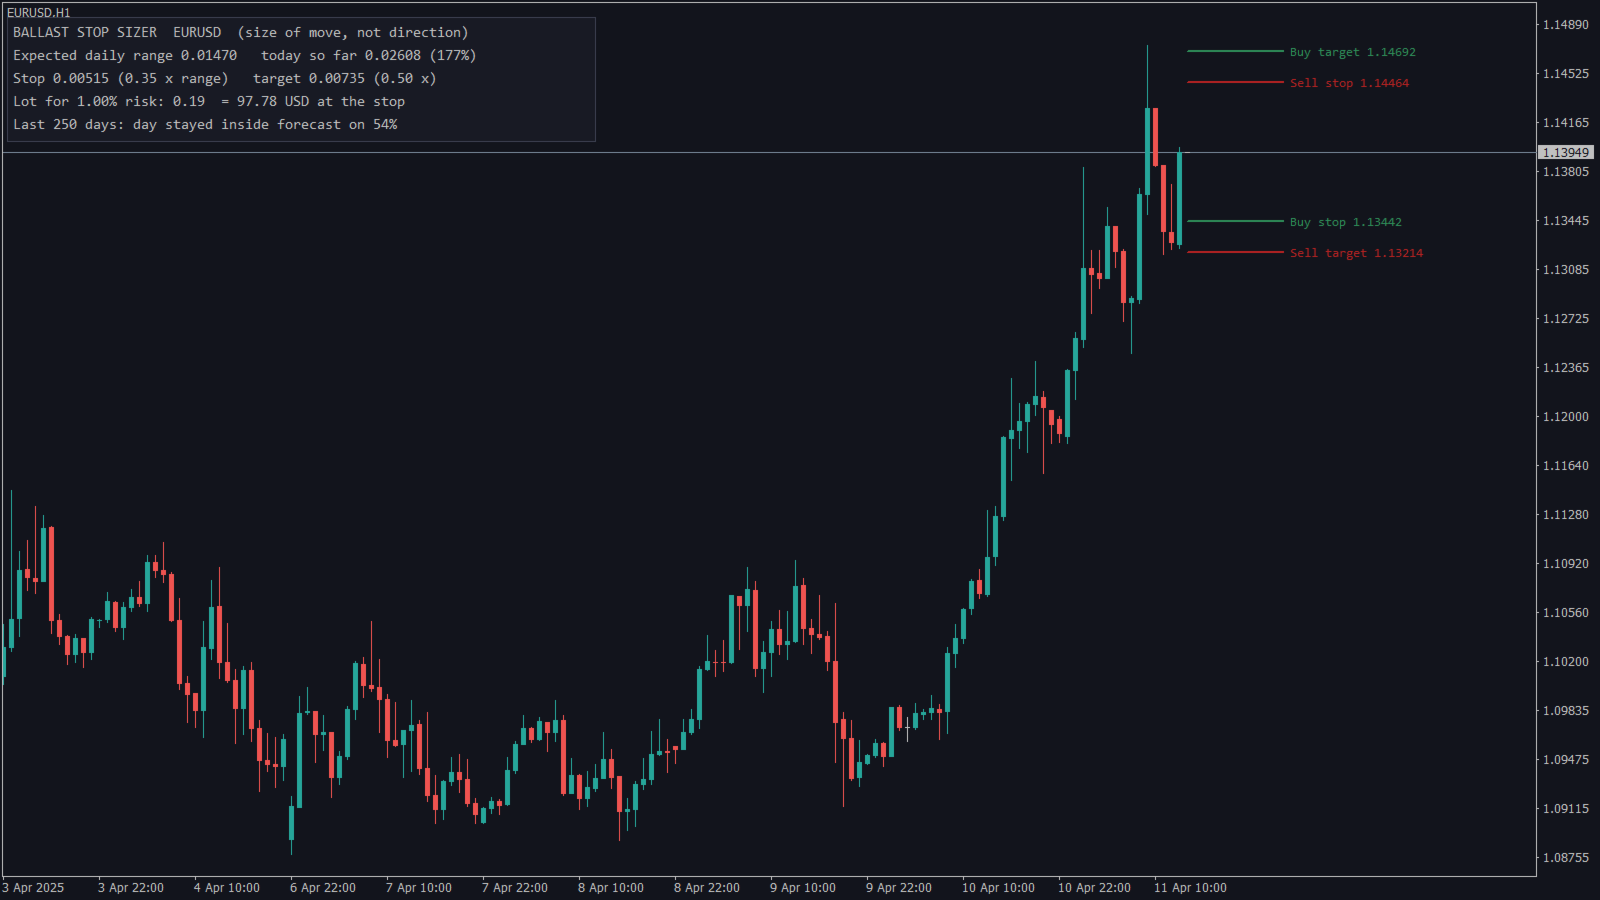
  • Expected daily range — from the average range of the last 5 and the last 20 trading days (weekend bars are ignored). Shown with how much of it today has already used.
  • Buy and sell stop-loss and target lines at a chosen fraction of the expected range (default stop 0.35×, target 0.50×), drawn next to the current price.
  • Lot size for your risk % and the money lost at the stop.
  • Honest check: how often a past day stayed inside its forecast, measured on the last 250 days.
  • Optional alert when today's range reaches the expected range.
  • Three buffers for EA developers (iCustom): expected range, buy stop-loss and sell stop-loss for every bar.

The indicator forecasts the size of the move, never its direction.

Tested on MT4

  • 406 trading days in the MT4 Strategy Tester (EURUSD H1 for one year, Gold M5 for seven months). Each day's range, buy stop and sell stop were compared with values calculated independently by the test from the daily bars: 0 mismatches.
  • Ran without errors in the MT4 Strategy Tester on EURUSD M1, M15, H1 and H4 and on Gold H1 and M15, with USD and EUR accounts from 100 to 10,000.

Inputs

  • Stop = × expected range — 0.35
  • Target = × expected range — 0.50 (0 = none)
  • Risk % for the lot size — 1.0
  • Days used for the check — 250
  • Alert at 100% — false
  • Colours, font size, panel corner — adjustable

Next step

Ballast Stop Sizer is free. If you want the lot size and stop placed for you on every trade, see Ballast Risk Panel; for prop-firm challenges, see Ballast Prop Guard.

  • This is the MT4 version. The MT5 version is a separate product on the Market.
Produits recommandés
The   Pivot Point indicator   automatically calculates and displays the pivot point line and support and resistance levels. Pivot can be calculated according to the Classic, Floor, Fibonacci, Woodie, Camarilla or DeMark formula. It is also possible to select the period for calculating the indicator. A trader can choose from daily, weekly, monthly, or user-defined periods. Types of pivots Classic Floor Fibonacci Woodie Camarilla DeMark Main features The indicator shows the current and historic
FREE
FREE for the First 50 Users ================================================================   ShowKillZones v1.0   - Corrected NY AM end time from 11 to 10, and NY PM end time from 17 to 16 (adjusted to Kill Zone hours) [cite: 321, 326]   - Changed NY AM/PM labels to Kill Zone [cite: 321, 326] v1.0  -  User Manual [cite: 321] ================================================================ [Overview] This indicator displays ICT Kill Zones (session hours) on the chart as background zones an
FREE
RelicusRoad Daily Pivots est un indicateur de points pivots journaliers pour MetaTrader 4 et MetaTrader 5 qui divise la plage du jour précédent en niveaux de Fibonacci et les prolonge au-dessus et en dessous, de moins 100 à plus 200 pour cent. Au lieu de pivots classiques de type floor, la plage précédente terminée est traitée comme une échelle où le plus bas vaut 0 % et le plus haut 100 %. Dix-neuf niveaux sont imprimés sous forme de petits repères colorés au bord droit du graphique, si bien qu
FREE
The indicator represents the session boxes for the Asian, European and American sessions. It is possible to change the time of each session, such as color. It is also possible to disable the display of each session. You will find in input parameters variables to modify time sessions  in format hh:mm and  the color of boxes of each sessions. If you need some implementations please contact me.
FREE
Swap Detector
Dustin Ricardo Pierenz
The Swap Detector is an essential MQL4 utility that displays the swap costs of any instrument when applied to a chart. It helps traders make informed decisions by visually indicating the swap value in customizable colors— green for positive (good) and red for negative (bad) by default. This tool ensures transparency in overnight holding costs, enabling better trade planning and risk management
FREE
Niveaux de Support et de Résistance ZigZag  est un indicateur qui identifie les niveaux de support et de résistance à partir des points pivots du ZigZag, avec désormais un panneau de contrôle interactif directement sur le graphique. Il regroupe les niveaux proches en zones à l’aide d’une méthode de clustering afin de visualiser les zones où le prix a réagi à plusieurs reprises, et distingue les niveaux cassés (breakout) des niveaux actifs (extension). Fonctionnalités principales 1. Détection de
FREE
Market Sessions Time MT4
Juan Facundo Valdes
3.5 (4)
Affiche la session actuelle des principaux marchés et le temps restant pour démarrer les prochaines. Marchés New York Londres Francfort Tokio Sidney 1 session supplémentaire avec nom personnalisé, heure d'ouverture et de fermeture Heure de l'horloge GMT/UTC Local (depuis l'ordinateur) Courtier (heure du serveur) L'heure par défaut dans les paramètres est GMT. Après être passé à l'heure locale ou à l'heure du courtier, il est nécessaire d'ajuster manuellement l'heure d'ouverture et de fermetur
FREE
Automatic Fibonacci Pivots
Martin Alejandro Bamonte
Now free. The key Fibonacci pivot levels, drawn for you automatically every day, on any timeframe. Automatic Fibonacci Pivots calculates the daily support and resistance from the Fibonacci sequence and plots them clean on your chart: the daily pivot, S1/S2/S3 below and R1/R2/R3 above. These are the price zones where the market tends to react, bounce or break, and now you see them without drawing a single line. What it does: - Daily Fibonacci pivot levels (pivot, S1/S2/S3, R1/R2/R3), updated
FREE
VR Watch list and Linker
Vladimir Pastushak
4.63 (8)
Liste de surveillance VR et Linker - application de filtrage pour le terminal MétaTrader . Facilite la recherche des instruments financiers les plus intéressants et techniques. Ce filtre est utilisé par les traders pour négocier sur des bourses telles que bybit, la Bourse de Moscou, l'American Exchange, le marché des changes et des crypto-monnaies, le marché des métaux, et est utilisé pour le trading dans des sociétés accessoires. La sélection des instruments financiers est effectuée manuellemen
FREE
Silver Bullet MT4
Saksham Solanki
5 (2)
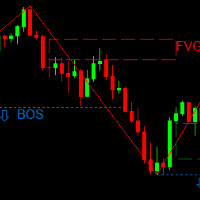
Contact me for any queries or custom orders, if you want to use this in an EA. Key Features: Pattern Recognition : Identifies Fair Value Gaps (FVGs) Spots Break of Structure (BOS) points Detects Change of Character (CHoCH) patterns Versatile Application : Optimized for candlestick charts Compatible with any chart type and financial instrument Real-Time and Historical Analysis : Works seamlessly with both real-time and historical data Allows for backtesting strategies and live market analysis Vi
FREE
Show Pips
Roman Podpora
4.27 (59)
Cet indicateur d'information sera utile pour ceux qui veulent toujours être au courant de la situation actuelle du compte. L'indicateur affiche des données telles que le profit en points, en pourcentage et en devise, ainsi que le spread pour la paire actuelle et le temps jusqu'à la fermeture de la barre sur la période actuelle. VERSIONMT5 -   Des indicateurs plus utiles Il existe plusieurs options pour placer la ligne d'information sur le graphique : À droite du prix (passe derrière le prix) ;
FREE
MQLTA Support Resistance Lines is an indicator that calculates the historical levels of Support and Resistance and display them as Lines on chart. It will also Alert you if the price is in a Safe or Dangerous zone to trade and show you the distance to the next level. The indicator is ideal to be used in other Expert Advisor through the iCustom function. This DEMO only works with AUDNZD, the full product can be found at https://www.mql5.com/en/market/product/26328 How does it work? The indicator
FREE
Shadow Flare MT4
Kestutis Balciunas
L’indicateur Shadow Flare est un outil de tendance et de liquidité non re‑dessinant pour MetaTrader 4. Il calcule une ligne de base configurable à partir d’une moyenne mobile (HMA, EMA, SMA ou RMA), l’entoure d’une enveloppe basée sur l’Average True Range et produit un état de tendance « collant » qui ne bascule que lorsque le prix de clôture franchit la bande supérieure ou inférieure. Le même moteur de tendance alimente un module automatique de zones d’offre/demande qui détecte les sommets et c
FREE
AC Pivot Panel – Your Ultimate Pivot Trading Tool The   AC Pivot Panel   is a powerful yet user-friendly pivot point indicator designed to help traders identify key support and resistance levels with ease. Whether you’re a beginner or an experienced trader, this indicator simplifies pivot trading and enhances your decision-making process. Key Features : Interactive Selection Panel : Easily adjust pivot settings directly on the chart with a compact and intuitive panel. Multiple Pivot Methods : C
FREE
Maps
Pavel Shutovskiy
4.75 (4)
The indicator displays on the chart a map, on which markers show the current trading session, as well as shows a text. The indicator provides two types of background display: white and black. The indicator is displayed as the background and does not hinder tracking the current market situation. Parameters: GMT -  the time difference of the terminal and GMT. Background - selection of background - black or white.
FREE
The selective pin bar is designed to identify reversals. To use the selective pin bar effectively, traders typically look for Strong Rejection: The tail of the pin bar should extend significantly beyond the surrounding price action. It indicates that there was a sharp rejection of higher or lower prices during the trading period. A strong rejection suggests that the market sentiment may be changing.
FREE
Free automatic Fibonacci is an indicator that automatically plots a Fibonacci retracement based on the number of bars you select on the BarsToScan setting in the indicator. The Fibonacci is automatically updated in real time as new highest and lowest values appears amongst the selected bars. You can select which level values to be displayed in the indicator settings. You can also select the color of the levels thus enabling the trader to be able to attach the indicator several times with differe
FREE
Ava Dragon Pro Signal
Nirundorn Promphao
1 (1)
The principle of this indicator is very simple: detecting the candlestick pattern in D1 timeframe, then monitoring the return point of graph by using the pullback of High-Low of D1 Candlestick and finally predicting BUY and SELL signal with arrows, alerts and notifications. The parameters are fixed and automatically calculated on each time frame. Example: If you install indicator on XAUUSD, timeframe D1: the indicator will detect the reversal, pullback, price action on this timeframe (for exam
FREE
Skdon2
Igor Bulyshev
Version améliorée d'un indicateur de tendance très connu, SkDon Trend Signal. Cet indicateur assistant montre la force et la direction du mouvement des prix. Il colore le graphique avec des barres colorées (histogrammes) : les barres bleues montent vers le haut, les rouges vers le bas. Barre bleue - sentiment haussier (le prix peut monter). Barre rouge - sentiment baissier (le prix peut descendre). Plus la barre est haute, plus le signal est fort. Si les barres sont basses ou presque inexistante
FREE
.....................................hi....................... ................for showing high s and low s and support and resistanses .....................we have a lot of ways............................... it can be helpful for finding trends , higher highs , higher lows , lower highs , lower lows .......................today i write on of thems.......................... ........................you can enter the number of last support and resistanses .........................and it will dra
FREE
Pivot Points Classic and Camarilla trace les niveaux pivots Classic (P, R1-R3, S1-S3) et les niveaux Camarilla (H1-H4, L1-L4) directement sur le graphique. Les niveaux sont calculés à partir du High, du Low et du Close de la période précédente de l'unité de temps choisie (D1 par défaut), et chaque période est tracée comme une ligne horizontale sur la période à laquelle elle s'applique, ce qui permet de voir comment le prix a réagi aux niveaux les jours, semaines ou mois précédents. Fonctionnalit
FREE
Liquidity Grab X — Liquidity Sweep & Grab Detector (MT4 & MT5) Liquidity Grab X automatically detects buyside and sellside liquidity sweeps (stop-hunts) at swing pivots and classifies each grab by strength — helping you spot exhaustion moves and potential reversal zones in real time, with instant push notifications to your phone. Full Description Liquidity Grab X is a free rule-based indicator for MetaTrader 4 and MetaTrader 5 that identifies liquidity grabs — moments where price sweeps above a
FREE
MASi Three Screens
Aleksey Terentev
5 (2)
MASi Three Screens is based on the trading strategy by Dr. Alexander Elder. This indicator is a collection of algorithms. Algorithms are based on the analysis of charts of several timeframes. You can apply any of the provided algorithms. List of versions of algorithms:     ThreeScreens v1.0 - A simple implementation, with analysis of the MACD line;     ThreeScreens v1.1 - A simple implementation, with analysis of the MACD histogram;     ThreeScreens v1.2 - Combines the first two algorithms in
FREE
Chart Symbol Changer for MT4
Juvenille Emperor Limited
5 (9)
Chart Symbol Changer pour MT4 est un indicateur/utilitaire qui vous offre la possibilité de changer le symbole graphique actuel qui est attaché en cliquant sur un bouton de symbole sur son panneau. Chart Symbol Changer pour MT4 vous donne la possibilité de configurer les 32 boutons de symboles selon vos préférences personnelles, en ajoutant les paires que vous souhaitez surveiller et échanger le plus. De cette façon, vous ne manquerez jamais une opportunité, car vous pouvez avoir une vue plus r
FREE
Colored Candle Time
Saeed Hatam Mahmoudi
Candle Time (MT4) The Candle Time indicator shows the remaining time for the current candle on the active chart timeframe. It adapts automatically to the chart period and updates on every tick. This is a charting utility; it does not provide trading signals and does not guarantee any profit. Main functions Display the time remaining for the current candle on any timeframe (M1 to MN). Color-coded state: green when price is above the open (up), gray when unchanged, and red when below the open (do
FREE
Trendline indicator
David Muriithi
2 (1)
Are you tired of drawing trendlines every time you're analyzing charts? Or perhaps you would like more consistency in your technical analysis. Then this is for you. This indicator will draw trend lines automatically when dropped on a chart. How it works Works similar to standard deviation channel found on mt4 and mt5. It has 2 parameters: 1. Starting Bar 2. Number of bars for calculation The   starting bar   is the bar which drawing of the trend lines will begin, while the   number of bars for c
FREE
Order blocks from any timeframe, with alerts - and a table that tells you honestly whether they work on your chart. ICT Order Blocks Honest Stats draws order blocks from this or a higher timeframe, marks each one fresh, tested or broken, alerts you when price comes back to a fresh block, and measures on your chart's own history how often the blocks held next to fake zones of the same size. Free, part of the Honest Stats series. Market Structure MT4 (free) | MT5 version (free) | Free: FVG Honest
FREE
MQLTA Support Resistance Lines
MQL4 Trading Automation
4.33 (12)
MQLTA Support Resistance Lines is an indicator that calculates the historical levels of Support and Resistance and display them as Lines on chart. It will also Alert you if the price is in a Safe or Dangerous zone to trade and show you the distance to the next level. The indicator is ideal to be used in other Expert Advisor through the iCustom function. This indicator can be tested LIVE on AUDNZD with the following DEMO https://www.mql5.com/en/market/product/26572 How does it work? The indicato
FREE
SR indicator
Alexander Chertnik
5 (3)
SR is a support and resistance indicator, it shows major highs and lows by different colors. The color of a level is changing if the last high or low are touching it. After the closing of a bar above or below level, it will delete it. extern inputs: loop for candles / colors / drawing time *This indicator signal is not perfect and have to be used with other market analysis and confirmations.
FREE
UPD1 Volume Footer
Vitaliy Kuznetsov
4.85 (13)
L'indicateur indique le volume vertical. Dans les paramètres, il y a 2 coefficients pour déterminer le haut et l'extrême, et 1 pour déterminer le faible volume. Un algorithme similaire est également utilisé dans l'indicateur UDP1 Volume Pixel . Lorsque le volume spécifié est détecté, l'histogramme est coloré dans la couleur correspondante. La largeur de l'histogramme est automatiquement sélectionnée, en fonction de l'échelle. En règle générale, le prix répond au volume maximum et minimum. Mais
FREE
Les acheteurs de ce produit ont également acheté
Currency Strength Wizard est un indicateur très puissant qui vous offre une solution tout-en-un pour un trading réussi. L'indicateur calcule la puissance de telle ou telle paire de devises en utilisant les données de toutes les devises sur plusieurs périodes. Ces données sont représentées sous la forme d'un indice de devise facile à utiliser et de lignes électriques de devise que vous pouvez utiliser pour voir la puissance de telle ou telle devise. Tout ce dont vous avez besoin est d'attacher l'
Trend SniperX MT4
Sarvarbek Abduvoxobov
5 (6)
Trend Sniper X est un indicateur de suivi de tendance multi-temporalité pour MetaTrader 5 qui aide les traders à identifier la direction de la tendance et les points de retournement potentiels avec clarté et précision. Pour MT5 : https://www.mql5.com/en/market/product/181101 Information sur le prix : Le prix actuel est une offre promotionnelle et peut évoluer au fur et à mesure de la sortie des prochaines mises à jour et nouvelles fonctionnalités. Canal Code2Profit Maîtrisez le marché grâce à l'
Scalper Vault
Oleg Rodin
4.9 (41)
Scalper Vault est un système de trading puissant et complet, conçu pour les traders en quête de régularité dans le cadre du trading intrajournalier. Cet indicateur de haute précision constitue un système de trading autonome et exhaustif, offrant des analyses de qualité institutionnelle, aussi bien pour le Forex que pour les options binaires. VEUILLEZ ME CONTACTER APRÈS VOTRE ACHAT POUR OBTENIR MES CONSEILS DE TRADING AINSI QU'UN EXCELLENT BONUS ! En éliminant les incertitudes et les analyses ma
Smart Trend Trading System est un indicateur pour MetaTrader 4 qui réunit les informations de tendance, les signaux d’entrée et de sortie et les niveaux de prix sur un même graphique. Il combine plus de 10 outils de trading en un seul système, incluant la détection de tendance, les zones de retournement, Smart Cloud, la logique de trailing stop, le support et la résistance, la coloration des bougies, les alertes et l’analyse multi-timeframe. Le système est conçu pour vous aider à trader différen
SIO Oscillator : oscillateur auto-optimisé de déséquilibre de semi-variance Achetez l’indicateur et recevez GRATUITEMENT l’Expert Advisor (EA) basé sur celui-ci. La plupart des oscillateurs traitent tous les mouvements de prix de la même manière. SIO sépare la pression haussière de la pression baissière et mesure le déséquilibre entre les deux, montrant quel camp contrôle réellement le marché : les acheteurs ou les vendeurs. Lorsque le déséquilibre atteint un extrême, SIO génère un signal clair
Advanced Supply Demand
Bernhard Schweigert
4.91 (302)
Offre spéciale : 30 % de réduction La solution idéale pour les traders débutants comme experts ! Cet indicateur est un outil de trading unique, performant et abordable grâce à l’intégration de nombreuses fonctionnalités exclusives et d’une nouvelle formule. Cette mise à jour vous permet d’afficher des zones sur deux unités de temps. Vous pourrez ainsi visualiser non seulement une unité de temps supérieure, mais aussi l’unité de temps du graphique, ainsi que l’unité de temps supérieure : des z
M1 Sniper
Oleg Rodin
4.97 (30)
M1 SNIPER est un système d'indicateurs de trading facile à utiliser. Il s'agit d'un indicateur à flèche conçu pour l'unité de temps M1. Cet indicateur peut être utilisé seul pour le scalping sur l'unité de temps M1 ou intégré à votre système de trading existant. Bien que conçu spécifiquement pour le trading sur l'unité de temps M1, ce système peut également être utilisé avec d'autres unités de temps. Initialement, j'avais conçu cette méthode pour le trading du XAUUSD et du BTCUSD. Cependant, je
Non repaint MT4
Yan Zhen Du
5 (2)
This is a professional chart indicator designed for traders focused on stability and clear price action. It helps filter market noise and provides clear visual entry and exit zones for your trading decisions. Core Features: Strictly Non-Repainting: The system is built with strict non-repaint logic. What you see on the chart is the true historical performance. Confirmed Signals: Signals are triggered and confirmed only after the candle closes . Once a trading arrow appears on a closed candle, it
Gann Made Easy
Oleg Rodin
4.84 (174)
Gann Made Easy est un système de trading Forex professionnel et facile à utiliser qui est basé sur les meilleurs principes de trading en utilisant la théorie de mr. WD Gann. L'indicateur fournit des signaux d'ACHAT et de VENTE précis, y compris les niveaux Stop Loss et Take Profit. Vous pouvez échanger même en déplacement en utilisant les notifications PUSH. VEUILLEZ ME CONTACTER APRÈS L'ACHAT POUR RECEVOIR GRATUITEMENT DES INSTRUCTIONS DE TRADING ET D'EXCELLENTS INDICATEURS SUPPLÉMENTAIRES! Vou
Actuellement 30% de réduction ! La meilleure solution pour tout débutant ou trader expert ! Ce logiciel de tableau de bord fonctionne sur 28 paires de devises. Il est basé sur 2 de nos principaux indicateurs (Advanced Currency Strength 28 et Advanced Currency Impulse). Il donne un excellent aperçu de l'ensemble du marché Forex. Il montre les valeurs de l'Advanced Currency Strength, la vitesse de mouvement des devises et les signaux pour 28 paires de devises dans tous les (9) délais. Imaginez
Nous vous présentons ON Trade Waves Patterns Harmonic Elliot Wolfe, un indicateur avancé conçu pour détecter divers types de schémas sur le marché à l'aide de méthodes manuelles et automatiques. Voici comment il fonctionne : Schémas Harmoniques : Cet indicateur peut identifier les schémas harmoniques qui apparaissent sur votre graphique. Ces schémas sont essentiels pour les traders qui pratiquent la théorie du trading harmonique, telle qu'elle est décrite dans le livre de Scott Carney "Harmonic
Zoryk Gold mt4
Reda El Koutbane
5 (3)
ZORYK — Système avancé de signaux et de planification pour XAUUSD sur MetaTrader 4 Vous connaissez probablement cette situation. Vous analysez l’or, attendez l’entrée, puis ouvrez enfin la position. Le prix part immédiatement contre vous. Vous fermez trop tôt, déplacez le Stop Loss ou hésitez quelques secondes. Peu après, le marché atteint exactement la direction et l’objectif que vous aviez prévus, mais sans vous. Le problème n’était pas toujours la direction. Le véritable problème était l
RFI levels PRO
Roman Podpora
5 (2)
L'indicateur montre avec précision les points de retournement et les zones de retour des prix où le       Acteurs majeurs   . Vous repérez les nouvelles tendances et prenez des décisions avec une précision maximale, en gardant le contrôle de chaque transaction. VERSION MT5     -     Révèle son potentiel maximal lorsqu'il est combiné à l'indicateur   TREND LINES PRO Ce que l'indicateur montre : Structures et niveaux d'inversion avec activation au début d'une nouvelle tendance. Affichage des nive
Atomic Analyst
Issam Kassas
5 (14)
Atomic Analyst — MetaTrader 4 Pour toute question sur le produit, sa configuration ou le support technique, envoyez-moi un message directement ici sur MQL5. L’indicateur transforme des calculs complexes du marché en signaux visuels simples, bougies colorées, lectures de tendance, niveaux de stop-loss et plusieurs zones de take-profit que les traders peuvent comprendre rapidement et utiliser dans des conditions réelles de marché. Principales utilisations de trading : Scalping et trading intraday
ShapeRadar - indicateur de figures chartistes classiques ShapeRadar repère automatiquement sur le graphique les figures classiques de l’analyse technique : doubles et triples sommets et creux, tête et épaules et sa version inversée, biseaux ascendants et descendants, rectangles, triangles, drapeaux et fanions. Lorsque le prix clôture au-delà de la limite d’une figure, l’indicateur trace la figure, le point d’entrée, le niveau de stop loss et l’objectif, et un panneau d’information résume toutes
Liquidity Scalper System : un système de trading basé sur la liquidité au format indicateur. La plupart des indicateurs n'affichent qu'une flèche, puis le trader décide seul où placer le stop, où se trouve l'objectif et s'il peut faire confiance au signal. Liquidity Scalper System couvre tout le cycle du trade : il trouve les pools de liquidité, donne un signal lors de leur cassure, calcule immédiatement Entry, Stop Loss et trois objectifs, et affiche sur le panneau les statistiques et les résu
Le système PRO Renko est un système de trading très précis spécialement conçu pour le trading de graphiques RENKO. Il s'agit d'un système universel qui peut être appliqué à divers instruments de négociation. Le système neutralise efficacement ce qu'on appelle le bruit du marché en vous donnant accès à des signaux d'inversion précis. L'indicateur est très facile à utiliser et n'a qu'un seul paramètre responsable de la génération du signal. Vous pouvez facilement adapter l'outil à n'importe que
SR Liquidity
Oleg Rodin
5 (2)
SR Liquidity est un indicateur de trading conçu pour révéler les zones cachées où se concentre la liquidité du marché et où le prix réagit avec le plus d'intensité. Ces zones de liquidité spécifiques agissent comme de puissants niveaux de support et de résistance, vous offrant une cartographie claire des points où le marché est le plus susceptible de se retourner. Plutôt que de tracer des lignes de support et de résistance classiques, l'indicateur SR Liquidity analyse le comportement réel des pr
Auto Optimized SpeedAngle est un système de vectorisation du momentum de niveau institutionnel qui élimine l'ajustement de courbe ( curve-fitting ) grâce à une optimisation continue par avancement ( Walk-Forward Optimization , WFO). Plutôt que de s'appuyer sur des entrées statiques qui se dégradent lorsque les régimes de marché changent, l'indicateur recalibre dynamiquement ses paramètres en utilisant une validation hors échantillon ( Out-of-Sample , OOS), garantissant ainsi que les signaux affi
Italo Volume Indicator
Italo Santana Gomes
4.92 (79)
BUY INDICATOR AND GET EA FOR FREE AS A BONUS + SOME OTHER GIFTS! ITALO VOLUME INDICATOR  is the best volume indicator ever created, and why is that? The Indicator works on all time-frames and assets, indicator built after 7 years of experience on forex and many other markets. You know many volume indicators around the internet are not complete, does not help, and it's difficult to trade, but the Italo Volume Indicator is different , the Italo Volume Indicator shows the wave volume, when market
Il estime le mouvement de prix le plus probable à court terme à partir de calculs mathématiques avancés. Caractéristiques Estimation du mouvement immédiat du prix sur l'unité de temps du graphique et sur toutes les unités supérieures ; Calcul de la tendance réelle du marché ; Calcul des niveaux de support et de résistance les plus importants ; Alertes sur les zones de congestion, les croisements de niveaux et les changements de tendance ; Léger pour les ressources du système : les lignes et le
Route Lines Prices
Vitalyi Belyh
3 (1)
Route Lines Prices - est un indicateur conçu pour identifier les directions des prix. Son interface simple intègre plusieurs algorithmes de calcul du comportement des prix et de leur direction future. Ces algorithmes incluent le calcul de la volatilité et le lissage des prix en fonction des unités de temps utilisées. L'indicateur possède un unique paramètre permettant de modifier la valeur « Calculating price values ». La valeur par défaut de 1 assure un calcul automatique équilibré, utilisabl
CRT Candle Range Theory HTF MT4 - Ultimate CRT Indicator : Concepts ICT avancés et système de trading Malaysian SnR Maîtrisez les traces des Market Makers avec l'indicateur Candle Range Theory le plus avancé. Libérez la véritable puissance des Smart Money Concepts (SMC) et tradez avec la même précision que les institutions grâce à l'Ultimate CRT Indicator. Conçu exclusivement pour les traders sérieux, cet indicateur automatiza la théorie CRT, un pilier central des concepts ICT (Inner Circle Trad
All in One package includes the  Oscillator Predictor ,  MACD Predictor ,  Thrust Scanner  and  Advanced Fibonacci  indicators which are mandatory for applying  Dinapoli  trade plans.  Please visit below links for detailed explanations of indicators. Advanced Fibonacci Indicator =>  https://www.mql5.com/en/market/product/52834 Thrust Scanner Indicator => https://www.mql5.com/en/market/product/52830 Overbought /Oversold Predictor indicator => https://www.mql5.com/en/market/product/52621 Macd P
Imbalance Pro
Ivan Stefanov
5 (4)
L'indicateur mesure le déséquilibre entre les haussiers et les baissiers sur une période donnée et affiche une ligne droite entre les deux points. Si les haussiers ont plus de volume que les baissiers, la ligne devient verte.  Si les baissiers ont plus de volume, elle est rouge. La ligne indique également le pourcentage de différence de volume. L'indicateur affiche les mêmes données dans une fenêtre séparée. Vous pouvez également voir le volume divisé. L'indicateur a deux modes. À cet effe
AW Prime Oscillator
AW Trading Software Limited
5 (1)
Une combinaison de deux oscillateurs. Le premier affiche les points d'entrée, le second montre la tendance actuelle. L'indicateur peut afficher les signaux d'oscillateur par des flèches dans deux modes, tous les signaux d'oscillateur rapides ou les signaux uniquement dans la direction de la tendance actuelle. Il dispose d'un panneau multi-périodes et de trois types de notifications de signal. Avantages: Convient au day trading et au scalping Filtrage des tendances Configuration simple et sensibl
True Direction Oscillator
Muhammad Elbermawi
4.85 (364)
Ou (TDO) qui est un indice qui mesure le taux de variation des prix en utilisant le principe du « Pure Momentum ». Lorsque le prix d'un titre augmente de 10 à 15, le taux de variation du prix est de 150 %, mais lorsqu'il redescend de 15 à 10, le taux de variation du prix n'est que de 33,3 %. C'est pourquoi les indicateurs d'analyse technique tels que « Taux de variation des prix » (ROC) ou « Momentum » donnent des lectures plus élevées pour les mouvements de prix ascendants que ceux donnés aux m
Indicateur de trading manuel et d'analyse technique pour le Forex. Il se compose d'un indicateur de tendance avec le niveau d'ouverture du jour de bourse et d'un indicateur de flèche pour déterminer les points d'entrée. L'indicateur ne se recolore pas ; il fonctionne lorsque la bougie se ferme. Contient plusieurs types d'alertes pour les flèches de signalisation. Peut être configuré pour fonctionner sur n’importe quel graphique, instrument de trading ou période. La stratégie de travail est bas
Dark Support Resistance  is an Indicator for intraday trading. This Indicator is programmed to identify  Support and Resistance Lines , providing a high level of accuracy and reliability. Key benefits Easily visible lines Only the most important levels will be displayed Automated adjustment for each timeframe and instrument Easy to use even for beginners Never repaints, never backpaints, Not Lag 100% compatible with Expert Advisor development All types of alerts available: Pop-up, Email, Push
Volume Profile : multimode, multiprofil, dessiné sur le graphique de prix L'indicateur dessine un profil de volume directement sur le graphique de prix, avec la ligne Point of Control (POC), la Value Area (VAH et VAL) et des pics et creux optionnels. Au lieu de lire le volume dans un panneau inférieur séparé, le volume est affiché aux niveaux de prix où il a été échangé, de sorte que le prix et le volume peuvent être lus au même endroit. Ce que l'indicateur affiche Ligne POC (Point of Control) :
Plus de l'auteur
Stop-loss and take-profit levels sized from the expected daily range, with the lot that risks exactly your chosen % of balance. A stop that is too tight gets hit by normal noise; a stop that is too wide makes the lot tiny. Ballast Stop Sizer sizes the stop from how much the market is expected to move today. Expected daily range — from the average range of the last 5 and the last 20 trading days (weekend bars are ignored). Shown with how much of it today has already used. Buy and sell stop-loss a
FREE
Direct translation of blackcat's L3 Banker Fund Flow Trend Oscillator. Get push notifications on your phone app when a signal bar has formed. Historical signals are shown with buy/sell arrow right on the main chart. Indicator uses two data calculations to check for a cross below 25% level (a signal to go long) and above 75% level (a signal to short). For any further questions  feel free to contact me directly. Including requests for product improvements.
Two lines are being drawn in a separate window. And both are representing an angle of a trendline. One trendline is measured going across two price highs, but the other is measured across two lows. You get to choose the period from which the first price high and first price low is being determined. The second high and low comes from identical time period preceding the first one. Feel free to experiment with the period count until you get the confirmation you are looking for.
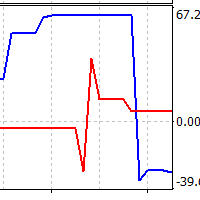
Line1: simple calculation of change in closing price for the chosen input period - named Velocity. Line2: simple calculation of change in velocity for the chosen input period - named Acceleration. Feel free to play with the input periods to find a profitable combination. For faster results it is best to do it in MT Optimizer. Can assist in either manual or automatic trading.
This is an Expert that gives you a control panel with two buttons - 'Hide Stops' and 'Show Stops'. With a click of a button you can hide your stoploss and takeprofit levels from your broker and restore them if necessary. When levels are hidden Expert tracks orders in the background and closes them as soon as the price exceeds hidden levels. It is not opening new orders just working with existing ones, only stoploss and takeprofit levels are not visible to the market. Choose zero as magic number
Keeps your prop-firm challenge inside its rules: fits every stop to the loss you have left, closes and locks before the daily or total limit, locks a reached profit target. A prop-firm challenge is usually lost to one rule: the maximum daily loss or the maximum total loss. Ballast Prop Guard watches the whole account — manual trades and every EA — and makes those limits very hard to break. What it does Fitted stops — every open trade gets a stop-loss so that, even if price jumps straight to all
One-click trading that sizes every lot from your risk %, adds a stop-loss to any trade without one, and locks trading after your daily loss limit. Most accounts are not lost by a bad strategy. They are lost by one trade without a stop, one oversized lot, or one bad day that turns into revenge trading. Ballast Risk Panel stops all three. 1. Buy / Sell with the right lot size Press BUY or SELL. Ballast Risk Panel calculates the lot so that the stop-loss loses exactly your chosen % of balance (defa
Manages your open trades for you: break-even, partial profit, ATR trailing stop and time exit — measured in R, never loosening a stop. Opening a trade is the easy part. Ballast Exit Manager handles the rest, the same way every time, for manual trades and trades from other EAs. Everything is measured in R = the trade's initial risk (the distance from entry to the first stop-loss). A trade at +1R has made as much as it risked. Break-even — at +1R (default) the stop moves to the entry price plus a
Closes all your trades together when their combined profit or loss reaches your target — in money or % of balance — with an optional trailing profit lock. Many trades open at once — from you, from several EAs, or a grid/basket strategy. Ballast Equity Target watches their combined result and closes them all together: Profit target in money and/or % of balance (the first one reached wins). Loss limit in money and/or % of balance. Trailing profit lock — once the basket is up X%, it may give back a
Hidden stop-loss and take-profit: your levels stay in the EA, not at the broker. Drag the lines to move them; a wider emergency stop stays as insurance. Ballast Stealth Stops keeps your stop-loss and take-profit inside the EA. When price reaches a level, the trade is closed at market. The broker sees only a much wider emergency stop (or nothing, if you choose). Takes over existing broker stops/targets, or sets hidden levels (fixed points or ATR multiple, target as a multiple of the stop). Drag t
One-cancels-other for MT4: when one pending order fills, the others are deleted at once. One-click straddle with stop, target, expiry and a risk-based lot. MetaTrader 4 has no built-in OCO. Place a buy stop above and a sell stop below before the news, one of them fills, and the other one is still waiting to open a second trade against you. Ballast OCO Orders deletes it for you. What it does OCO for any pending orders — buy/sell stop, buy/sell limit. Placed by hand, from the one-click button, or
One line at the price where all your open trades on the symbol together are at zero — swaps and commission included — plus lines for your basket profit target and loss limit. Three buys at different prices, one sell, a few EAs on the same chart: where is the price at which all of it together is back at zero? MT4 does not show it. Ballast Break Even draws that price as one line and keeps it up to date on every tick. What it shows Break-even line — the Bid price at which all open trades on the sym
Asia, London and New York session boxes, with statistics from the symbol's own history: average ranges, how often London breaks the Asian range, when the day's high and low form. Session boxes show where each session traded. Ballast Session Ranges also tells you what usually happens next on the symbol you are looking at, measured on its own history. On the chart Boxes for the Asian, London and New York sessions, with the range of each session in points. Session hours are inputs (server time), in
Shows what your open trades really add up to: net long/short per currency, index and metal exposure, and the money lost if every stop is hit. Buy EURUSD, buy EURJPY, buy USDJPY — three different trades? Not really: you are long EUR twice and short JPY twice. Ballast Exposure Meter adds up every open trade on the account and shows the real picture. Net exposure per currency — long or short, the amount in that currency and its value in your account currency, largest first. Indices, metals, stocks,
Your account on your phone: push notifications for equity drops, low margin, trades without a stop, AutoTrading switched off, lost connection, every trade and a daily summary. Running EAs on a VPS, or leaving a manual trade open while you are away? Ballast Account Alerts watches the whole account and tells your phone (MetaTrader mobile app push), the terminal (alert) or your e-mail. Alarms Equity down X% since the start of the day (default 5%), or below a fixed amount. Margin level below X% (def
Shows where your account loses money: trades without a stop-loss, worst symbols, weekdays, hours and holding times. Drop Ballast Loss Finder on any chart. In a second it reads your closed trades and tells you in plain words where the money goes: Total result, win rate, and how much of all your losses came from trades without a stop-loss . How much of your losses came from your 5 worst trades, and your longest losing streak. Biggest leaks: the worst symbol, direction, weekday, hour and holding ti
FREE
Averaging grid with a worst case you know before you start: a real broker stop on every trade, lots sized so all levels filled plus the stop = your chosen % of balance. Averaging grids win often and lose rarely, but when they lose, many accounts are gone. The cause is almost always the same: no stop, and lots that grow until the margin runs out. Ballast Grid Manager keeps the useful part of a grid and removes the unlimited part. How it works You decide the direction: click Start BUY grid or Star
L3 Banker Fund Flow Trend Oscillator v5 is a simple translation of blackcat's work from pine script (language used by TradingView platform) to mql5. It generates buy and sell signals when two calculated buffers cross over each other in the oversold and overbought oscillator territory. Current version does not offer any changable inputs, but could be easily added in the modified version if requested.
Keeps your prop-firm challenge inside its rules: fits every stop to the loss you have left, closes and locks before the daily or total limit, locks a reached profit target. A prop-firm challenge is usually lost to one rule: the maximum daily loss or the maximum total loss. Ballast Prop Guard watches the whole account — manual trades and every EA — and makes those limits very hard to break. What it does Fitted stops — every open position gets a stop-loss so that, even if price jumps straight to a
One-click trading that sizes every lot from your risk %, adds a stop-loss to any trade without one, and locks trading after your daily loss limit. Most accounts are not lost by a bad strategy. They are lost by one trade without a stop, one oversized lot, or one bad day that turns into revenge trading. Ballast Risk Panel stops all three. 1. Buy / Sell with the right lot size Press BUY or SELL. Ballast Risk Panel calculates the lot so that the stop-loss loses exactly your chosen % of balance (defa
Manages your open trades for you: break-even, partial profit, ATR trailing stop and time exit — measured in R, never loosening a stop. Opening a trade is the easy part. Ballast Exit Manager handles the rest, the same way every time, for manual trades and trades from other EAs. Everything is measured in R = the trade's initial risk (the distance from entry to the first stop-loss). A trade at +1R has made as much as it risked. Break-even — at +1R (default) the stop moves to the entry price plus a
Closes positions and blocks trading around important news, using MT5's built-in economic calendar. Protects manual trades and other EAs. Big news (interest rates, jobs reports, inflation) can move price more in one minute than in the whole day before it, with wide spreads and slippage. Many prop firms forbid holding trades through it. Ballast News Shield handles it for you. Reads the built-in MT5 economic calendar — no DLL, no web requests, no settings to allow URLs. A set number of minutes befo
Shows where your account loses money: trades without a stop-loss, worst symbols, weekdays, hours and holding times. Drop Ballast Loss Finder on any chart. In a second it reads your closed trades and tells you in plain words where the money goes: Total result, win rate, and how much of all your losses came from trades without a stop-loss . How much of your losses came from your 5 worst trades, and your longest losing streak. Biggest leaks: the worst symbol, direction, weekday, hour and holding ti
FREE
Closes all your positions together when their combined profit or loss reaches your target — in money or % of balance — with an optional trailing profit lock. Many trades open at once — from you, from several EAs, or a grid/basket strategy. Ballast Equity Target watches their combined result and closes them all together: Profit target in money and/or % of balance (the first one reached wins). Loss limit in money and/or % of balance. Trailing profit lock — once the basket is up X%, it may give bac
Hidden stop-loss and take-profit: your levels stay in the EA, not at the broker. Drag the lines to move them; a wider emergency stop stays as insurance. Ballast Stealth Stops keeps your stop-loss and take-profit inside the EA. When price reaches a level, the position is closed at market. The broker sees only a much wider emergency stop (or nothing, if you choose). Takes over existing broker stops/targets, or sets hidden levels (fixed points or ATR multiple, target as a multiple of the stop). Dra
Your account on your phone: push notifications for equity drops, low margin, trades without a stop, Algo Trading switched off, lost connection, every trade and a daily summary. Running EAs on a VPS, or leaving a manual trade open while you are away? Ballast Account Alerts watches the whole account and tells your phone (MT5 mobile app push), the terminal (alert) or your e-mail. Alarms Equity down X% since the start of the day (default 5%), or below a fixed amount. Margin level below X% (default 2
Shows what your open trades really add up to: net long/short per currency, index and metal exposure, and the money lost if every stop is hit. Buy EURUSD, buy EURJPY, buy USDJPY — three different trades? Not really: you are long EUR twice and short JPY twice. Ballast Exposure Meter adds up every open position on the account and shows the real picture. Net exposure per currency — long or short, the amount in that currency and its value in your account currency, largest first. Indices, metals, stoc
One line at the price where all your open trades on the symbol together are at zero — swaps and commission included — plus lines for your basket profit target and loss limit. Three buys at different prices, one sell, a few EAs on the same chart: where is the price at which all of it together is back at zero? MT5 does not show it. Ballast Break Even draws that price as one line and keeps it up to date on every tick. What it shows Break-even line — the Bid price at which all open positions on the
Asia, London and New York session boxes, with statistics from the symbol's own history: average ranges, how often London breaks the Asian range, when the day's high and low form. Session boxes show where each session traded. Ballast Session Ranges also tells you what usually happens next on the symbol you are looking at, measured on its own history. On the chart Boxes for the Asian, London and New York sessions, with the range of each session in points. Session hours are inputs (server time), in
One-cancels-other for MT5: when one pending order fills, the others are deleted at once. One-click straddle with stop, target, expiry and a risk-based lot. MetaTrader 5 has no built-in OCO. Place a buy stop above and a sell stop below before the news, one of them fills, and the other one is still waiting to open a second trade against you. Ballast OCO Orders deletes it for you. What it does OCO for any pending orders — buy/sell stop, buy/sell limit, stop-limit. Placed by hand, from the one-click
Filtrer:
Aucun avis
Répondre à l'avis