Artis Bergs / Seller
Published products

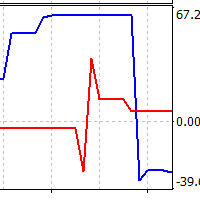
Two lines are being drawn in a separate window. And both are representing an angle of a trendline. One trendline is measured going across two price highs, but the other is measured across two lows. You get to choose the period from which the first price high and first price low is being determined. The second high and low comes from identical time period preceding the first one. Feel free to experiment with the period count until you get the confirmation you are looking for.

Direct translation of blackcat's L3 Banker Fund Flow Trend Oscillator. Get push notifications on your phone app when a signal bar has formed. Historical signals are shown with a red checkmark right on the main chart. Indicators uses two data calculations to check for a positive cross below 25% level. Long signals only! For any further questions feel free to contact me directly. Including requests for product improvements.