RFX5 Forex Strength Meter
- Indicators
- Version: 1.20
- Updated: 11 April 2023
- Activations: 5

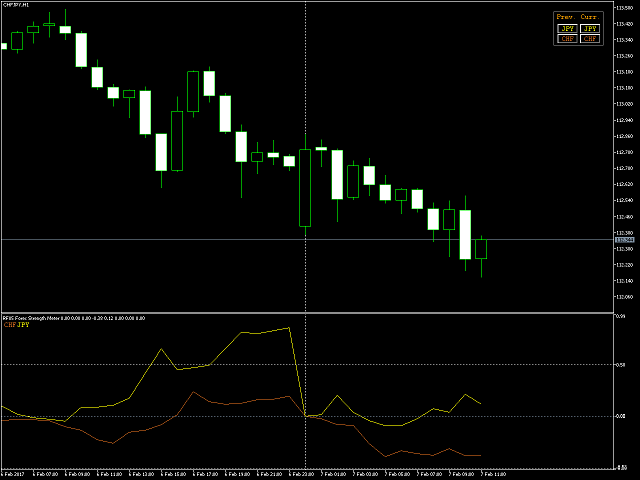
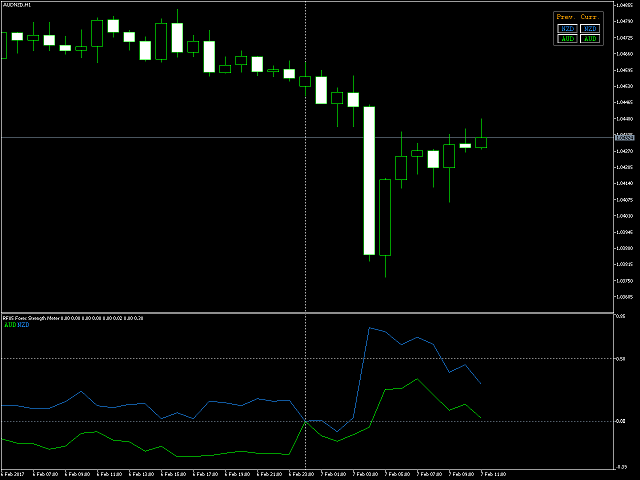
RFX Forex Strength Meter is a powerful tool to trade 8 major currencies in the Forex market,
- U.S. Dollar (USD)
- European Euro (EUR)
- British Pound (GBP)
- Swiss Franc (CHF)
- Japanese Yen (JPY)
- Australian Dollar (AUD)
- Canadian Dollar (CAD)
- New Zealand Dollar (NZD)
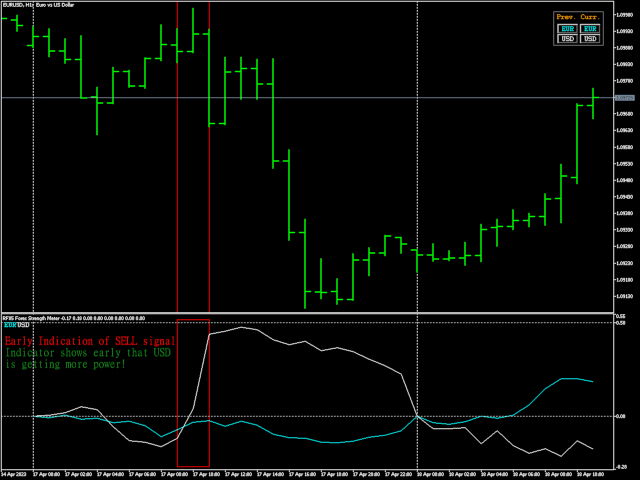
The indicator calculates the strength of each major currency using a unique and accurate formula starting at the beginning of each trading day of your broker. Any trading strategy in the Forex market can be greatly improved by observing the strength of the major currencies. The traders can observe deviation between two currency and take advantage of the momentum in the market.
Important Notes:
- The indicator only works on brokers who provide all the 28 major currency pairs of Forex, which are
- EURUSD, GBPUSD , USDCHF, USDJPY, EURGBP, EURCHF, EURJPY, GBPCHF, GBPJPY, CHFJPY, USDCAD, EURCAD, GBPCAD, CADCHF, CADJPY, AUDCAD, AUDUSD, EURAUD, GBPAUD, AUDCHF, AUDJPY, EURNZD, NZDUSD, GBPNZD, NZDCHF, NZDJPY, AUDNZD, NZDCAD
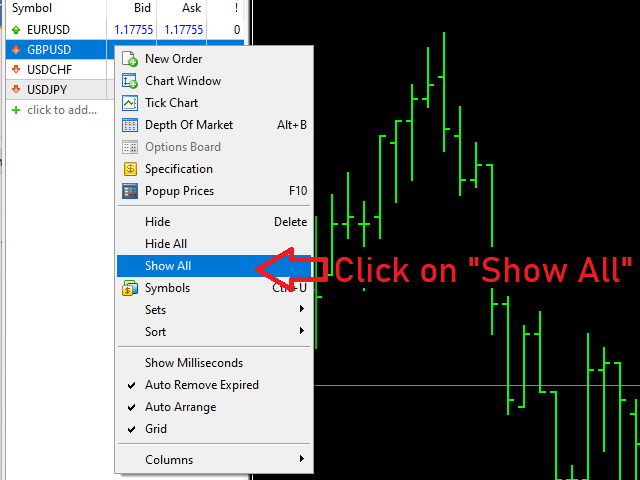
- In order to let the indicator calculate strength values over the past bars, the indicator needs the history of all the 28 major pairs available.
- Do NOT forget to enable "Show All" option by right click on Market Watch window (see below image).
Input Parameters
- Maximum Look Back Days: A positive integer number that indicates the maximum past days over which the past currency strength will be shown.
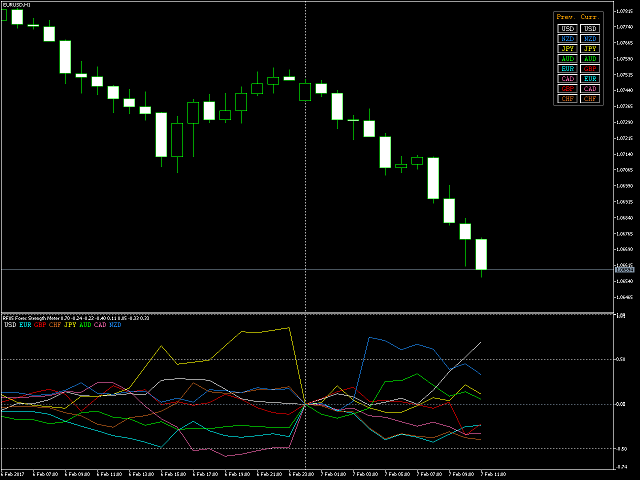
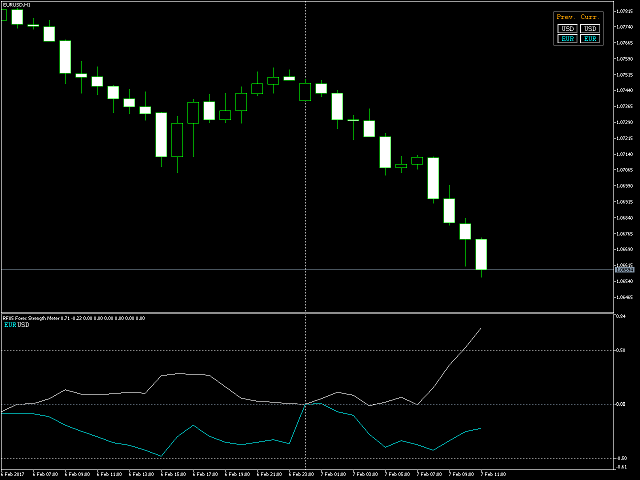
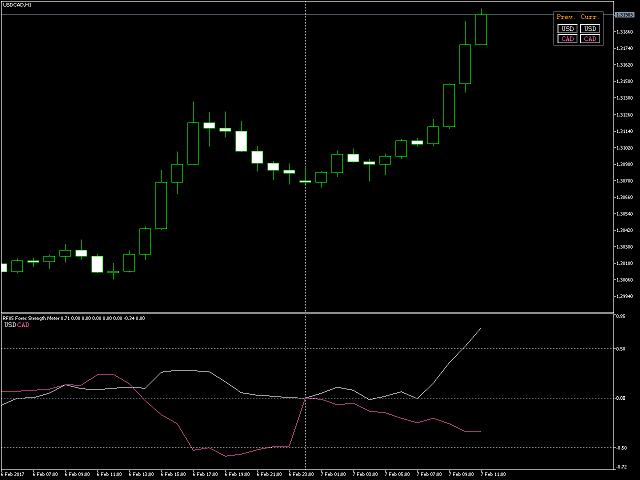
- Only Show Chart's Currencies: If this option is set to Yes, the indicator only shows the strength of the currencies that the indicator is attached to. For example, if you attach the indicator to an EURUSD chart, the indicator only shows the strength of EUR and USD. If this option is set to No, the indicator shows all the strength of all the currencies which are enabled below.
- Show Panel?: If this option is set to Yes, and above option is set to No, a small panel showing the previous and current bars strength will be shown on the top right of the chart.
- Send Alert at Power Change?: If this option is set to Yes and the panel is enabled, the indicator generates alerts when the most the place of the strongest/weakest currency on the current column changes where you have an opportunity to trade the corresponding pair.
- Show USD: If this option is set to Yes, the indicator will show the strength of USD.
- Show EUR: If this option is set to Yes, the indicator will show the strength of EUR.
- Show GBP: If this option is set to Yes, the indicator will show the strength of GBP.
- Show CHF: If this option is set to Yes, the indicator will show the strength of CHF.
- Show JPY: If this option is set to Yes, the indicator will show the strength of JPY.
- Show AUD: If this option is set to Yes, the indicator will show the strength of AUD.
- Show CAD: If this option is set to Yes, the indicator will show the strength of CAD.
- Show NZD: If this option is set to Yes, the indicator will show the strength of NZD.
- USD Color: The color of USD strength line.
- EUR Color: The color of EUR strength line.
- GBP Color: The color of GBP strength line.
- CHF Color: The color of CHF strength line.
- JPY Color: The color of JPY strength line.
- AUD Color: The color of AUD strength line.
- CAD Color: The color of CAD strength line.
- NZD Color: The color of NZD strength line.

Great indicator. Would not trade without it! Cannot underestimate the importance of knowing strong and weak currencies when trading