Bat Patterns

Bat Patterns (Harmonic Scanner)

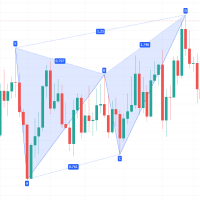
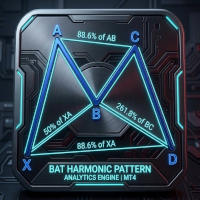
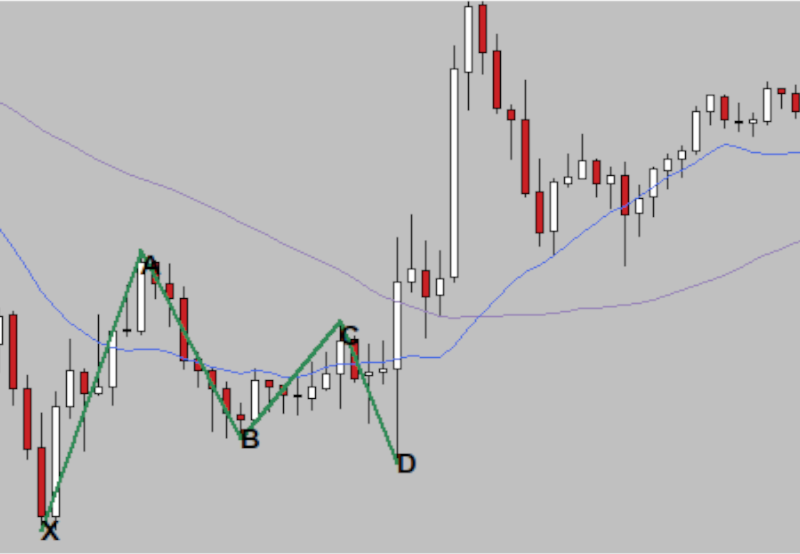
Bat Patterns is an institutional-grade technical overlay engineered to automatically map complex harmonic price structures and swing imbalances across active execution cycles. By processing market geometry dynamically through strict multi-timeframe swing filters, this utility completely eliminates manual calculation errors and gives traders an instant visual panel of high-probability reversal zones on a single chart window.

Utilizing specialized single-pass pattern recognition logic, this indicator tracks structural pivot points relative to custom history depth windows. It transforms complex Fibonacci weighting metrics into clean visual states, helping traders spot precise institutional entry and risk parameters long before standard indicators react.

Core Technical Features

- Dual-Engine Pattern Recognition: Automatically identifies and processes both Bullish and Bearish institutional Bat structures.
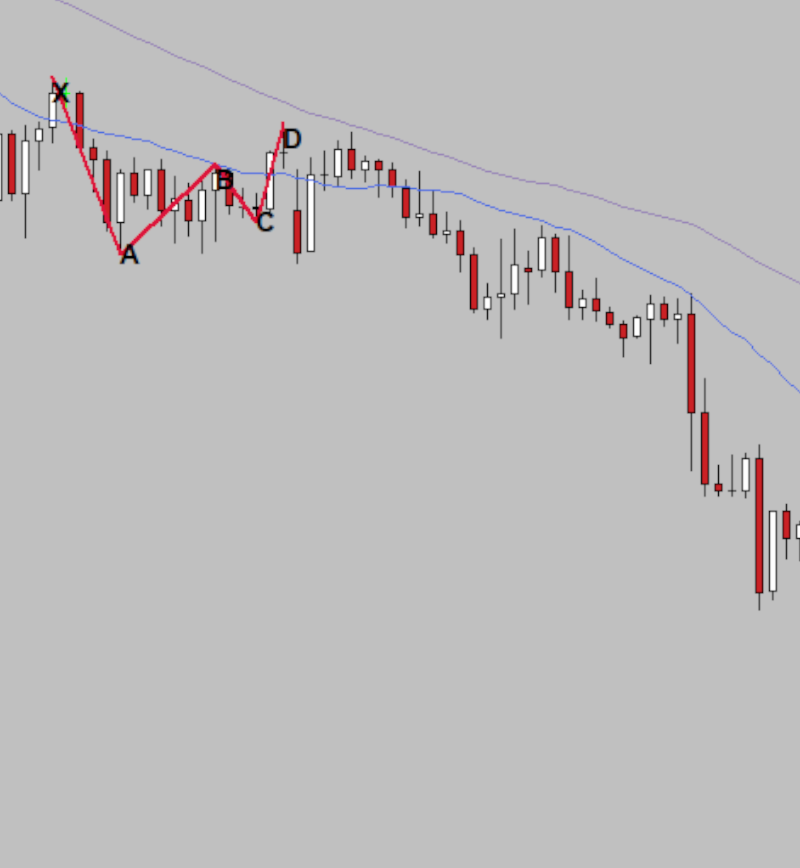
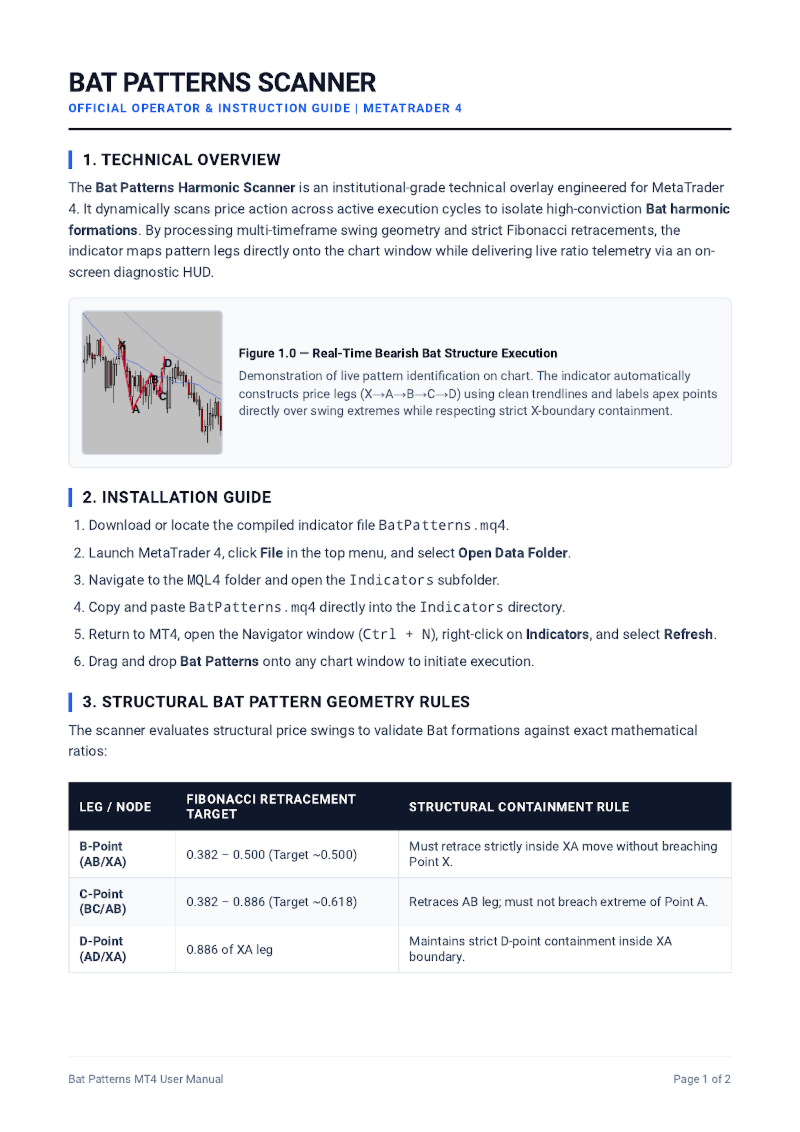
- Strict Harmonic Tolerance Band: Utilizes precision Fibonacci ratio verification (B point retrace 0.382-0.50, C point retrace 0.382-0.886, and D point completion ~0.886 of XA) to filter out false formations and isolate high-conviction setups.
- Intuitive Color-Coded State Machine: Instantly adapts indicator rendering and trendline legs to contrast flawlessly with the main chart workspace using customizable input colors (SeaGreen for Bullish, Crimson for Bearish).
- Actionable Value Panel Output: Translates active pattern ratios into explicit metric readouts configured down to the fractional decimal.
- Institutional Solid Workspace Panel: Includes dynamic object mapping that outlines structural legs and apex labels cleanly on a sleek, modern layout.
- Zero Terminal Lag / High Performance Architecture: Engineered with an optimized single-pass loop execution that runs smoothly, completely avoiding terminal lag during high-frequency execution.

Interactive Status & Interpretation Logic

The indicator tracks real-time data calculations and formats the active pattern readout based on asset decimal precision automatically:

- Dynamic Geometric Plotting: Draws chronological trendline legs directly across asset swings to serve as exact mean-reversion and reversal zones.
- Labeled Apex Matrix: Formats and displays structural coordinate strings (X, A, B, C, D) explicitly across pivot points utilizing clean typography standards.
- Clean Object Management: Employs automated clean-up logic that removes outdated graphical objects seamlessly when scanning new historical data.

Adjustable Input Parameters

Tailor the calculation matrix completely to your personalized risk strategy directly through the input dashboard:

- MinPipMove (Default: 10.0): Adjusts the minimum swing size filter in pips to screen out market noise.
- BarsToScan (Default: 1500): Modifies the history depth scanner window for performance tuning.
- BullishColor (Default: SeaGreen): Customizes the line color for bullish Bat formations.
- BearishColor (Default: Crimson): Customizes the line color for bearish Bat formations.

Recommended products
Gartley Patterns
Jeffrey Lloyd Lauzon
Gartley Patterns (Harmonic Scanner) Gartley Patterns is an institutional-grade technical overlay engineered to automatically map complex harmonic price structures and swing imbalances across active execution cycles. By processing market geometry dynamically through strict multi-timeframe swing filters, this utility completely eliminates manual calculation errors and gives traders an instant visual panel of high-probability reversal zones on a single chart window. Utilizing specialized sing
FREE
Adaptive Volume Profile draws the Volume Profile of the latest bars directly on the chart: the Point of Control (POC), the Value Area (VAH / VAL), high-volume nodes (HVN), low-volume nodes (LVN) and an optional volume histogram. The size of the price rows adapts to the current volatility (ATR), so the profile stays readable on any symbol and timeframe. Features POC - the price level with the largest traded volume in the window Value Area (VAH / VAL) - the price range that contains the chosen sha
FREE
This indicator filters the Zigzag indicator to calculate the main support and resistance levels. Variables minimum gap between peaks : is the distance (GAP) between the peaks of the Zigzag peaks sensitivity : Minimum number of nearby peaks look back: it means that it has to test the last 50 peaks in the Zigzag object name perfix: a prefix for level’s line name on chart
FREE
Multi Spread Hunter Info
Alessandro Michele Ventrella
Scanner a diffusione Spread Scanner è uno strumento di monitoraggio multi-simbolo elegante, professionale e ad alte prestazioni, progettato per MetaTrader 4 (MT4). Consente ai trader di tracciare e confrontare in tempo reale gli spread su 10 strumenti di trading personalizzabili simultaneamente, direttamente da un'interfaccia HUD intuitiva sul grafico. Che si tratti di operare sulle principali coppie di valute Forex, sui metalli preziosi o sugli indici, sapere dove le condizioni di esecuzione so
FREE
After purchasing the Tpx Dash Supply Demand indicator, you must download this indicator which will link and feed market data to the Tpx Dash Supply Demand indicator and will provide all Supply Demand price signals, ATR Stop, VAH and VAL, trend values ​​with the ADX, and POC prices and locations in the market. Just download it and Dash will locate the indicator to retrieve the information!
FREE
External Bar
Georgi Gaydarov
Simple indicator that shows external ( outside ) bars. In certain cases, external bars can be seen as strong trend bars instead of range bars. This can be observed when a with-trend external bar occurs at a reversal from a strong trend. It will help you notice more easily different patterns like - Inside-outside-inside, Inside- Inside -inside, outside - Inside -outside, etc. Works perfectly with my other free indicators Internal bar and Shadows Inputs: How many history bars to calculate on loa
FREE
Qzones
Vinutthapon Bumroong
Quantific Structure Zone is a technical indicator designed for Price Action and SMC traders. It maps the market structure and identifies dynamic supply and demand zones on the chart. Built with a non-repainting algorithm, it provides signals upon confirmed candle closes, making it suitable for live trading and backtesting. The indicator highlights market swings and price levels. Features Automated Market Structure: Identifies and labels structural swing points with HH (Higher High), HL (Higher
FREE
Multi Timeframe ZigZag Indicator
Salman A A A T Bakhash
5 (2)
Description: This indicator draw ZigZag Line in multiple time frame also search for Harmonic patterns before completion of the pattern. Features: Five instances of ZigZag indicators can be configured to any desired timeframe and inputs. Draw Harmonic pattern before pattern completion. Display Fibonacci retracement ratios. Configurable Fibonacci retracement ratios. Draw AB=CD based on Fibonacci retracement you define. You can define margin of error allowed in Harmonic or Fibonacci calculations
FREE
Volume By Color RSJ paints the volume bar in a darker color when the traded volume is above its own moving average, so candles with unusual activity stand out. An optional four-color mode shows the strength of each candle's volume in steps. By default the indicator compares each bar with the 20-period simple average of the volume. The average type and period can be changed in the inputs. How to use The colored bars make it easy to spot breakouts, rejections and climax candles that happen with vo
FREE
SX Supply Demand Zones accurately identifies and draws high-probability Supply and Demand zones using a sophisticated algorithm. Unlike traditional indicators that clutter your chart, this indicator is designed with a focus on performance and a clean user experience. New Unique Feature: Interactive Legend System What truly sets this indicator apart from everything else is the Interactive Control Legend. You have a professional dashboard directly on your chart that allows you to: Show/Hide: Ins
FREE
MASi Three Screens
Aleksey Terentev
5 (2)
MASi Three Screens is based on the trading strategy by Dr. Alexander Elder. This indicator is a collection of algorithms. Algorithms are based on the analysis of charts of several timeframes. You can apply any of the provided algorithms. List of versions of algorithms:     ThreeScreens v1.0 - A simple implementation, with analysis of the MACD line;     ThreeScreens v1.1 - A simple implementation, with analysis of the MACD histogram;     ThreeScreens v1.2 - Combines the first two algorithms in
FREE
MT Supply Demand
Issara Seeboonrueang
4 (4)
We provide indicators tailored to better meet your trading requirements.       >>  MT Magical  << MT Supply Demand : It is an indicator created to find supply and demand, which will be important support and resistance levels for the price.  Supply Zone   is a zone where the price has reached, it is often resisted. In other words, when the price reaches this zone, there will be more selling power to push the price back down. Demand Zone   is a zone where the price has reached, it is ofte
FREE
Simple QM Pattern
Suvashish Halder
3.33 (3)
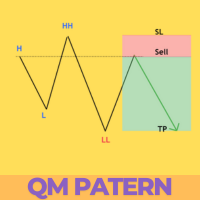
Simple QM Pattern is a powerful and intuitive trading indicator designed to simplify the identification of the Quasimodo (QM) trading pattern. The QM pattern is widely recognized among traders for effectively signaling potential reversals by highlighting key market structures and price action formations. This indicator helps traders easily visualize the QM pattern directly on their charts, making it straightforward even for those who are new to pattern trading. Simple QM Pattern includes dynamic
FREE
RelicusRoad Trading Sessions is a trading sessions indicator for MetaTrader 4 and MetaTrader 5 that marks the opening time of the Tokyo, London and New York sessions with dotted vertical lines on M1, M5 and M15 charts. Each session open is shown as a line, a small rotated name label and an event marker in the session's color, for the current day and the previous weekdays. Hovering over one shows the session name and its opening time. The indicator marks opens only: it does not shade session rang
FREE
About: Get Free Scanner and example Strategies And understand detailed description here: https://www.mql5.com/en/blogs/post/759237 And also get example wrappers from above post. You can make your own wrappers if your indicators have complex conditions or for In-Built MT4 indicators. Features: - Specify your own Custom Indicator - Specify Buffer values and create Variables - Use those Variables to create your own Buy/Sell Conditions - Get Arrows Up/Down Signals - See Arrows Signals in Scanners
Aura Mini Candle Timer - Smart Interactive Edition Aura Mini Candle Timer is a lightweight indicator that intuitively displays the remaining candle time and current candle direction for multiple timeframes (MTF) while taking up minimal chart space. The core feature of this indicator is its interactivity. Without the need to open the indicator settings window, you can simply click the timer panel on the chart to cycle through 7 major timeframes in real-time. [Key Features] One-Click Timeframe Cy
FREE
ZigZag WaveSize MT4
Ivan Butko
4.75 (4)
ZigZag WaveSize - a modified standard ZigZag indicator with added information about the wavelength in points. Features: Optimized online construction logic: labels are not redrawn from scratch on each tick, but work in parallel with the main calculation, drawing only the latest labels when ZigZag draws new lines or updates them. Added another calculation mode in points: the line is drawn if it exceeds the specified number of points in the settings: manual and automatic (according to ATR with a
FREE
Necessary for traders: tools and indicators Waves automatically calculate indicators, channel trend trading Perfect trend-wave automatic calculation channel calculation , MT4 Perfect trend-wave automatic calculation channel calculation , MT5 Local Trading copying Easy And Fast Copy , MT4 Easy And Fast Copy , MT5 Local Trading copying For DEMO Easy And Fast Copy , MT4 DEMO Easy And Fast Copy , MT5 DEMO The homeopathic indicator is also called the CCI indicator. The CCI indicator was proposed
FREE
AI Channels MT4
Duc Hoan Nguyen
5 (1)
Get ALL my MT4 & MT5 indicators FREE — See how here New tools   will be   $30   for the   first week   or the   first 3 purchases !  Trading Tools Channel on MQL5 : Join my MQL5 channel to update the latest news from me The AI Channels Indicator utilizes rolling K-means clustering —a powerful machine learning technique in clustering analysis—to deliver real-time insights into underlying price trends. This indicator creates adaptive channels based on clustered price data, enabling traders to ma
FREE
Pattern 3 Candles
Aleksandr Butkov
4.2 (5)
An Expert Advisor based on the 3 candlestick pattern. 1-SL, 2-TP, 3-OFF - 1 pulls up StopLoss. 2 pulls up TakeProfit. 3-disabled. auto SL / TP on hi-low count bars - number of bars for 1-SL, 2-TP expiration on profit - after passing N bars, TP changes expiration on loss - after N bars have passed SL to open an order + commission pips for loss expiration - the number of points for expiration on profit The rest of the settings are intuitive.
FREE
PZ Penta O MT4
PZ TRADING SLU
2.33 (3)
The Penta-O is a 6-point retracement harmonacci pattern which usually precedes big market movements. Penta-O patterns can expand and repaint quite a bit. To make things easier this indicator implements a twist: it waits for a donchian breakout in the right direction before signaling the trade. The end result is an otherwise repainting indicator with a very reliable trading signal. The donchian breakout period is entered as an input. [ Installation Guide | Update Guide | Troubleshooting | FAQ | A
FREE
False Breakout Stochastic to be used with our Elliott Wave Indicator as part of the overall strategy on trading the 5th wave. As we cannot upload multiple files, we have listed this separately. False Breakout Stochastic is best used as a confirmation tool rather than the sole signal indicator The Elliott Wave Indicator Suite is designed around a simple but effective Swing Trading Strategy. The Indicator Suite is great for Stocks, Futures and Forex trading on multiple timeframes You can find the
FREE
Smart Flow MT4
Douglas Rodrigues
Smart Flow - Institutional Aggression Tracker Smart Flow   is a powerful and intuitive indicator designed to read the true market order flow and identify zones of strong institutional aggression. Instead of guessing tops and bottoms, Smart Flow directly paints your chart's candles whenever it detects a relevant directional capital injection, making your trading decisions highly objective. Working Principle The indicator performs an advanced mathematical calculation on every candle to estimate th
FREE
Colored Candle Time
Saeed Hatam Mahmoudi
Candle Time (MT4) The Candle Time indicator shows the remaining time for the current candle on the active chart timeframe. It adapts automatically to the chart period and updates on every tick. This is a charting utility; it does not provide trading signals and does not guarantee any profit. Main functions Display the time remaining for the current candle on any timeframe (M1 to MN). Color-coded state: green when price is above the open (up), gray when unchanged, and red when below the open (do
FREE
About Range Explosion Range Explosion is a powerful and free trading tool designed to detect market ranges, draw precise support and resistance zones, and identify breakout opportunities with accuracy and style. It is a part of the Break Out Explosion Project, offering traders a reliable and visually advanced solution for both beginners and professionals. MT5 Version of this product is available here : Download If you are interested in breakout trading concepts, check out the advanced tool desig
FREE
Lisek Weis Wave
Darius Hans Lischka
4 (4)
This Weis Wave Volume indicator is a tool to help traders identify the current price trend.  Understanding volume can provide insight into a market's behavior to help you determine its overall health. The most important rule is this: volume precedes price. Typically, before a market price moves, volume comes into play. It has 2 main colors histogram which are green and red. – Green indicates an upward wave. The more the price increases, the bigger the green volume gets. – The red color shows a d
FREE
Triple RSI
Pablo Leonardo Spata
1 (1)
LOOK AT THE FOLLOWING STRATEGY WITH THIS INDICATOR. Triple RSI is a tool that uses the classic Relative Strength Indicator, but in several timeframes to find market reversals.    1.  ️ Idea behind the indicator and its strategy: In Trading, be it Forex or any other asset, the ideal is to keep it simple, the simpler the better . The triple RSI strategy is one of the simple strategies that seek market returns. In our experience, where there is more money to always be won, is in the marke
FREE
Market Profile 3
Hussien Abdeltwab Hussien Ryad
3 (2)
Market Profile 3 MetaTrader 4 indicator  — is a classic Market Profile implementation that can show the price density over time, outlining the most important price levels, value area, and control value of a given trading session. This indicator can be attached to timeframes between M1 and D1 and will show the Market Profile for daily, weekly, monthly, or even intraday sessions. Lower timeframes offer higher precision. Higher timeframes are recommended for better visibility. It is also possible t
FREE
Forex Market Profile and Vwap
Lorentzos Roussos
4.86 (7)
Volume Profile Indicator / Market Profile Indicator What this is not : FMP is not the classic letter-coded TPO display , does not display the overall chart data profile calculation , and , it does not segment the chart into periods and calculate them. What it does :  Most importantly ,the FMP indicator will process data that resides between the left edge of the user defined spectrum and the right edge of the user defined spectrum. User can define the spectrum by just pulling each end of the indi
FREE
UPD1 Watermark MT4
Vitaliy Kuznetsov
5 (2)
The indicator shows any text and any image on the chart, and can also output the information requested by macros. There are three text blocks and one block for images. Available font selection, size, color, indentation and positioning. If you want to brand your screenshots or display the necessary information on a graph, then UPD1 Watermark will be a very useful tool. Description of settings. Text Settings (3 blocks). Text 1, 2, 3 – enter the text and, or a macro. Font Name – write the font n
FREE
Buyers of this product also purchase
Trend SniperX MT4
Sarvarbek Abduvoxobov
5 (5)
Trend Sniper X is a multi-timeframe trend-following indicator for MetaTrader 5 that helps traders identify trend direction and potential reversal points with clarity and precision. For MT5: https://www.mql5.com/en/market/product/181101 Price Information: The current price is promotional and is subject to change as upcoming updates and new features are released. Code2Profit Channel Master the Market with Multi-Timeframe Analysis! How to Maximize Your Win Rate with Trend Sniper X: Key Rules & Sess
Scalper Vault
Oleg Rodin
5 (40)
Scalper Vault is a powerful, fully-equipped trading system designed for traders who want to achieve consistency in intraday trading . This high-precision indicator serves as a complete, standalone trading system that delivers institutional-grade analysis for both Forex and Binary Options traders. PLEASE CONTACT ME AFTER PURCHASE TO GET MY TRADING TIPS PLUS A GREAT BONUS! By eliminating the guesswork and complex manual analysis, Scalper Vault allows you to focus purely on execution using easy t
Currency Strength Wizard is a very powerful indicator that provides you with all-in-one solution for successful trading. The indicator calculates the power of this or that forex pair using the data of all currencies on multiple time frames. This data is represented in a form of easy to use currency index and currency power lines which you can use to see the power of this or that currency. All you need is attach the indicator to the chart you want to trade and the indicator will show you real str
PRO Renko System
Oleg Rodin
5 (31)
PRO Renko System is a highly accurate trading system specially designed for trading RENKO charts. The ARROWS and Trend Indicators DO NOT REPAINT! The system effectively neutralizes so called market noise giving you access to accurate reversal signals. The indicator is very easy to use and has only one parameter responsible for signal generation. You can easily adapt the tool to any trading instrument of your choice and the size of the renko bar. I am always ready to provide extra support to help
SR Liquidity
Oleg Rodin
5 (2)
SR Liquidity is a trading indicator designed to reveal the hidden zones where market liquidity concentrates and price reacts most strongly. These special liquidity areas act as powerful support and resistance levels, giving you a clear map of where the market is most likely to reverse. Instead of drawing ordinary Support/Resistance lines, SR Liquidity analyzes real price behavior to detect the zones where buying and selling pressure accumulate. These are actually the pools of liquidity that driv
Zoryk Gold mt4
Reda El Koutbane
5 (3)
discount ends soon original price 69 $ ZORYK — Advanced XAUUSD Signal System for MetaTrader 4 You know the feeling. You spend time analyzing gold. You wait for the entry. You finally open the trade, and price immediately moves against you. You close too early, move the Stop Loss, or hesitate for a few seconds. Then the market reaches the exact destination you originally expected without you. The direction was not always the problem. The real problem was uncertainty. You did not know exactl
Atomic Analyst
Issam Kassas
5 (14)
Atomic Analyst — MetaTrader 4 For product questions, setup guidance, or technical support, message me directly here on MQL5. The indicator turns complex market calculations into simple visual signals, color-coded candles, trend readings, stop-loss levels, and multiple take-profit zones that traders can understand quickly and use in real market conditions. Main Trading Uses: Scalping and intraday trading: Designed for fast decision-making, clear arrows, alerts, candle colors, and structured entry
Smart Trend Trading System is a chart indicator for MetaTrader 4 that brings trend information, entry and exit signals, and price levels into one workspace. It combines 10+ trading tools into one system, including trend detection, reversal zones, smart cloud, trailing stop logic, support and resistance, candle coloring, alerts, and multi-timeframe analysis. The system is designed to help you trade different market conditions: Trending markets: Identify the main trend, detect pullbacks, follow mo
SIO Oscillator: Self-Optimizing Semivariance Imbalance Oscillator Buy the indicator and get the Expert Advisor based on it for FREE. Most oscillators treat all price movement the same. SIO separates upside and downside market pressure and measures the imbalance between them, showing which side is really in control: buyers or sellers. When the imbalance reaches an extreme, SIO prints a clear signal with entry, Stop Loss and Take Profit levels. What makes SIO different is that it doesn’t rely on f
Quant Direction
Georgios Kalomoiropoulos
Quant Direction is a 3 dimensional market analysis tool. It provides a purely objective, algorithmic view of the market by calculating exact percentage-based biases across multiple dimensions simultaneously. Developed utilizing advanced AI modeling tools and subjected to thorough testing, this algorithm is engineered to read the market with unique precision. It can analyze any currency pair or financial instrument available on your platform.  Quant Direction is the ideal tool whether you are a S
Trend Lines PRO
Roman Podpora
5 (2)
TREND LINES PRO    helps understand where the market is truly changing direction. The indicator shows real trend reversals and points where major players re-enter. You see   BOS lines   Trend changes and key levels on higher timeframes — without complex settings or unnecessary noise. Signals don't repaint and remain on the chart after the bar closes. VERSION MT 5     -     Reveals its maximum potential when paired with the   RFI LEVELS PRO  indicator What the indicator shows: Real shifts   tren
AW Prime Oscillator
AW Trading Software Limited
5 (1)
A combination of two oscillators. The first one displays the entry points, the second shows the current trend . The indicator can display oscillator signals by arrows in two modes, all fast oscillator signals or signals only in the direction of the current trend. It has a multi-timeframe panel and three types of signal notifications. Benefits: Suitable for day and scalping trading Trend filtering Simple and sensitive setup Multi-timeframe panel Suitable for integration into an advisor. Works on

M1 Sniper
Oleg Rodin
4.97 (30)
M1 SNIPER  is an easy to use trading indicator system. It is an arrow indicator which is designed for M1 time frame. The indicator can be used as a standalone system for scalping on M1 time frame and it can be used as a part of your existing trading system. Though this trading system was designed specifically for short-term trading, it still can be helpful for all traders. This trading system can be used with any forex pair and time frame, though lower time frames are recommended from M1 up to M
Hidden Cycles
Lev Vladimirovic Marushkin
5 (1)
The Only 100% Universal Tool! Stop trading against nature! This is your chance to secure the only indicator rooted in the absolute laws that govern the entire universe. Most tools guess—this one reveals the truth. Buy another toy or buy the truth. Your choice... Based on Universal Laws — NOT Some Guy’s Algorithm: Let the market adjust to the Hidden Cycles Geometry — not the other way around. Most indicators are based on a man-made formula. They often lag, fail over time, or need constant re-o
Neo Wave PRO
Nikolay Raykov
5 (1)
Price & Time Market Structure Indicator A professional market structure tool that analyzes waves through both price and time — not price alone. Main Description NeoWave PRO is a professional market structure indicator for MetaTrader 4 designed for traders who want to move beyond traditional one-dimensional wave tools such as ZigZag, swing indicators, and basic high/low systems. Most wave indicators analyze only one thing: Price. But a real market wave is not only a price movement. A true wave de
PZ Turning Points MT4
PZ TRADING SLU
1 (1)
Identify key turning points with reliable fractal analysis This indicator examines the price structure of fractals of different periods to determine possible reversal points in the market, providing timing to positional traders that already have a fundamental or technical valuation model. Unlike its younger brother, Reversal Fractals , this indicator won't miss reversals because of the period selected, and will find reversal fractals on a zig-zag fashion, ignoring those reversals which do not
CRT Multi-Timeframe Market Structure & Liquidity Sweep Indicator Non-Repainting | Multi-Asset | MT5 Version Available MT5 Version:   https://www.mql5.com/en/market/product/162075 Full User Guide — explains what each feature does and why:   https://www.mql5.com/en/blogs/post/767525 Quick Start User Guide  — explains how to configure and in what order:  https://www.mql5.com/en/blogs/post/767540 Indicator Overview CRT Ghost Candle HTF Fractal is a complete institutional-grade market structure too
Gann Time Clusters
Martin Eshleman
2.5 (2)
Gann Time Clusters Indicator This indicator is based on W. D. Gann's Square of 9 method for the time axis. It uses past market reversal points and applies the mathematical formula for Gann's Square of 9 and then makes projections into the future. A date/time where future projections line up is called a 'time cluster'. These time clusters are drawn as vertical lines on the right side of the chart where the market has not advanced to yet. A time cluster will result in a market reversal point (ex.
Neuro Poseidon MT4
Daria Rezueva
4.74 (46)
Neuro Poseidon is a new indicator by Daria Rezueva. It combines precise trading signals with adaptive TP/SL levels - creating best possible trades as a result! Message me and get  Neuro Poseidon Assistant  as a gift to automize your trading process! What makes it stand out? 1. Proven profitability on all assets and timeframes 2. Only confirmed BUY and SELL signals present on the chart 3. Adaptive TP & SL levels generated by the software for each trade 4. Easy to understand - suitable for all
Non repaint MT4
Yan Zhen Du
5 (1)
This is a professional chart indicator designed for traders focused on stability and clear price action. It helps filter market noise and provides clear visual entry and exit zones for your trading decisions. Core Features: Strictly Non-Repainting: The system is built with strict non-repaint logic. What you see on the chart is the true historical performance. Confirmed Signals: Signals are triggered and confirmed only after the candle closes . Once a trading arrow appears on a closed candle, it
Forex Breath System is a trend based trading system which can be used with any market. You can use this system with currencies, metals, commodities, indices, crypto and even stocks. It can also be used with any time frame. The system is universal. It shows trend and provides arrow signals with the trend. The indicator can also provide you with a special type of alerts when the signals appear in the direction of the trend which makes trend trading an easy task. The indicator is very easy to use a
Advanced Supply Demand
Bernhard Schweigert
4.91 (302)
Trading Special – 30% OFF Best Solution for any Newbie or Expert Trader! This indicator is a unique, high quality and affordable trading tool because we have incorporated a number of proprietary features and a new formula. With this update, you will be able to show double timeframe zones. You will not only be able to show a higher TF but to show both, the chart TF, PLUS the higher TF: SHOWING NESTED ZONES. All Supply Demand traders will love it. :) Important Information Revealed Maximize the pot
Super Signal – Skyblade Edition Professional No-Repaint / No-Lag Trend Signal System with Exceptional Win Rate | For MT4 / MT5 It works best on lower timeframes, such as 1-minute, 5-minute, and 15-minute charts. Core Features: Super Signal – Skyblade Edition is a smart signal system designed specifically for trend trading. It applies a multi-layered confirmation mechanism to detect only strong, directional moves supported by real momentum. This system does not attempt to predict tops or bottoms
Liquidity Scalper System: a liquidity-based trading system in indicator form. Most indicators only show an arrow, and the trader then has to decide where the stop goes, where the target is and whether the signal can be trusted at all. Liquidity Scalper System covers the full trade cycle: it finds liquidity pools, gives a signal when they are broken, immediately calculates Entry, Stop Loss and three targets, and shows statistics and out-of-sample test results on the panel. The system picks its o
Tokyo mt4 Indicator
Vasiliy Strukov
5 (9)
Tokyo Indicator provides a clear visual overview of trend direction, potential trading signals, and market conditions. Its colour-coded, stepped trend line distinguishes bullish phases in blue from bearish phases in magenta. Matching directional arrows highlight potential buying and selling opportunities when the displayed trend changes. An integrated dashboard brings together the current signal, market bias, momentum, volatility, and signal quality in one convenient view. This allows traders t
Gann Made Easy
Oleg Rodin
4.84 (174)
Gann Made Easy is a professional and easy to use Forex trading system which is based on the best principles of trading using the theory of W.D. Gann. The indicator provides accurate BUY and SELL signals including Stop Loss and Take Profit levels. You can trade even on the go using PUSH notifications. PLEASE CONTACT ME AFTER PURCHASE TO GET TRADING  INSTRUCTIONS   AND GREAT EXTRA INDICATORS  FOR FREE! Probably you already heard about the Gann trading methods before. Usually the Gann theory is a

Break and Retest Hunter MT4 is a powerful MetaTrader 5 indicator designed to automatically identify support and resistance levels, breakout structures, and potential retest opportunities in real time. Bonus Indicator: After purchasing Break and Retest Hunter , contact me to receive Trade Indicator Assistant EA completely free as a bonus utility. $65 for the next 10 copies . Next price is $120.  Combining adaptive market analysis, clear BUY/SELL signals, Fibonacci-based profit targets, and a pre
Trading Special –40% OFF Best Solution for any Newbie or Expert Trader! This Indicator is a unique, high quality and affordable trading tool because we have incorporated a number of proprietary features and a new formula. With only ONE chart you can read Currency Strength for 28 Forex pairs! Imagine how your trading will improve because you are able to pinpoint the exact trigger point of a new trend or scalping opportunity? User manual: click here Looking for the MT5 version? Click here: https:/
Gold Channel is a volatility-based indicator, developed with a specific timing algorithm for the XAUUSD pair, which consists of finding possible corrections in the market. This indicator shows two outer lines, an inner line (retracement line) and an arrow sign, where the theory of the channel is to help identify overbought and oversold conditions in the market. The market price will generally fall between the boundaries of the channel. If prices touch or move outside the channel it is a tradi
Trading Special – 30% OFF Best Solution for any Newbie or Expert Trader! This dashboard software is working on 28 currency pairs plus one. It is based on 2 of our main indicators (Advanced Currency Strength 28 and Advanced Currency Impulse). It gives a great overview of the entire Forex market plus Gold or 1 indices. It shows Advanced Currency Strength values, currency speed of movement and signals for 28 Forex pairs in all (9) timeframes. Imagine how your trading will improve when you can watch

More from author
Anchored VWAP (AVWAP) for MT4 – Ultimate Drag & Drop Volume-Weighted Average Price Indicator Unlock true institutional volume analysis with the definitive Anchored VWAP (AVWAP) indicator designed specifically for MetaTrader 4. Featuring a fully interactive, draggable vertical line right on your chart, this tool lets you anchor your volume-weighted calculations to any significant market event instantly. Simply click and drag the anchor line to any swing low, swing high, market structure shift,
FREE
Gartley Patterns
Jeffrey Lloyd Lauzon
Gartley Patterns (Harmonic Scanner) Gartley Patterns is an institutional-grade technical overlay engineered to automatically map complex harmonic price structures and swing imbalances across active execution cycles. By processing market geometry dynamically through strict multi-timeframe swing filters, this utility completely eliminates manual calculation errors and gives traders an instant visual panel of high-probability reversal zones on a single chart window. Utilizing specialized sing
FREE
Fast VWAP
Jeffrey Lloyd Lauzon
Fast VWAP  (Highly Optimized Intraday Dashboard) The Fast VWAP Matrix is an institutional-grade technical overlay designed to isolate volume-weighted fair value and intraday structural balance across active execution cycles. By processing price action dynamically through volume-weighting thresholds, this utility completely eliminates calculation delay and gives traders an instant visual panel of asset distribution on a single window. Utilizing specialized single-pass memory arrays, this matrix
FREE
EMA Trend Trader
Jeffrey Lloyd Lauzon
The EMA Trader System is a technical overlay designed to isolate trend continuation and structural balance across active execution cycles. By processing price action dynamically through multi-timeframe moving average thresholds and robust slope filters, this utility completely eliminates calculation delay and gives traders an instant visual HUD dashboard of live trade signals on a single window. Utilizing specialized single-pass memory arrays, this system tracks multi-period EMA loops and highe
FREE
Dual Slope Moving Averages & Support | Resistance Dashboard Professional Institutional-Grade Indicator for MetaTrader 4 (MT4) Transform your chart analysis with Trend Bars With Moving Averages, an elite institutional utility engineered by a professional C++ systems programmer. Designed for high-speed MQL4 execution, this indicator blends multi-slope Moving Average color-coding with a built-in, interactive Support & Resistance Reversal Dashboard. Whether you trade Forex majors or index futures,
FREE
CCI Trend Monitor
Jeffrey Lloyd Lauzon
MTF Commodity Channel Index (CCI) Matrix (Free Advanced Trend Scanner Dashboard) The Multi-Timeframe Commodity Channel Index (CCI) Matrix is an institutional-grade technical scanner designed to evaluate cyclical trend momentum and structural threshold breakouts across 4 distinct execution timeframes simultaneously[cite: 18, 19]. By monitoring the M15, H1, H4, and D1 intervals concurrently[cite: 18, 19], this utility completely eliminates multi-chart cluttering and gives traders an instant execu
FREE
MTF DeMarker Exhaustion Matrix (Free Advanced Exhaustion Dashboard) The Multi-Timeframe DeMarker Exhaustion Matrix is an institutional-grade technical scanner designed to isolate subtle price exhaustion zones and impending market reversals across multiple execution cycles simultaneously. By monitoring the M15, H1, H4, and D1 intervals concurrently[cite: 4], this utility completely eliminates multi-chart cluttering and gives traders an instant executive matrix of trend exhaustion and structural
FREE
Rate of Change Matrix
Jeffrey Lloyd Lauzon
MTF Rate of Change (ROC) Matrix (Free Advanced Price Velocity Dashboard) The Multi-Timeframe Rate of Change (ROC) Matrix is an institutional-grade technical scanner designed to evaluate pure historical price velocity across 4 distinct execution timeframes simultaneously. By monitoring the M15, H1, H4, and D1 intervals concurrently[cite: 18], this utility completely eliminates multi-chart cluttering and gives traders an instant executive matrix of momentum acceleration and structural trend force
FREE
MTF Ultimate Oscillator Matrix (Free Advanced Multi-Timeframe Dashboard) The Multi-Timeframe Ultimate Oscillator Matrix is an institutional-grade technical scanner designed to evaluate momentum convergence across three distinct lookback horizons on four execution timeframes simultaneously. By monitoring the M15, H1, H4, and D1 intervals concurrently, this utility completely eliminates multi-chart cluttering and gives traders an instant executive matrix of weighted momentum expansion and overbou
FREE
Master Trading Matrix
Jeffrey Lloyd Lauzon
Master Trading Matrix (Free Advanced Multi-Indicator Dashboard) The Master Trading Matrix is an institutional-grade technical convergence scanner designed to combine 10 foundational momentum, trend, and exhaustion engines into a single, unified execution display. By integrating RSI, Stochastic, CCI, Williams %R, DeMarker, Momentum, RVI, Chande Momentum, Rate of Change, and Ultimate Oscillator into an executive matrix, this utility eliminates multi-window clutter and provides a complete, real-ti
FREE
RSI Monitors
Jeffrey Lloyd Lauzon
MTF Relative Strength Index (RSI) Matrix (Free Advanced Momentum Dashboard) The Multi-Timeframe Relative Strength Index (RSI) Matrix is an institutional-grade technical scanner designed to evaluate momentum and overbought/oversold conditions across 4 distinct execution timeframes simultaneously[cite: 5, 6]. By monitoring the M15, H1, H4, and D1 intervals concurrently[cite: 5, 6], this utility completely eliminates multi-chart cluttering and gives traders an instant executive matrix of momentum
FREE
CMO Monitor
Jeffrey Lloyd Lauzon
MTF Chande Momentum Matrix (Free Advanced Momentum Dashboard) The Multi-Timeframe Chande Momentum Matrix is an institutional-grade technical scanner designed to isolate raw market momentum and structural exhaustion across multiple execution cycles simultaneously. By monitoring the M15, H1, H4, and D1 intervals concurrently, this utility completely eliminates multi-chart cluttering and gives traders an instant executive matrix of trend structural health on a single window. Unlike common smoothe
FREE
MTF Momentum Oscillator Matrix (Free Advanced Velocity Dashboard) The Multi-Timeframe Momentum Oscillator Matrix is an institutional-grade technical scanner designed to map out the velocity of price change across clean rolling history blocks simultaneously. By monitoring the M15, H1, H4, and D1 intervals concurrently, this utility completely eliminates multi-chart cluttering and gives traders an instant executive matrix of trend speed and directional acceleration on a single window. Instead of
FREE
RVI Monitor
Jeffrey Lloyd Lauzon
MTF Relative Vigor Index (RVI) Matrix (Free Advanced Trend Health Dashboard) The Multi-Timeframe Relative Vigor Index (RVI) Matrix is an institutional-grade technical scanner designed to evaluate directional trend vigor and conviction across 4 distinct execution timeframes simultaneously[cite: 10, 11]. By monitoring the M15, H1, H4, and D1 intervals concurrently[cite: 10, 11], this utility completely eliminates multi-chart cluttering and gives traders an instant executive matrix of trend health
FREE
Stochastic Monitor
Jeffrey Lloyd Lauzon
MTF Stochastic Matrix (Free Advanced Momentum Crossover Dashboard) The Multi-Timeframe Stochastic Matrix is an institutional-grade technical scanner designed to evaluate momentum cycles, %K/%D line crossovers, and extreme overbought/oversold boundaries across 4 distinct execution timeframes simultaneously[cite: 14, 15]. By monitoring the M15, H1, H4, and D1 intervals concurrently[cite: 14, 15], this utility completely eliminates multi-chart cluttering and gives traders an instant executive matr
FREE
MTF Simple Moving Average (Free Institutional Moving Average Overlay) The Multi-Timeframe Simple Moving Average (MTF SMA) is an institutional-grade technical utility designed to project higher-timeframe trend baselines directly onto your lower-timeframe execution charts. Developed by a C++ systems programmer specializing in high-speed MQL4 architecture, this indicator provides traders with seamless market structure visibility without requiring multiple open windows or manual chart toggling.
FREE
Williams Monitor
Jeffrey Lloyd Lauzon
MTF Williams %R Matrix (Free Advanced Multi-Timeframe Dashboard) The Multi-Timeframe Williams %R Matrix is an institutional-grade technical scanner designed to evaluate momentum extremes and key boundary dynamics across four execution timeframes simultaneously[cite: 5, 6]. By monitoring the M15, H1, H4, and D1 intervals concurrently, this utility completely eliminates multi-chart cluttering and gives traders an instant executive matrix of price relative to recent high-low ranges on a single win
FREE
Filter:
No reviews
Reply to review