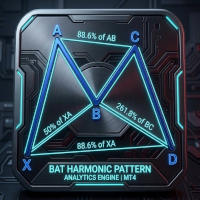
Bat Patterns

Bat Patterns (Harmonic Scanner)

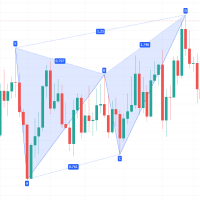
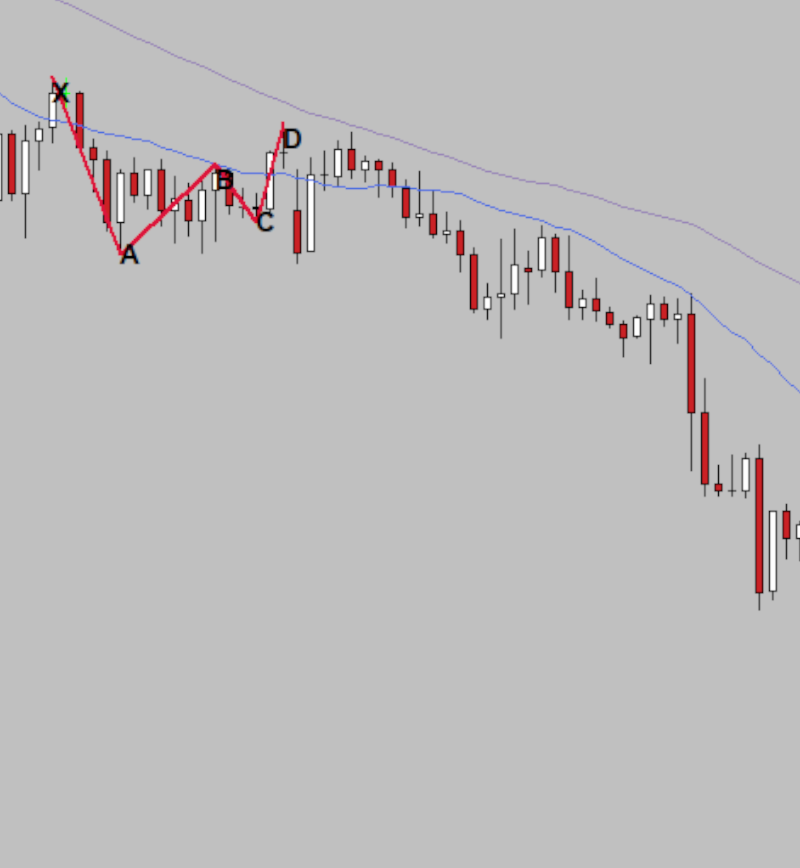
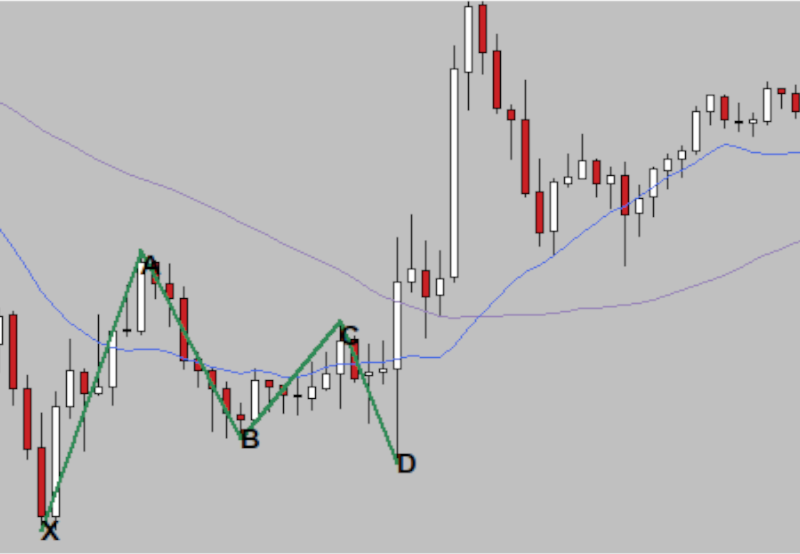
Bat Patterns is an institutional-grade technical overlay engineered to automatically map complex harmonic price structures and swing imbalances across active execution cycles. By processing market geometry dynamically through strict multi-timeframe swing filters, this utility completely eliminates manual calculation errors and gives traders an instant visual panel of high-probability reversal zones on a single chart window.

Utilizing specialized single-pass pattern recognition logic, this indicator tracks structural pivot points relative to custom history depth windows. It transforms complex Fibonacci weighting metrics into clean visual states, helping traders spot precise institutional entry and risk parameters long before standard indicators react.

Core Technical Features

- Dual-Engine Pattern Recognition: Automatically identifies and processes both Bullish and Bearish institutional Bat structures.
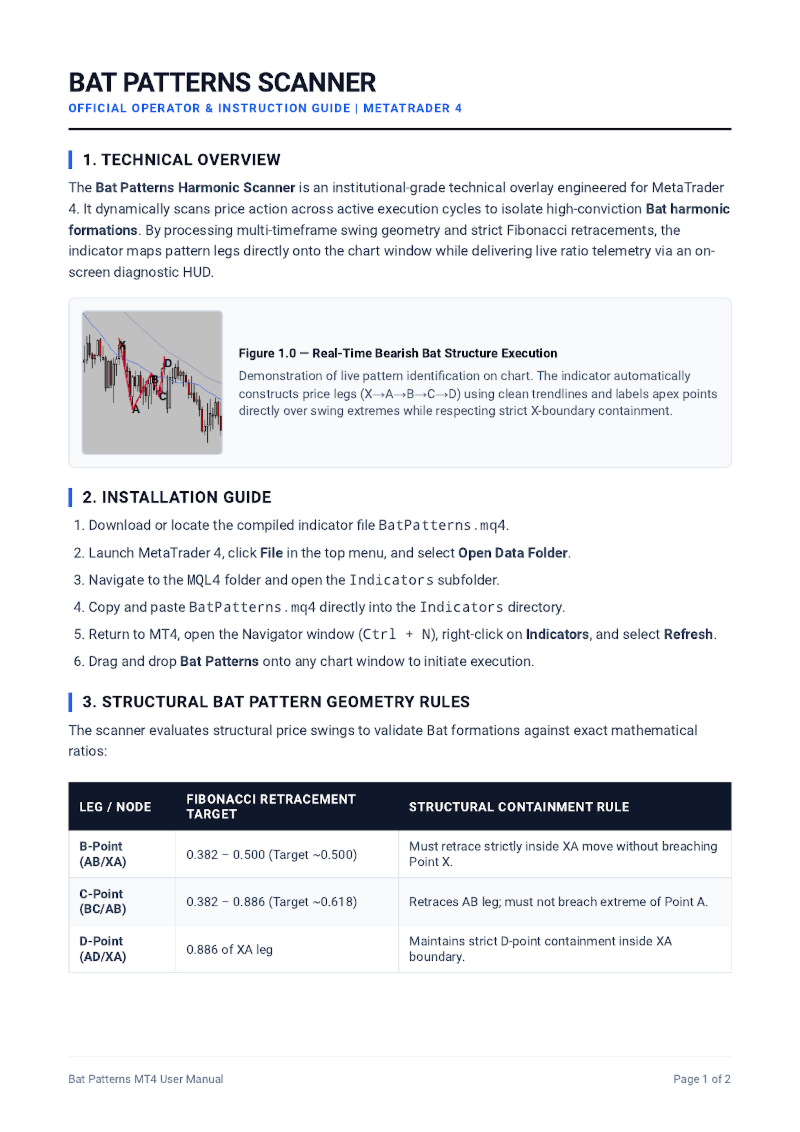
- Strict Harmonic Tolerance Band: Utilizes precision Fibonacci ratio verification (B point retrace 0.382-0.50, C point retrace 0.382-0.886, and D point completion ~0.886 of XA) to filter out false formations and isolate high-conviction setups.
- Intuitive Color-Coded State Machine: Instantly adapts indicator rendering and trendline legs to contrast flawlessly with the main chart workspace using customizable input colors (SeaGreen for Bullish, Crimson for Bearish).
- Actionable Value Panel Output: Translates active pattern ratios into explicit metric readouts configured down to the fractional decimal.
- Institutional Solid Workspace Panel: Includes dynamic object mapping that outlines structural legs and apex labels cleanly on a sleek, modern layout.
- Zero Terminal Lag / High Performance Architecture: Engineered with an optimized single-pass loop execution that runs smoothly, completely avoiding terminal lag during high-frequency execution.

Interactive Status & Interpretation Logic

The indicator tracks real-time data calculations and formats the active pattern readout based on asset decimal precision automatically:

- Dynamic Geometric Plotting: Draws chronological trendline legs directly across asset swings to serve as exact mean-reversion and reversal zones.
- Labeled Apex Matrix: Formats and displays structural coordinate strings (X, A, B, C, D) explicitly across pivot points utilizing clean typography standards.
- Clean Object Management: Employs automated clean-up logic that removes outdated graphical objects seamlessly when scanning new historical data.

Adjustable Input Parameters

Tailor the calculation matrix completely to your personalized risk strategy directly through the input dashboard:

- MinPipMove (Default: 10.0): Adjusts the minimum swing size filter in pips to screen out market noise.
- BarsToScan (Default: 1500): Modifies the history depth scanner window for performance tuning.
- BullishColor (Default: SeaGreen): Customizes the line color for bullish Bat formations.
- BearishColor (Default: Crimson): Customizes the line color for bearish Bat formations.

Produits recommandés
Gartley Patterns
Jeffrey Lloyd Lauzon
Gartley Patterns (Harmonic Scanner) Gartley Patterns is an institutional-grade technical overlay engineered to automatically map complex harmonic price structures and swing imbalances across active execution cycles. By processing market geometry dynamically through strict multi-timeframe swing filters, this utility completely eliminates manual calculation errors and gives traders an instant visual panel of high-probability reversal zones on a single chart window. Utilizing specialized sing
FREE
Adaptive Volume Profile dessine le Profil de Volume des dernières barres directement sur le graphique : le Point of Control (POC), la Value Area (VAH / VAL), les nœuds de volume élevé (HVN), les nœuds de faible volume (LVN) et un histogramme de volume optionnel. La taille des lignes de prix s'adapte à la volatilité actuelle (ATR), de sorte que le profil reste lisible sur tout symbole et toute unité de temps. Fonctionnalités POC - le niveau de prix avec le plus grand volume échangé dans la fenêtr
FREE
This indicator filters the Zigzag indicator to calculate the main support and resistance levels. Variables minimum gap between peaks : is the distance (GAP) between the peaks of the Zigzag peaks sensitivity : Minimum number of nearby peaks look back: it means that it has to test the last 50 peaks in the Zigzag object name perfix: a prefix for level’s line name on chart
FREE
Multi Spread Hunter Info
Alessandro Michele Ventrella
Scanner a diffusione Spread Scanner è uno strumento di monitoraggio multi-simbolo elegante, professionale e ad alte prestazioni, progettato per MetaTrader 4 (MT4). Consente ai trader di tracciare e confrontare in tempo reale gli spread su 10 strumenti di trading personalizzabili simultaneamente, direttamente da un'interfaccia HUD intuitiva sul grafico. Che si tratti di operare sulle principali coppie di valute Forex, sui metalli preziosi o sugli indici, sapere dove le condizioni di esecuzione so
FREE
Après avoir acheté l'indicateur Tpx Dash Supply Demand, vous devez télécharger l'indicateur qui se connectera à ce dernier et lui fournira les données de marché. Il vous fournira également tous les signaux de prix de l'offre et de la demande, l'ATR Stop, le VAH et le VAL, les valeurs de tendance avec l'ADX, ainsi que les prix et les emplacements des points de contact (POC) sur le marché. Il vous suffit de le télécharger et Dash le localisera pour récupérer les informations !
FREE
External Bar
Georgi Gaydarov
Simple indicator that shows external ( outside ) bars. In certain cases, external bars can be seen as strong trend bars instead of range bars. This can be observed when a with-trend external bar occurs at a reversal from a strong trend. It will help you notice more easily different patterns like - Inside-outside-inside, Inside- Inside -inside, outside - Inside -outside, etc. Works perfectly with my other free indicators Internal bar and Shadows Inputs: How many history bars to calculate on loa
FREE
Qzones
Vinutthapon Bumroong
Quantific Structure Zone is a technical indicator designed for Price Action and SMC traders. It maps the market structure and identifies dynamic supply and demand zones on the chart. Built with a non-repainting algorithm, it provides signals upon confirmed candle closes, making it suitable for live trading and backtesting. The indicator highlights market swings and price levels. Features Automated Market Structure: Identifies and labels structural swing points with HH (Higher High), HL (Higher
FREE
Multi Timeframe ZigZag Indicator
Salman A A A T Bakhash
5 (2)
Description: This indicator draw ZigZag Line in multiple time frame also search for Harmonic patterns before completion of the pattern. Features: Five instances of ZigZag indicators can be configured to any desired timeframe and inputs. Draw Harmonic pattern before pattern completion. Display Fibonacci retracement ratios. Configurable Fibonacci retracement ratios. Draw AB=CD based on Fibonacci retracement you define. You can define margin of error allowed in Harmonic or Fibonacci calculations
FREE
Volume By Color RSJ colore la barre de volume d'une teinte plus foncée lorsque le volume échangé est supérieur à sa propre moyenne mobile, ce qui fait ressortir les bougies à l'activité inhabituelle. Un mode optionnel à quatre couleurs indique par paliers la force du volume de chaque bougie. Par défaut, l'indicateur compare chaque barre à la moyenne simple du volume sur 20 périodes. Le type et la période de la moyenne peuvent être modifiés dans les paramètres d'entrée. Utilisation Les barres col
FREE
SX Supply Demand Zones accurately identifies and draws high-probability Supply and Demand zones using a sophisticated algorithm. Unlike traditional indicators that clutter your chart, this indicator is designed with a focus on performance and a clean user experience. New Unique Feature: Interactive Legend System What truly sets this indicator apart from everything else is the Interactive Control Legend. You have a professional dashboard directly on your chart that allows you to: Show/Hide: Ins
FREE
MASi Three Screens
Aleksey Terentev
5 (2)
MASi Three Screens is based on the trading strategy by Dr. Alexander Elder. This indicator is a collection of algorithms. Algorithms are based on the analysis of charts of several timeframes. You can apply any of the provided algorithms. List of versions of algorithms:     ThreeScreens v1.0 - A simple implementation, with analysis of the MACD line;     ThreeScreens v1.1 - A simple implementation, with analysis of the MACD histogram;     ThreeScreens v1.2 - Combines the first two algorithms in
FREE
MT Supply Demand
Issara Seeboonrueang
4 (4)
We provide indicators tailored to better meet your trading requirements.       >>  MT Magical  << MT Supply Demand : It is an indicator created to find supply and demand, which will be important support and resistance levels for the price.  Supply Zone   is a zone where the price has reached, it is often resisted. In other words, when the price reaches this zone, there will be more selling power to push the price back down. Demand Zone   is a zone where the price has reached, it is ofte
FREE
Simple QM Pattern
Suvashish Halder
3.33 (3)
Simple QM Pattern is a powerful and intuitive trading indicator designed to simplify the identification of the Quasimodo (QM) trading pattern. The QM pattern is widely recognized among traders for effectively signaling potential reversals by highlighting key market structures and price action formations. This indicator helps traders easily visualize the QM pattern directly on their charts, making it straightforward even for those who are new to pattern trading. Simple QM Pattern includes dynamic
FREE
RelicusRoad Trading Sessions est un indicateur de séances de trading pour MetaTrader 4 et MetaTrader 5 qui marque l'heure d'ouverture des séances de Tokyo, Londres et New York avec des lignes verticales en pointillés sur les graphiques M1, M5 et M15. Chaque ouverture de séance est représentée par une ligne, une petite étiquette de nom pivotée et un repère d'événement dans la couleur de la séance, pour le jour en cours et les jours ouvrés précédents. Survoler l'un d'eux affiche le nom de la séanc
FREE
About: Get Free Scanner and example Strategies And understand detailed description here: https://www.mql5.com/en/blogs/post/759237 And also get example wrappers from above post. You can make your own wrappers if your indicators have complex conditions or for In-Built MT4 indicators. Features: - Specify your own Custom Indicator - Specify Buffer values and create Variables - Use those Variables to create your own Buy/Sell Conditions - Get Arrows Up/Down Signals - See Arrows Signals in Scanners
Aura Mini Candle Timer – Édition intelligente et interactive Aura Mini Candle Timer est un indicateur léger qui affiche intuitivement le temps restant avant la clôture de la bougie ainsi que sa direction actuelle pour plusieurs unités de temps (MTF), tout en occupant un espace minimal sur le graphique. La caractéristique principale de cet indicateur est son interactivité. Sans avoir à ouvrir la fenêtre des paramètres, il vous suffit de cliquer sur le panneau du minuteur affiché sur le graphiq
FREE
ZigZag WaveSize - un indicateur ZigZag standard modifié avec l'ajout d'informations sur la longueur d'onde en points. Particularités : Logique de construction en ligne optimisée : les étiquettes ne sont pas redessinées à partir de zéro à chaque tick, mais fonctionnent en parallèle avec le calcul principal, en dessinant uniquement les dernières étiquettes lorsque ZigZag dessine de nouvelles lignes ou les met à jour. Ajout d'un autre mode de calcul en points : la ligne est construite si elle dép
FREE
Necessary for traders: tools and indicators Waves automatically calculate indicators, channel trend trading Perfect trend-wave automatic calculation channel calculation , MT4 Perfect trend-wave automatic calculation channel calculation , MT5 Local Trading copying Easy And Fast Copy , MT4 Easy And Fast Copy , MT5 Local Trading copying For DEMO Easy And Fast Copy , MT4 DEMO Easy And Fast Copy , MT5 DEMO The homeopathic indicator is also called the CCI indicator. The CCI indicator was proposed
FREE
AI Channels MT4
Duc Hoan Nguyen
5 (1)
Recevez GRATUITEMENT tous mes indicateurs MT4 et MT5 — Découvrez comment ici Les nouveaux outils   seront à   $30   pendant la   première semaine   ou pour les   3 premiers achats !  Chaîne Trading Tools sur MQL5 : Rejoignez ma chaîne MQL5 pour recevoir mes dernières actualités L’indicateur AI Channels utilise le clustering K-means mobile , une technique puissante d’apprentissage automatique en analyse de regroupement, pour fournir des informations en temps réel sur les tendances de prix sous-
FREE
Pattern 3 Candles
Aleksandr Butkov
4.2 (5)
An Expert Advisor based on the 3 candlestick pattern. 1-SL, 2-TP, 3-OFF - 1 pulls up StopLoss. 2 pulls up TakeProfit. 3-disabled. auto SL / TP on hi-low count bars - number of bars for 1-SL, 2-TP expiration on profit - after passing N bars, TP changes expiration on loss - after N bars have passed SL to open an order + commission pips for loss expiration - the number of points for expiration on profit The rest of the settings are intuitive.
FREE
PZ Penta O MT4
PZ TRADING SLU
2.33 (3)
The Penta-O is a 6-point retracement harmonacci pattern which usually precedes big market movements. Penta-O patterns can expand and repaint quite a bit. To make things easier this indicator implements a twist: it waits for a donchian breakout in the right direction before signaling the trade. The end result is an otherwise repainting indicator with a very reliable trading signal. The donchian breakout period is entered as an input. [ Installation Guide | Update Guide | Troubleshooting | FAQ | A
FREE
False Breakout Stochastic to be used with our Elliott Wave Indicator as part of the overall strategy on trading the 5th wave. As we cannot upload multiple files, we have listed this separately. False Breakout Stochastic is best used as a confirmation tool rather than the sole signal indicator The Elliott Wave Indicator Suite is designed around a simple but effective Swing Trading Strategy. The Indicator Suite is great for Stocks, Futures and Forex trading on multiple timeframes You can find the
FREE
Smart Flow MT4
Douglas Rodrigues
Smart Flow - Institutional Aggression Tracker Smart Flow   is a powerful and intuitive indicator designed to read the true market order flow and identify zones of strong institutional aggression. Instead of guessing tops and bottoms, Smart Flow directly paints your chart's candles whenever it detects a relevant directional capital injection, making your trading decisions highly objective. Working Principle The indicator performs an advanced mathematical calculation on every candle to estimate th
FREE
Colored Candle Time
Saeed Hatam Mahmoudi
Candle Time (MT4) The Candle Time indicator shows the remaining time for the current candle on the active chart timeframe. It adapts automatically to the chart period and updates on every tick. This is a charting utility; it does not provide trading signals and does not guarantee any profit. Main functions Display the time remaining for the current candle on any timeframe (M1 to MN). Color-coded state: green when price is above the open (up), gray when unchanged, and red when below the open (do
FREE
À propos de Range Explosion Range Explosion est un outil de trading puissant et gratuit, conçu pour détecter les zones de range du marché, tracer les supports et résistances, et identifier les opportunités de breakout avec précision. Il fait partie du projet Break Out Explosion, offrant aux traders une solution fiable et visuellement avancée, adaptée aux débutants comme aux professionnels. La version MT5 de ce produit est disponible ici : https://www.mql5.com/en/market/product/153004 Si vous êt
FREE
Lisek Weis Wave
Darius Hans Lischka
4 (4)
This Weis Wave Volume indicator is a tool to help traders identify the current price trend.  Understanding volume can provide insight into a market's behavior to help you determine its overall health. The most important rule is this: volume precedes price. Typically, before a market price moves, volume comes into play. It has 2 main colors histogram which are green and red. – Green indicates an upward wave. The more the price increases, the bigger the green volume gets. – The red color shows a d
FREE
Triple RSI
Pablo Leonardo Spata
1 (1)
LOOK AT THE FOLLOWING STRATEGY WITH THIS INDICATOR. Triple RSI is a tool that uses the classic Relative Strength Indicator, but in several timeframes to find market reversals.    1.  ️ Idea behind the indicator and its strategy: In Trading, be it Forex or any other asset, the ideal is to keep it simple, the simpler the better . The triple RSI strategy is one of the simple strategies that seek market returns. In our experience, where there is more money to always be won, is in the marke
FREE
Market Profile 3
Hussien Abdeltwab Hussien Ryad
3 (2)
Market Profile 3 MetaTrader 4 indicator  — is a classic Market Profile implementation that can show the price density over time, outlining the most important price levels, value area, and control value of a given trading session. This indicator can be attached to timeframes between M1 and D1 and will show the Market Profile for daily, weekly, monthly, or even intraday sessions. Lower timeframes offer higher precision. Higher timeframes are recommended for better visibility. It is also possible t
FREE
Forex Market Profile and Vwap
Lorentzos Roussos
4.86 (7)
Profil du marché Forex (FMP en abrégé) Ce que ce n'est pas : FMP n'est pas l'affichage TPO classique à code alphabétique, n'affiche pas le calcul global du profil de données du graphique et ne segmente pas le graphique en périodes et ne les calcule pas. Ce qu'il fait : Plus important encore, l'indicateur FMP traitera les données situées entre le bord gauche du spectre défini par l'utilisateur et le bord droit du spectre défini par l'utilisateur. L'utilisateur peut définir le spectre en tiran
FREE
UPD1 Watermark MT4
Vitaliy Kuznetsov
5 (2)
L'indicateur affiche n'importe quel texte et n'importe quelle image sur le graphique, et peut également afficher des informations demandées par des macros. Il existe trois blocs de texte et un bloc pour les images. La sélection de la police, la taille, la couleur, l'indentation et le positionnement sont disponibles. Si vous souhaitez marquer vos captures d'écran ou afficher les informations requises sur un graphique, UPD1 Watermark sera un outil très utile. Description des paramètres. Paramèt
FREE
Les acheteurs de ce produit ont également acheté
Trend SniperX MT4
Sarvarbek Abduvoxobov
5 (5)
Trend Sniper X est un indicateur de suivi de tendance multi-temporalité pour MetaTrader 5 qui aide les traders à identifier la direction de la tendance et les points de retournement potentiels avec clarté et précision. Pour MT5 : https://www.mql5.com/en/market/product/181101 Information sur le prix : Le prix actuel est une offre promotionnelle et peut évoluer au fur et à mesure de la sortie des prochaines mises à jour et nouvelles fonctionnalités. Canal Code2Profit Maîtrisez le marché grâce à l'
Scalper Vault
Oleg Rodin
5 (40)
Scalper Vault est un système de trading puissant et complet, conçu pour les traders en quête de régularité dans le cadre du trading intrajournalier. Cet indicateur de haute précision constitue un système de trading autonome et exhaustif, offrant des analyses de qualité institutionnelle, aussi bien pour le Forex que pour les options binaires. VEUILLEZ ME CONTACTER APRÈS VOTRE ACHAT POUR OBTENIR MES CONSEILS DE TRADING AINSI QU'UN EXCELLENT BONUS ! En éliminant les incertitudes et les analyses ma
Currency Strength Wizard est un indicateur très puissant qui vous offre une solution tout-en-un pour un trading réussi. L'indicateur calcule la puissance de telle ou telle paire de devises en utilisant les données de toutes les devises sur plusieurs périodes. Ces données sont représentées sous la forme d'un indice de devise facile à utiliser et de lignes électriques de devise que vous pouvez utiliser pour voir la puissance de telle ou telle devise. Tout ce dont vous avez besoin est d'attacher l'
Le système PRO Renko est un système de trading très précis spécialement conçu pour le trading de graphiques RENKO. Il s'agit d'un système universel qui peut être appliqué à divers instruments de négociation. Le système neutralise efficacement ce qu'on appelle le bruit du marché en vous donnant accès à des signaux d'inversion précis. L'indicateur est très facile à utiliser et n'a qu'un seul paramètre responsable de la génération du signal. Vous pouvez facilement adapter l'outil à n'importe que
SR Liquidity
Oleg Rodin
5 (2)
SR Liquidity est un indicateur de trading conçu pour révéler les zones cachées où se concentre la liquidité du marché et où le prix réagit avec le plus d'intensité. Ces zones de liquidité spécifiques agissent comme de puissants niveaux de support et de résistance, vous offrant une cartographie claire des points où le marché est le plus susceptible de se retourner. Plutôt que de tracer des lignes de support et de résistance classiques, l'indicateur SR Liquidity analyse le comportement réel des pr
Zoryk Gold mt4
Reda El Koutbane
5 (3)
ZORYK — Système avancé de signaux et de planification pour XAUUSD sur MetaTrader 4 Vous connaissez probablement cette situation. Vous analysez l’or, attendez l’entrée, puis ouvrez enfin la position. Le prix part immédiatement contre vous. Vous fermez trop tôt, déplacez le Stop Loss ou hésitez quelques secondes. Peu après, le marché atteint exactement la direction et l’objectif que vous aviez prévus, mais sans vous. Le problème n’était pas toujours la direction. Le véritable problème était l
Atomic Analyst
Issam Kassas
5 (14)
Atomic Analyst — MetaTrader 4 Pour toute question sur le produit, sa configuration ou le support technique, envoyez-moi un message directement ici sur MQL5. L’indicateur transforme des calculs complexes du marché en signaux visuels simples, bougies colorées, lectures de tendance, niveaux de stop-loss et plusieurs zones de take-profit que les traders peuvent comprendre rapidement et utiliser dans des conditions réelles de marché. Principales utilisations de trading : Scalping et trading intraday
Smart Trend Trading System est un indicateur pour MetaTrader 4 qui réunit les informations de tendance, les signaux d’entrée et de sortie et les niveaux de prix sur un même graphique. Il combine plus de 10 outils de trading en un seul système, incluant la détection de tendance, les zones de retournement, Smart Cloud, la logique de trailing stop, le support et la résistance, la coloration des bougies, les alertes et l’analyse multi-timeframe. Le système est conçu pour vous aider à trader différen
SIO Oscillator : oscillateur auto-optimisé de déséquilibre de semi-variance Achetez l’indicateur et recevez GRATUITEMENT l’Expert Advisor (EA) basé sur celui-ci. La plupart des oscillateurs traitent tous les mouvements de prix de la même manière. SIO sépare la pression haussière de la pression baissière et mesure le déséquilibre entre les deux, montrant quel camp contrôle réellement le marché : les acheteurs ou les vendeurs. Lorsque le déséquilibre atteint un extrême, SIO génère un signal clair
Quant Direction
Georgios Kalomoiropoulos
Quant Direction est un outil d'analyse de marché 3D. Il fournit une analyse de marché parfaitement objective, basée sur un algorithme, en calculant des écarts précis en pourcentage sur différents paramètres. Développé à l'aide d'outils de modélisation avancés basés sur l'IA et soumis à des tests rigoureux, cet algorithme analyse le marché avec une précision inégalée. Vous pouvez analyser n'importe quelle paire de devises ou instrument financier sur la plateforme. Que vous pratiquiez le trading à
Trend Lines PRO
Roman Podpora
5 (2)
TREND LINES PRO     Cet indicateur permet de comprendre les véritables changements de direction du marché. Il révèle les renversements de tendance et les points de retour des principaux acteurs. Tu vois     Lignes BOS     Détection des changements de tendance et des niveaux clés sur des unités de temps supérieures, sans paramètres complexes ni interférences inutiles. Les signaux restent affichés sur le graphique même après la fermeture de la bougie. VERSION MT 5    -     Révèle son potentiel max
AW Prime Oscillator
AW Trading Software Limited
5 (1)
Une combinaison de deux oscillateurs. Le premier affiche les points d'entrée, le second montre la tendance actuelle. L'indicateur peut afficher les signaux d'oscillateur par des flèches dans deux modes, tous les signaux d'oscillateur rapides ou les signaux uniquement dans la direction de la tendance actuelle. Il dispose d'un panneau multi-périodes et de trois types de notifications de signal. Avantages: Convient au day trading et au scalping Filtrage des tendances Configuration simple et sensibl
M1 Sniper
Oleg Rodin
4.97 (30)
M1 SNIPER est un système d'indicateurs de trading facile à utiliser. Il s'agit d'un indicateur à flèche conçu pour l'unité de temps M1. Cet indicateur peut être utilisé seul pour le scalping sur l'unité de temps M1 ou intégré à votre système de trading existant. Bien que conçu spécifiquement pour le trading sur l'unité de temps M1, ce système peut également être utilisé avec d'autres unités de temps. Initialement, j'avais conçu cette méthode pour le trading du XAUUSD et du BTCUSD. Cependant, je
Hidden Cycles
Lev Vladimirovic Marushkin
5 (1)
The Only 100% Universal Tool! Stop trading against nature! This is your chance to secure the only indicator rooted in the absolute laws that govern the entire universe. Most tools guess—this one reveals the truth. Buy another toy or buy the truth. Your choice... Based on Universal Laws — NOT Some Guy’s Algorithm: Let the market adjust to the Hidden Cycles Geometry — not the other way around. Most indicators are based on a man-made formula. They often lag, fail over time, or need constant re-o
Neo Wave PRO
Nikolay Raykov
5 (1)
Price & Time Market Structure Indicator A professional market structure tool that analyzes waves through both price and time — not price alone. Main Description NeoWave PRO is a professional market structure indicator for MetaTrader 4 designed for traders who want to move beyond traditional one-dimensional wave tools such as ZigZag, swing indicators, and basic high/low systems. Most wave indicators analyze only one thing: Price. But a real market wave is not only a price movement. A true wave de
Identify key turning points with reliable fractal analysis This indicator examines the price structure of fractals of different periods to determine possible reversal points in the market, providing timing to positional traders that already have a fundamental or technical valuation model. Unlike its younger brother, Reversal Fractals , this indicator won't miss reversals because of the period selected, and will find reversal fractals on a zig-zag fashion, ignoring those reversals which do not
CRT Multi-Timeframe Market Structure & Liquidity Sweep Indicator Non-Repainting | Multi-Asset | MT5 Version Available MT5 Version:   https://www.mql5.com/en/market/product/162075 Full User Guide — explains what each feature does and why:   https://www.mql5.com/en/blogs/post/767525 Quick Start User Guide  — explains how to configure and in what order:  https://www.mql5.com/en/blogs/post/767540 Indicator Overview CRT Ghost Candle HTF Fractal is a complete institutional-grade market structure too
Gann Time Clusters
Martin Eshleman
2.5 (2)
Gann Time Clusters Indicator This indicator is based on W. D. Gann's Square of 9 method for the time axis. It uses past market reversal points and applies the mathematical formula for Gann's Square of 9 and then makes projections into the future. A date/time where future projections line up is called a 'time cluster'. These time clusters are drawn as vertical lines on the right side of the chart where the market has not advanced to yet. A time cluster will result in a market reversal point (ex.
Neuro Poseidon MT4
Daria Rezueva
4.74 (46)
Neuro Poseidon is a new indicator by Daria Rezueva. It combines precise trading signals with adaptive TP/SL levels - creating best possible trades as a result! Message me and get  Neuro Poseidon Assistant  as a gift to automize your trading process! What makes it stand out? 1. Proven profitability on all assets and timeframes 2. Only confirmed BUY and SELL signals present on the chart 3. Adaptive TP & SL levels generated by the software for each trade 4. Easy to understand - suitable for all
Non repaint MT4
Yan Zhen Du
5 (1)
This is a professional chart indicator designed for traders focused on stability and clear price action. It helps filter market noise and provides clear visual entry and exit zones for your trading decisions. Core Features: Strictly Non-Repainting: The system is built with strict non-repaint logic. What you see on the chart is the true historical performance. Confirmed Signals: Signals are triggered and confirmed only after the candle closes . Once a trading arrow appears on a closed candle, it
Forex Breath System est un système de trading basé sur les tendances qui peut être utilisé sur n'importe quel marché. Vous pouvez utiliser ce système avec des devises, des métaux, des matières premières, des indices, des cryptomonnaies et même des actions. Il peut également être utilisé à tout moment. Le système est universel. Il montre la tendance et fournit des signaux fléchés avec la tendance. L'indicateur peut également vous fournir un type spécial d'alertes lorsque les signaux apparaissent
Advanced Supply Demand
Bernhard Schweigert
4.91 (302)
Offre spéciale : 30 % de réduction La solution idéale pour les traders débutants comme experts ! Cet indicateur est un outil de trading unique, performant et abordable grâce à l’intégration de nombreuses fonctionnalités exclusives et d’une nouvelle formule. Cette mise à jour vous permet d’afficher des zones sur deux unités de temps. Vous pourrez ainsi visualiser non seulement une unité de temps supérieure, mais aussi l’unité de temps du graphique, ainsi que l’unité de temps supérieure : des z
Super Signal – Skyblade Edition Système de signaux de tendance professionnel sans repaint / sans latence, avec un taux de réussite exceptionnel | Pour MT4 / MT5 Il fonctionne mieux sur des unités de temps inférieures, comme 1 minute, 5 minutes et 15 minutes. Caractéristiques principales : Super Signal – Skyblade Edition est un système de signaux intelligent conçu spécifiquement pour le trading de tendance. Il utilise une logique de filtrage multicouche pour détecter uniquement les mouvements d

Liquidity Scalper System : un système de trading basé sur la liquidité au format indicateur. La plupart des indicateurs n'affichent qu'une flèche, puis le trader décide seul où placer le stop, où se trouve l'objectif et s'il peut faire confiance au signal. Liquidity Scalper System couvre tout le cycle du trade : il trouve les pools de liquidité, donne un signal lors de leur cassure, calcule immédiatement Entry, Stop Loss et trois objectifs, et affiche sur le panneau les statistiques et les résu
Tokyo mt4 Indicator
Vasiliy Strukov
5 (9)
Le Tokyo Indicator offre une vue d'ensemble visuelle et claire de l'orientation de la tendance, des signaux de trading potentiels et des conditions du marché. Sa ligne de tendance en escalier, codée par couleur, distingue les phases haussières (en bleu) des phases baissières (en magenta). Des flèches directionnelles associées mettent en évidence les opportunités d'achat et de vente potentielles lors des changements de tendance. Un tableau de bord intégré regroupe le signal actuel, l'orientation
Gann Made Easy
Oleg Rodin
4.84 (174)
Gann Made Easy est un système de trading Forex professionnel et facile à utiliser qui est basé sur les meilleurs principes de trading en utilisant la théorie de mr. WD Gann. L'indicateur fournit des signaux d'ACHAT et de VENTE précis, y compris les niveaux Stop Loss et Take Profit. Vous pouvez échanger même en déplacement en utilisant les notifications PUSH. VEUILLEZ ME CONTACTER APRÈS L'ACHAT POUR RECEVOIR GRATUITEMENT DES INSTRUCTIONS DE TRADING ET D'EXCELLENTS INDICATEURS SUPPLÉMENTAIRES! Vou
Break and Retest Hunter MT4 is a powerful MetaTrader 5 indicator designed to automatically identify support and resistance levels, breakout structures, and potential retest opportunities in real time. Bonus Indicator: After purchasing Break and Retest Hunter , contact me to receive Trade Indicator Assistant EA completely free as a bonus utility. $65 for the next 10 copies . Next price is $120.  Combining adaptive market analysis, clear BUY/SELL signals, Fibonacci-based profit targets, and a pre
ACTUELLEMENT 40% DE RÉDUCTION La meilleure solution pour tout débutant ou trader expert ! Cet indicateur est un outil de trading unique, de haute qualité et abordable car nous avons incorporé un certain nombre de caractéristiques exclusives et une nouvelle formule. Avec seulement UN graphique, vous pouvez lire la force de la devise pour 28 paires Forex ! Imaginez comment votre trading va s'améliorer parce que vous êtes capable de repérer le point de déclenchement exact d'une nouvelle tendance
Gold Channel is a volatility-based indicator, developed with a specific timing algorithm for the XAUUSD pair, which consists of finding possible corrections in the market. This indicator shows two outer lines, an inner line (retracement line) and an arrow sign, where the theory of the channel is to help identify overbought and oversold conditions in the market. The market price will generally fall between the boundaries of the channel. If prices touch or move outside the channel it is a tradi
Actuellement 30% de réduction ! La meilleure solution pour tout débutant ou trader expert ! Ce logiciel de tableau de bord fonctionne sur 28 paires de devises. Il est basé sur 2 de nos principaux indicateurs (Advanced Currency Strength 28 et Advanced Currency Impulse). Il donne un excellent aperçu de l'ensemble du marché Forex. Il montre les valeurs de l'Advanced Currency Strength, la vitesse de mouvement des devises et les signaux pour 28 paires de devises dans tous les (9) délais. Imaginez
Plus de l'auteur
Anchored VWAP (AVWAP) for MT4 – Ultimate Drag & Drop Volume-Weighted Average Price Indicator Unlock true institutional volume analysis with the definitive Anchored VWAP (AVWAP) indicator designed specifically for MetaTrader 4. Featuring a fully interactive, draggable vertical line right on your chart, this tool lets you anchor your volume-weighted calculations to any significant market event instantly. Simply click and drag the anchor line to any swing low, swing high, market structure shift,
FREE
Gartley Patterns
Jeffrey Lloyd Lauzon
Gartley Patterns (Harmonic Scanner) Gartley Patterns is an institutional-grade technical overlay engineered to automatically map complex harmonic price structures and swing imbalances across active execution cycles. By processing market geometry dynamically through strict multi-timeframe swing filters, this utility completely eliminates manual calculation errors and gives traders an instant visual panel of high-probability reversal zones on a single chart window. Utilizing specialized sing
FREE
Fast VWAP
Jeffrey Lloyd Lauzon
Fast VWAP  (Highly Optimized Intraday Dashboard) The Fast VWAP Matrix is an institutional-grade technical overlay designed to isolate volume-weighted fair value and intraday structural balance across active execution cycles. By processing price action dynamically through volume-weighting thresholds, this utility completely eliminates calculation delay and gives traders an instant visual panel of asset distribution on a single window. Utilizing specialized single-pass memory arrays, this matrix
FREE
EMA Trend Trader
Jeffrey Lloyd Lauzon
The EMA Trader System is a technical overlay designed to isolate trend continuation and structural balance across active execution cycles. By processing price action dynamically through multi-timeframe moving average thresholds and robust slope filters, this utility completely eliminates calculation delay and gives traders an instant visual HUD dashboard of live trade signals on a single window. Utilizing specialized single-pass memory arrays, this system tracks multi-period EMA loops and highe
FREE
Dual Slope Moving Averages & Support | Resistance Dashboard Professional Institutional-Grade Indicator for MetaTrader 4 (MT4) Transform your chart analysis with Trend Bars With Moving Averages, an elite institutional utility engineered by a professional C++ systems programmer. Designed for high-speed MQL4 execution, this indicator blends multi-slope Moving Average color-coding with a built-in, interactive Support & Resistance Reversal Dashboard. Whether you trade Forex majors or index futures,
FREE
CCI Trend Monitor
Jeffrey Lloyd Lauzon
MTF Commodity Channel Index (CCI) Matrix (Free Advanced Trend Scanner Dashboard) The Multi-Timeframe Commodity Channel Index (CCI) Matrix is an institutional-grade technical scanner designed to evaluate cyclical trend momentum and structural threshold breakouts across 4 distinct execution timeframes simultaneously[cite: 18, 19]. By monitoring the M15, H1, H4, and D1 intervals concurrently[cite: 18, 19], this utility completely eliminates multi-chart cluttering and gives traders an instant execu
FREE
MTF DeMarker Exhaustion Matrix (Free Advanced Exhaustion Dashboard) The Multi-Timeframe DeMarker Exhaustion Matrix is an institutional-grade technical scanner designed to isolate subtle price exhaustion zones and impending market reversals across multiple execution cycles simultaneously. By monitoring the M15, H1, H4, and D1 intervals concurrently[cite: 4], this utility completely eliminates multi-chart cluttering and gives traders an instant executive matrix of trend exhaustion and structural
FREE
MTF Rate of Change (ROC) Matrix (Free Advanced Price Velocity Dashboard) The Multi-Timeframe Rate of Change (ROC) Matrix is an institutional-grade technical scanner designed to evaluate pure historical price velocity across 4 distinct execution timeframes simultaneously. By monitoring the M15, H1, H4, and D1 intervals concurrently[cite: 18], this utility completely eliminates multi-chart cluttering and gives traders an instant executive matrix of momentum acceleration and structural trend force
FREE
MTF Ultimate Oscillator Matrix (Free Advanced Multi-Timeframe Dashboard) The Multi-Timeframe Ultimate Oscillator Matrix is an institutional-grade technical scanner designed to evaluate momentum convergence across three distinct lookback horizons on four execution timeframes simultaneously. By monitoring the M15, H1, H4, and D1 intervals concurrently, this utility completely eliminates multi-chart cluttering and gives traders an instant executive matrix of weighted momentum expansion and overbou
FREE
Master Trading Matrix (Free Advanced Multi-Indicator Dashboard) The Master Trading Matrix is an institutional-grade technical convergence scanner designed to combine 10 foundational momentum, trend, and exhaustion engines into a single, unified execution display. By integrating RSI, Stochastic, CCI, Williams %R, DeMarker, Momentum, RVI, Chande Momentum, Rate of Change, and Ultimate Oscillator into an executive matrix, this utility eliminates multi-window clutter and provides a complete, real-ti
FREE
RSI Monitors
Jeffrey Lloyd Lauzon
MTF Relative Strength Index (RSI) Matrix (Free Advanced Momentum Dashboard) The Multi-Timeframe Relative Strength Index (RSI) Matrix is an institutional-grade technical scanner designed to evaluate momentum and overbought/oversold conditions across 4 distinct execution timeframes simultaneously[cite: 5, 6]. By monitoring the M15, H1, H4, and D1 intervals concurrently[cite: 5, 6], this utility completely eliminates multi-chart cluttering and gives traders an instant executive matrix of momentum
FREE
CMO Monitor
Jeffrey Lloyd Lauzon
MTF Chande Momentum Matrix (Free Advanced Momentum Dashboard) The Multi-Timeframe Chande Momentum Matrix is an institutional-grade technical scanner designed to isolate raw market momentum and structural exhaustion across multiple execution cycles simultaneously. By monitoring the M15, H1, H4, and D1 intervals concurrently, this utility completely eliminates multi-chart cluttering and gives traders an instant executive matrix of trend structural health on a single window. Unlike common smoothe
FREE
MTF Momentum Oscillator Matrix (Free Advanced Velocity Dashboard) The Multi-Timeframe Momentum Oscillator Matrix is an institutional-grade technical scanner designed to map out the velocity of price change across clean rolling history blocks simultaneously. By monitoring the M15, H1, H4, and D1 intervals concurrently, this utility completely eliminates multi-chart cluttering and gives traders an instant executive matrix of trend speed and directional acceleration on a single window. Instead of
FREE
RVI Monitor
Jeffrey Lloyd Lauzon
MTF Relative Vigor Index (RVI) Matrix (Free Advanced Trend Health Dashboard) The Multi-Timeframe Relative Vigor Index (RVI) Matrix is an institutional-grade technical scanner designed to evaluate directional trend vigor and conviction across 4 distinct execution timeframes simultaneously[cite: 10, 11]. By monitoring the M15, H1, H4, and D1 intervals concurrently[cite: 10, 11], this utility completely eliminates multi-chart cluttering and gives traders an instant executive matrix of trend health
FREE
Stochastic Monitor
Jeffrey Lloyd Lauzon
MTF Stochastic Matrix (Free Advanced Momentum Crossover Dashboard) The Multi-Timeframe Stochastic Matrix is an institutional-grade technical scanner designed to evaluate momentum cycles, %K/%D line crossovers, and extreme overbought/oversold boundaries across 4 distinct execution timeframes simultaneously[cite: 14, 15]. By monitoring the M15, H1, H4, and D1 intervals concurrently[cite: 14, 15], this utility completely eliminates multi-chart cluttering and gives traders an instant executive matr
FREE
MTF Simple Moving Average (Free Institutional Moving Average Overlay) The Multi-Timeframe Simple Moving Average (MTF SMA) is an institutional-grade technical utility designed to project higher-timeframe trend baselines directly onto your lower-timeframe execution charts. Developed by a C++ systems programmer specializing in high-speed MQL4 architecture, this indicator provides traders with seamless market structure visibility without requiring multiple open windows or manual chart toggling.
FREE
Williams Monitor
Jeffrey Lloyd Lauzon
MTF Williams %R Matrix (Free Advanced Multi-Timeframe Dashboard) The Multi-Timeframe Williams %R Matrix is an institutional-grade technical scanner designed to evaluate momentum extremes and key boundary dynamics across four execution timeframes simultaneously[cite: 5, 6]. By monitoring the M15, H1, H4, and D1 intervals concurrently, this utility completely eliminates multi-chart cluttering and gives traders an instant executive matrix of price relative to recent high-low ranges on a single win
FREE
Filtrer:
Aucun avis
Répondre à l'avis