Bat Patterns

  • 지표
  • Jeffrey Lloyd Lauzon
    Jeffrey Lloyd Lauzon
    Welcome to themt4developer!
    I am a C++ systems programmer and specialized MQL4 developer focused on building professional-grade trading utilities, custom indicators, automated Expert Advisors, and advanced chart dashboards for MetaTrader.
  • 버전: 1.0
Bat Patterns (Harmonic Scanner)

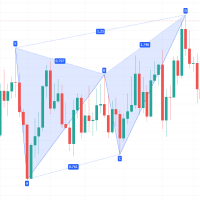
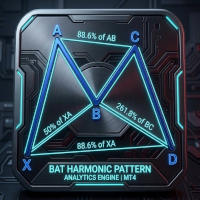
Bat Patterns is an institutional-grade technical overlay engineered to automatically map complex harmonic price structures and swing imbalances across active execution cycles. By processing market geometry dynamically through strict multi-timeframe swing filters, this utility completely eliminates manual calculation errors and gives traders an instant visual panel of high-probability reversal zones on a single chart window.

Utilizing specialized single-pass pattern recognition logic, this indicator tracks structural pivot points relative to custom history depth windows. It transforms complex Fibonacci weighting metrics into clean visual states, helping traders spot precise institutional entry and risk parameters long before standard indicators react.

Core Technical Features

- Dual-Engine Pattern Recognition: Automatically identifies and processes both Bullish and Bearish institutional Bat structures.
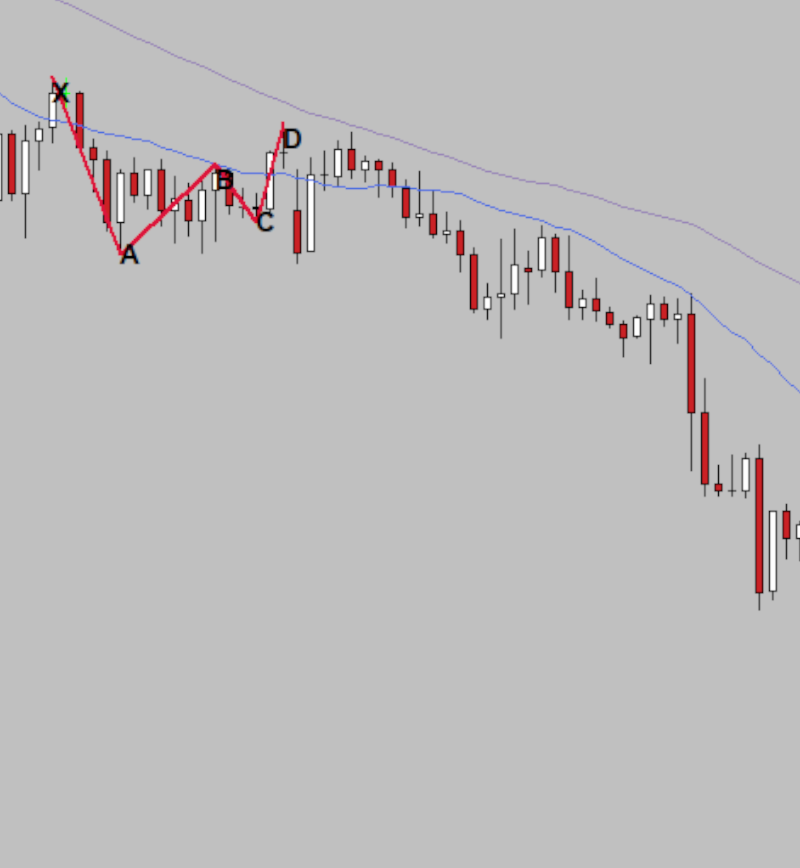
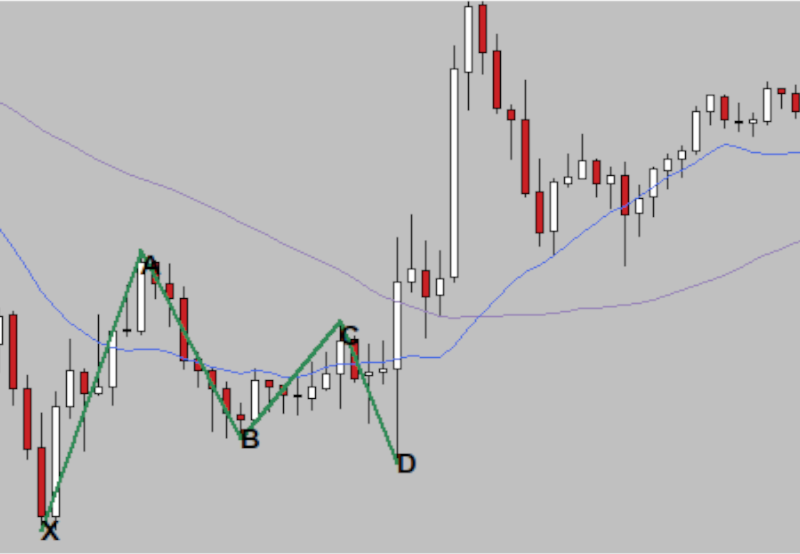
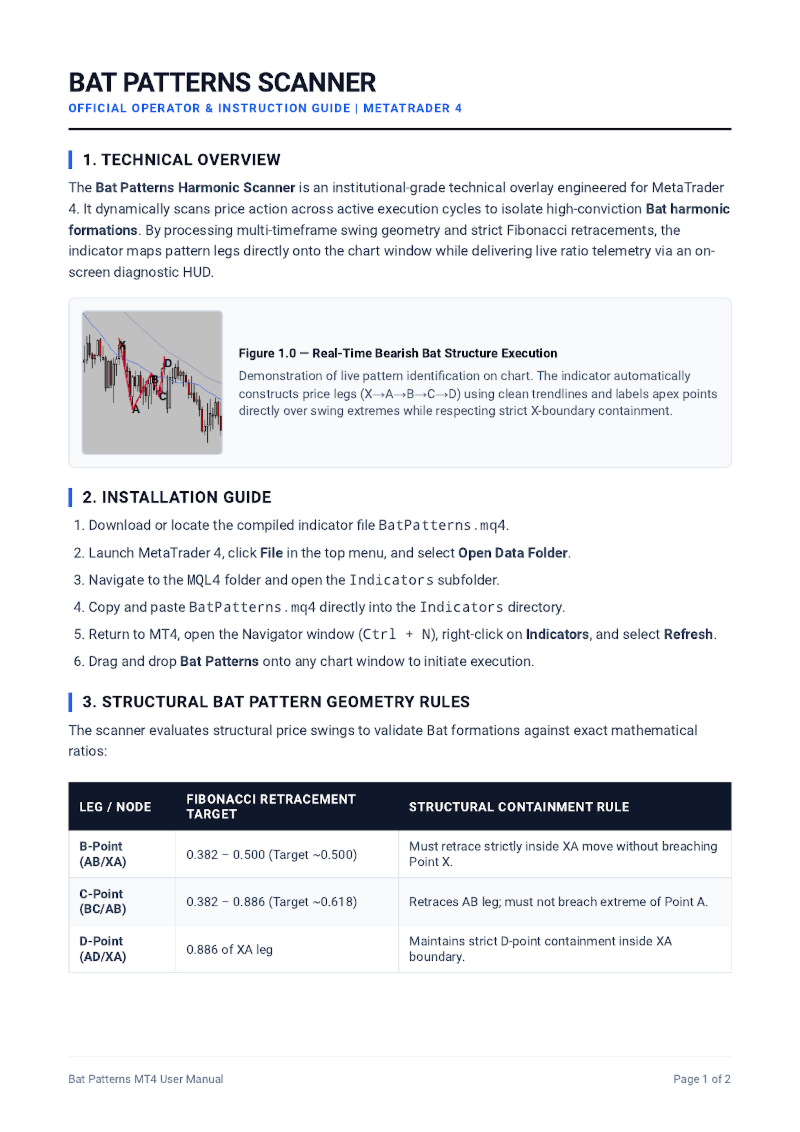
- Strict Harmonic Tolerance Band: Utilizes precision Fibonacci ratio verification (B point retrace 0.382-0.50, C point retrace 0.382-0.886, and D point completion ~0.886 of XA) to filter out false formations and isolate high-conviction setups.
- Intuitive Color-Coded State Machine: Instantly adapts indicator rendering and trendline legs to contrast flawlessly with the main chart workspace using customizable input colors (SeaGreen for Bullish, Crimson for Bearish).
- Actionable Value Panel Output: Translates active pattern ratios into explicit metric readouts configured down to the fractional decimal.
- Institutional Solid Workspace Panel: Includes dynamic object mapping that outlines structural legs and apex labels cleanly on a sleek, modern layout.
- Zero Terminal Lag / High Performance Architecture: Engineered with an optimized single-pass loop execution that runs smoothly, completely avoiding terminal lag during high-frequency execution.

Interactive Status & Interpretation Logic

The indicator tracks real-time data calculations and formats the active pattern readout based on asset decimal precision automatically:

- Dynamic Geometric Plotting: Draws chronological trendline legs directly across asset swings to serve as exact mean-reversion and reversal zones.
- Labeled Apex Matrix: Formats and displays structural coordinate strings (X, A, B, C, D) explicitly across pivot points utilizing clean typography standards.
- Clean Object Management: Employs automated clean-up logic that removes outdated graphical objects seamlessly when scanning new historical data.

Adjustable Input Parameters

Tailor the calculation matrix completely to your personalized risk strategy directly through the input dashboard:

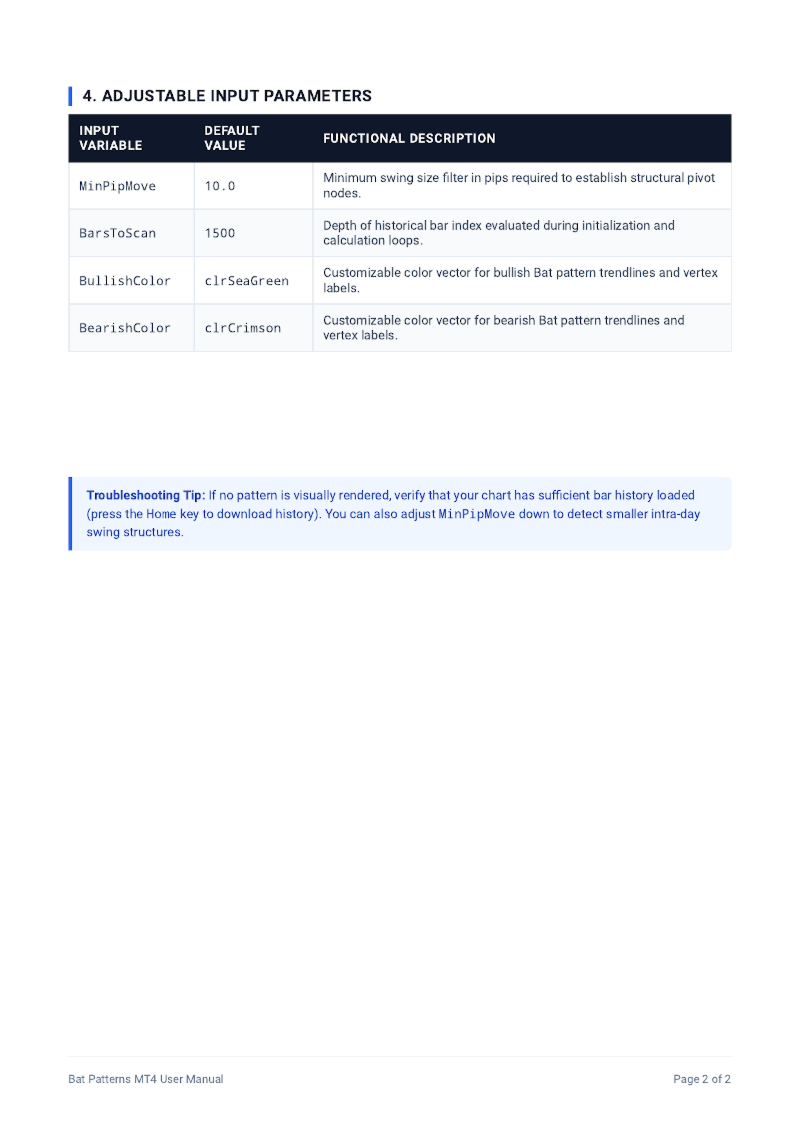
- MinPipMove (Default: 10.0): Adjusts the minimum swing size filter in pips to screen out market noise.
- BarsToScan (Default: 1500): Modifies the history depth scanner window for performance tuning.
- BullishColor (Default: SeaGreen): Customizes the line color for bullish Bat formations.
- BearishColor (Default: Crimson): Customizes the line color for bearish Bat formations.

추천 제품
Gartley Patterns
Jeffrey Lloyd Lauzon
Gartley Patterns (Harmonic Scanner) Gartley Patterns is an institutional-grade technical overlay engineered to automatically map complex harmonic price structures and swing imbalances across active execution cycles. By processing market geometry dynamically through strict multi-timeframe swing filters, this utility completely eliminates manual calculation errors and gives traders an instant visual panel of high-probability reversal zones on a single chart window. Utilizing specialized sing
FREE
Adaptive Volume Profile
Volodymyr Lytvyniuk
Adaptive Volume Profile 최근 봉의 볼륨 프로파일(Volume Profile)을 차트 위에 바로 그립니다: 컨트롤 포인트(POC), 가치 영역(VAH / VAL), 고거래량 노드(HVN), 저거래량 노드(LVN), 그리고 선택 가능한 거래량 히스토그램. 가격 행의 크기가 현재 변동성(ATR)에 맞게 조정되므로, 어떤 종목과 시간대에서도 프로파일이 읽기 쉽게 유지됩니다. 주요 기능 POC - 창 안에서 거래량이 가장 많은 가격 수준 Value Area (VAH / VAL) - 선택한 비율의 거래량을 포함하는 가격 범위(기본 70%) HVN / LVN - 고거래량·저거래량 노드(가격이 정체되거나 빠르게 움직이는 경향이 있는 수준)로, 프로파일의 평균 거래량을 기준으로 통계적으로 판별합니다. 인접한 행은 하나의 구간으로 병합되어 차트가 깔끔하게 유지됩니다 적응형 행 너비 - 가격 행은 ATR로 크기가 정해지며 최대 행 수로 제한됩니다 실시간 롤링 프로파일 - 새 봉마다
FREE
Major Support and Resistance Indicator
Ahmad Ar Abedalaziz Alazaizeh
This indicator filters the Zigzag indicator to calculate the main support and resistance levels. Variables minimum gap between peaks : is the distance (GAP) between the peaks of the Zigzag peaks sensitivity : Minimum number of nearby peaks look back: it means that it has to test the last 50 peaks in the Zigzag object name perfix: a prefix for level’s line name on chart
FREE
Multi Spread Hunter Info
Alessandro Michele Ventrella
Scanner a diffusione Spread Scanner è uno strumento di monitoraggio multi-simbolo elegante, professionale e ad alte prestazioni, progettato per MetaTrader 4 (MT4). Consente ai trader di tracciare e confrontare in tempo reale gli spread su 10 strumenti di trading personalizzabili simultaneamente, direttamente da un'interfaccia HUD intuitiva sul grafico. Che si tratti di operare sulle principali coppie di valute Forex, sui metalli preziosi o sugli indici, sapere dove le condizioni di esecuzione so
FREE
After purchasing the Tpx Dash Supply Demand indicator, you must download this indicator which will link and feed market data to the Tpx Dash Supply Demand indicator and will provide all Supply Demand price signals, ATR Stop, VAH and VAL, trend values ​​with the ADX, and POC prices and locations in the market. Just download it and Dash will locate the indicator to retrieve the information!
FREE
External Bar
Georgi Gaydarov
Simple indicator that shows external ( outside ) bars. In certain cases, external bars can be seen as strong trend bars instead of range bars. This can be observed when a with-trend external bar occurs at a reversal from a strong trend. It will help you notice more easily different patterns like - Inside-outside-inside, Inside- Inside -inside, outside - Inside -outside, etc. Works perfectly with my other free indicators Internal bar and Shadows Inputs: How many history bars to calculate on loa
FREE
Qzones
Vinutthapon Bumroong
Quantific Structure Zone is a technical indicator designed for Price Action and SMC traders. It maps the market structure and identifies dynamic supply and demand zones on the chart. Built with a non-repainting algorithm, it provides signals upon confirmed candle closes, making it suitable for live trading and backtesting. The indicator highlights market swings and price levels. Features Automated Market Structure: Identifies and labels structural swing points with HH (Higher High), HL (Higher
FREE
Multi Timeframe ZigZag Indicator
Salman A A A T Bakhash
5 (2)
Description: This indicator draw ZigZag Line in multiple time frame also search for Harmonic patterns before completion of the pattern. Features: Five instances of ZigZag indicators can be configured to any desired timeframe and inputs. Draw Harmonic pattern before pattern completion. Display Fibonacci retracement ratios. Configurable Fibonacci retracement ratios. Draw AB=CD based on Fibonacci retracement you define. You can define margin of error allowed in Harmonic or Fibonacci calculations
FREE
Volume By Color RSJ는 거래량이 자체 이동평균보다 높을 때 거래량 막대를 더 진한 색으로 표시하여, 이례적인 거래 활동이 있는 캔들이 눈에 띄도록 합니다. 선택 가능한 4색 모드는 각 캔들의 거래량 강도를 단계별로 보여줍니다. 기본적으로 각 막대를 거래량의 20기간 단순 이동평균과 비교합니다. 평균 유형과 기간은 입력 파라미터에서 변경할 수 있습니다. 사용 방법 색상으로 구분된 막대를 통해 평소보다 많은 거래량과 함께 발생한 돌파, 되밀림, 클라이맥스 캔들을 쉽게 찾을 수 있습니다. 높은 거래량으로 레벨을 돌파하는 캔들은 해당 움직임에 대한 참여를 보여주며, 낮은 거래량의 돌파는 관심이 적다는 것을 보여줍니다. 4색 모드에서는 각 색상이 평균 대비 거래량 강도의 범위를 나타내며, 약함부터 매우 강함까지 구분됩니다. 이 지표는 별도 창에 표시되며 모든 종목과 타임프레임에서 작동합니다. 이 지표가 유용하다면 리뷰를 남겨 주세요. 다른 트레이더들이 이 지표를 찾는 데 도움이
FREE
SX Supply Demand Zones accurately identifies and draws high-probability Supply and Demand zones using a sophisticated algorithm. Unlike traditional indicators that clutter your chart, this indicator is designed with a focus on performance and a clean user experience. New Unique Feature: Interactive Legend System What truly sets this indicator apart from everything else is the Interactive Control Legend. You have a professional dashboard directly on your chart that allows you to: Show/Hide: Ins
FREE
MASi Three Screens
Aleksey Terentev
5 (2)
MASi Three Screens is based on the trading strategy by Dr. Alexander Elder. This indicator is a collection of algorithms. Algorithms are based on the analysis of charts of several timeframes. You can apply any of the provided algorithms. List of versions of algorithms:     ThreeScreens v1.0 - A simple implementation, with analysis of the MACD line;     ThreeScreens v1.1 - A simple implementation, with analysis of the MACD histogram;     ThreeScreens v1.2 - Combines the first two algorithms in
FREE
MT Supply Demand
Issara Seeboonrueang
4 (4)
We provide indicators tailored to better meet your trading requirements.       >>  MT Magical  << MT Supply Demand : It is an indicator created to find supply and demand, which will be important support and resistance levels for the price.  Supply Zone   is a zone where the price has reached, it is often resisted. In other words, when the price reaches this zone, there will be more selling power to push the price back down. Demand Zone   is a zone where the price has reached, it is ofte
FREE
Simple QM Pattern
Suvashish Halder
3.33 (3)
Simple QM Pattern is a powerful and intuitive trading indicator designed to simplify the identification of the Quasimodo (QM) trading pattern. The QM pattern is widely recognized among traders for effectively signaling potential reversals by highlighting key market structures and price action formations. This indicator helps traders easily visualize the QM pattern directly on their charts, making it straightforward even for those who are new to pattern trading. Simple QM Pattern includes dynamic
FREE
RelicusRoad Trading Sessions는 MetaTrader 4와 MetaTrader 5용 거래 세션 지표로, M1, M5, M15 차트에서 Tokyo, London, New York 세션의 시작 시각을 점선 수직선으로 표시합니다. 각 세션의 시작은 오늘과 이전 평일들에 걸쳐, 해당 세션의 색으로 선, 작게 회전된 이름 라벨, 이벤트 마커로 표시됩니다. 마우스를 올리면 세션 이름과 시작 시각이 보입니다. 이 지표는 시작 시각만 표시하며 세션 범위, 겹침, 종료 시각은 음영으로 표시하지 않습니다. 작동 방식 지표는 로드될 때 브로커 서버 시간과 UTC 사이의 차이를 읽어 정시 단위로 반올림한 뒤 한 시간을 뺍니다. 그런 다음 현재 UTC 날짜에서 거슬러 올라가는 각 평일에 대해, 서버 시간으로 환산한 Tokyo 시작(23:00 UTC), London 시작(07:00 UTC), New York 시작(12:00 UTC)을 배치합니다. 토요일과 일요일은 건너뜁니다. Tokyo:
FREE
About: Get Free Scanner and example Strategies And understand detailed description here: https://www.mql5.com/en/blogs/post/759237 And also get example wrappers from above post. You can make your own wrappers if your indicators have complex conditions or for In-Built MT4 indicators. Features: - Specify your own Custom Indicator - Specify Buffer values and create Variables - Use those Variables to create your own Buy/Sell Conditions - Get Arrows Up/Down Signals - See Arrows Signals in Scanners
Aura Mini Candle Timer - Smart Interactive Edition Aura Mini Candle Timer는 차트의 공간을 최소한으로 차지하면서 다중 타임프레임(MTF)의 남은 캔들 마감 시간과 현재 캔들의 방향성을 직관적으로 표시해 주는 경량화된 타이머 지표입니다. 이 지표의 가장 큰 특징은 상호작용(Interactive)입니다. 번거롭게 지표 설정창을 열 필요 없이, 차트 위에 표시된 타이머 패널을 마우스로 클릭하는 것만으로 7개의 주요 타임프레임을 실시간으로 탐색할 수 있습니다. [주요 기능] 온차트 원클릭 타임프레임 순환 (One-Click Cycle): 타이머 패널을 클릭할 때마다 타임프레임이 M1 M5 M15 M30 H1 H4 D1 순서로 즉시 변경됩니다. 독립적인 타임프레임 추적: 현재 보고 있는 차트의 주기와 관계없이, 타이머에 설정된 특정 타임프레임의 마감 시간과 진행 방향을 독립적으로 모니터링할 수 있습니다. 캔들 방
FREE
ZigZag WaveSize MT4
Ivan Butko
4.75 (4)
ZigZag WaveSize - 파장에 대한 정보를 포인트로 추가한 수정된 표준 ZigZag 지표입니다. 특징: 최적화된 온라인 구성 로직: 레이블은 각 틱에서 처음부터 다시 그려지지 않고, 주 계산과 병렬로 작동하며, ZigZag가 새로운 선을 그리거나 업데이트할 때 마지막 레이블만 그립니다. 포인트의 또 다른 계산 모드가 추가되었습니다. 설정에서 지정된 포인트 수를 초과하면 라인이 구축됩니다. 수동 및 자동(미세 조정을 위한 계수가 있는 ATR에 의해) 가장 최근의 것부터 시작하여 색상과 두께에 따라 모든 지그재그 선을 강조 표시하는 추세선이 추가되었습니다. 2가지 색상 렌더링 모드가 추가되었습니다: 1) 표준(상단선 - 한 가지 색상, 하단선 - 다른 색상); 2) 구조적(동시에 상승 또는 하락 극단을 갖는 고전적 추세 - 단일 색상) 알림 모드 2개가 추가되었습니다: 1) 새로운 지그재그 선이 나타납니다. 2) 현재 지그재그 라인에 의한 마지막 극단의 돌파 평균 라인 크기
FREE
Necessary for traders: tools and indicators Waves automatically calculate indicators, channel trend trading Perfect trend-wave automatic calculation channel calculation , MT4 Perfect trend-wave automatic calculation channel calculation , MT5 Local Trading copying Easy And Fast Copy , MT4 Easy And Fast Copy , MT5 Local Trading copying For DEMO Easy And Fast Copy , MT4 DEMO Easy And Fast Copy , MT5 DEMO The homeopathic indicator is also called the CCI indicator. The CCI indicator was proposed
FREE
AI Channels MT4
Duc Hoan Nguyen
5 (1)
제 MT4 및 MT5 지표를 모두 무료로 받으세요 — 방법 알아보기 새 도구의 가격   은   $30   이며, 혜택은   출시 첫 주   또는   첫 3건의 구매에 적용됩니다 !  MQL5 Trading Tools 채널 : 제 MQL5 채널에 가입하여 최신 소식을 받아보세요 AI Channels 지표는 클러스터링 분석의 강력한 머신 러닝 기술인 롤링 K-평균 클러스터링 을 활용하여 실시간으로 기초 가격 트렌드에 대한 통찰을 제공합니다. 이 지표는 클러스터링된 가격 데이터를 기반으로 적응형 채널을 생성하여, 트레이더가 트렌드 방향과 시장 상황에 대한 정보를 바탕으로 결정을 내릴 수 있도록 합니다. 지표 설정에는 트레일링 스탑 옵션 도 포함되어 있어 리스크 관리에 추가적인 유연성을 제공합니다. MT5 버전 보기:     AI Channels MT5 다른 제품 보기:     모든 제품 AI Channels 지표 사용 방법 각 채널의 극단 값은 트렌드 방향을 결정하는 데 유용한 정보를
FREE
Pattern 3 Candles
Aleksandr Butkov
4.2 (5)
An Expert Advisor based on the 3 candlestick pattern. 1-SL, 2-TP, 3-OFF - 1 pulls up StopLoss. 2 pulls up TakeProfit. 3-disabled. auto SL / TP on hi-low count bars - number of bars for 1-SL, 2-TP expiration on profit - after passing N bars, TP changes expiration on loss - after N bars have passed SL to open an order + commission pips for loss expiration - the number of points for expiration on profit The rest of the settings are intuitive.
FREE
PZ Penta O MT4
PZ TRADING SLU
2.33 (3)
The Penta-O is a 6-point retracement harmonacci pattern which usually precedes big market movements. Penta-O patterns can expand and repaint quite a bit. To make things easier this indicator implements a twist: it waits for a donchian breakout in the right direction before signaling the trade. The end result is an otherwise repainting indicator with a very reliable trading signal. The donchian breakout period is entered as an input. [ Installation Guide | Update Guide | Troubleshooting | FAQ | A
FREE
False Breakout Stochastic to be used with our Elliott Wave Indicator as part of the overall strategy on trading the 5th wave. As we cannot upload multiple files, we have listed this separately. False Breakout Stochastic is best used as a confirmation tool rather than the sole signal indicator The Elliott Wave Indicator Suite is designed around a simple but effective Swing Trading Strategy. The Indicator Suite is great for Stocks, Futures and Forex trading on multiple timeframes You can find the
FREE
Smart Flow MT4
Douglas Rodrigues
Smart Flow - Institutional Aggression Tracker Smart Flow   is a powerful and intuitive indicator designed to read the true market order flow and identify zones of strong institutional aggression. Instead of guessing tops and bottoms, Smart Flow directly paints your chart's candles whenever it detects a relevant directional capital injection, making your trading decisions highly objective. Working Principle The indicator performs an advanced mathematical calculation on every candle to estimate th
FREE
Colored Candle Time
Saeed Hatam Mahmoudi
Candle Time (MT4) The Candle Time indicator shows the remaining time for the current candle on the active chart timeframe. It adapts automatically to the chart period and updates on every tick. This is a charting utility; it does not provide trading signals and does not guarantee any profit. Main functions Display the time remaining for the current candle on any timeframe (M1 to MN). Color-coded state: green when price is above the open (up), gray when unchanged, and red when below the open (do
FREE
Range Explosion 소개 Range Explosion은 시장 범위를 감지하고, 정확한 지지선과 저항선을 그리며, 돌파 기회를 정확하게 식별하는 강력하고 무료인 트레이딩 도구입니다. Break Out Explosion 프로젝트의 일부로서, 초보자와 전문가 모두에게 신뢰할 수 있는 고급 시각적 솔루션을 제공합니다. 이 제품의 MT5 버전은 여기에서 확인할 수 있습니다: https://www.mql5.com/en/market/product/153004 추세선 돌파 개념에 관심이 있다면, 주요 추세 방향의 돌파를 감지하는 고급 도구를 확인해 보세요: https://www.mql5.com/en/market/product/155132 이 지표의 화살표를 기반으로 거래하는 EA를 원하시나요? 아래 링크를 통해 $30 에 직접 작업을 생성하시면 제가 만들어드리겠습니다: https://www.mql5.com/en/job/new?prefered=eeecad 최신 업데이트와 새로운 제품 출시
FREE
Lisek Weis Wave
Darius Hans Lischka
4 (4)
This Weis Wave Volume indicator is a tool to help traders identify the current price trend.  Understanding volume can provide insight into a market's behavior to help you determine its overall health. The most important rule is this: volume precedes price. Typically, before a market price moves, volume comes into play. It has 2 main colors histogram which are green and red. – Green indicates an upward wave. The more the price increases, the bigger the green volume gets. – The red color shows a d
FREE
Triple RSI
Pablo Leonardo Spata
1 (1)
LOOK AT THE FOLLOWING STRATEGY WITH THIS INDICATOR. Triple RSI is a tool that uses the classic Relative Strength Indicator, but in several timeframes to find market reversals.    1.  ️ Idea behind the indicator and its strategy: In Trading, be it Forex or any other asset, the ideal is to keep it simple, the simpler the better . The triple RSI strategy is one of the simple strategies that seek market returns. In our experience, where there is more money to always be won, is in the marke
FREE
Market Profile 3
Hussien Abdeltwab Hussien Ryad
3 (2)
Market Profile 3 MetaTrader 4 indicator  — is a classic Market Profile implementation that can show the price density over time, outlining the most important price levels, value area, and control value of a given trading session. This indicator can be attached to timeframes between M1 and D1 and will show the Market Profile for daily, weekly, monthly, or even intraday sessions. Lower timeframes offer higher precision. Higher timeframes are recommended for better visibility. It is also possible t

FREE
Forex Market Profile and Vwap
Lorentzos Roussos
4.86 (7)
외환 시장 프로필(줄여서 FMP) 이것이 아닌 것 : FMP는 일반적인 문자 코드 TPO 표시가 아니며 전체 차트 데이터 프로필 계산을 표시하지 않으며 차트를 기간으로 분할하여 계산하지도 않습니다. 그것이 하는 일: 가장 중요한 것은 FMP 표시기가 사용자 정의 스펙트럼의 왼쪽 가장자리와 사용자 정의 스펙트럼의 오른쪽 가장자리 사이에 있는 데이터를 처리한다는 것입니다. 사용자는 마우스로 표시기의 양쪽 끝을 당기기만 하면 스펙트럼을 정의할 수 있습니다. 표시기 오른쪽 가장자리가 라이브 막대로 당겨지고 더 멀리(미래로) 표시되면 표시기가 "라이브"로 간주됩니다(새 막대로 업데이트됨). 표시기는 첨부된 차트에 "앵커" 개체를 놓은 다음 해당 앵커를 하드 드라이브의 파일과 연결합니다. 이렇게 하면 차트 또는 지표가 닫힐 때까지 다시 시작해도 설정이 유지되어 차트에서 계속 FMP를 실행할 수 있습니다. FMP 지표는 하나의 차트에서 여러 인스턴스를 실행할 수 있으며 이름을 지정할 수
FREE
UPD1 Watermark MT4
Vitaliy Kuznetsov
5 (2)
인디케이터는 차트에 모든 텍스트와 이미지를 표시하며 매크로에서 요청한 정보도 표시할 수 있습니다. 텍스트 블록은 3개, 이미지 블록은 1개가 있습니다. 글꼴 선택, 크기, 색상, 들여쓰기 및 위치 지정이 가능합니다. 스크린샷에 브랜드를 붙이거나 차트에 필요한 정보를 표시하고 싶을 때 UPD1 Watermark 는 매우 유용한 도구가 될 것입니다. 설정 설명. 텍스트 설정(3개 블록). Text 1, 2, 3 – 텍스트 또는 매크로를 입력합니다. Font Name – 글꼴 이름을 입력합니다. 오류 발생 시 기본 글꼴이 사용됩니다. Font Size – 글꼴 크기를 지정합니다. Font Color – 글꼴 색상을 지정합니다. Corner – 개체 스냅 각도를 선택합니다. Visual Position – 개체를 차트 앞 또는 뒤에 배치합니다. X – 픽셀 단위의 가로 들여쓰기. Y – 픽셀 단위의 수직 들여쓰기. 이미지 설정(1블록). Image – 이미지를 선택합니다. Manua
FREE
이 제품의 구매자들이 또한 구매함
Trend SniperX MT4
Sarvarbek Abduvoxobov
5 (5)
Trend Sniper X 는 트레이더가 명확하고 정확하게 트렌드 방향과 잠재적 반전 지점을 포착할 수 있도록 돕는 MetaTrader 5 전용 멀티 타임프레임 추세 추종 지표입니다. MT5 버전 링크: https://www.mql5.com/en/market/product/181101 가격 안내: 현재 가격은 프로모션 할인가이며, 향후 업데이트 및 새 기능 출시 시 인상될 수 있습니다. Code2Profit 채널 멀티 타임프레임 분석으로 시장을 정복하세요! Trend Sniper X로 승률을 극대화하는 방법: 핵심 규칙 및 세션 팁 기술 사양 플랫폼 MetaTrader 5 지표 유형 멀티 타임프레임 추세 지표 작동 타임프레임 모든 차트 타임프레임 (상위 타임프레임 M1–MN1 독립 선택 가능) 주요 종목 외환(Forex), 골드(XAUUSD) 및 기타 CFD 추천 계좌 모든 계좌 유형 시각화 컬러 추세 캔들 (매수/매도/약세/변화) + 매수/매도 화살표 추가 모듈 세션 마켓 박스 (
Scalper Vault
Oleg Rodin
5 (40)
Scalper Vault는 당일 매매(intraday trading)에서 일관된 성과를 내고자 하는 트레이더를 위해 설계된, 강력하고 모든 기능을 갖춘 트레이딩 시스템입니다. 이 고정밀 지표는 외환(Forex) 및 바이너리 옵션 트레이더 모두에게 기관급 분석을 제공하는 독립적인 종합 트레이딩 시스템 역할을 합니다. 구매 후 저에게 연락해 주시면, 트레이딩 팁과 함께 특별한 보너스를 제공해 드립니다! Scalper Vault는 추측에 의존하거나 복잡한 수동 분석을 할 필요를 없애주며, 사용하기 쉬운 트레이딩 기법을 통해 오직 매매 실행에만 집중할 수 있도록 돕습니다. 정확한 추세 추종 신호: 핵심 알고리즘이 시장 구조를 분석하여, 지배적인 시장 추세 방향과 일치하는 고확률 신호만을 제공함으로써 잘못된 진입을 획기적으로 줄여줍니다. 정밀한 고점 및 저점 탐지: 시장의 움직임이 소진되는 지점을 스캔하여 잠재적인 반전 구간을 식별합니다. 간(Gann) 이론 기반의 매수/매도 구간: 수학적
Currency Strength Wizard
Oleg Rodin
4.85 (61)
통화 강도 마법사는 성공적인 거래를 위한 올인원 솔루션을 제공하는 매우 강력한 지표입니다. 표시기는 여러 시간 프레임의 모든 통화 데이터를 사용하여 이 또는 해당 외환 쌍의 힘을 계산합니다. 이 데이터는 특정 통화의 힘을 확인하는 데 사용할 수 있는 사용하기 쉬운 통화 지수 및 통화 전력선의 형태로 표시됩니다. 필요한 것은 거래하려는 차트에 표시기를 부착하는 것뿐입니다. 표시기는 거래하는 통화의 실제 강세를 보여줍니다. 지표는 또한 추세와 거래할 때 유리하게 사용할 수 있는 구매 및 판매 거래량 압력의 극한값을 보여줍니다. 지표는 또한 피보나치에 기반한 가능한 대상을 보여줍니다. 표시기는 PUSH 알림을 포함한 모든 유형의 알림을 제공합니다. 구매 후 연락주세요. 나는 당신과 거래 팁을 공유하고 당신에게 무료로 훌륭한 보너스 지표를 줄 것입니다! 나는 당신에게 행복하고 유익한 거래를 기원합니다!
PRO Renko System
Oleg Rodin
5 (31)
PRO Renko System 은 RENKO 차트 거래를 위해 특별히 고안된 매우 정확한 거래 시스템입니다. 이것은 다양한 거래 상품에 적용될 수있는 보편적 인 시스템입니다. 체계는 효과적으로 당신에게 정확한 반전 신호에 접근을 주는 소위 시장 소음을 중화합니다. 이 표시기는 사용하기가 매우 쉽고 신호 생성을 담당하는 매개 변수가 하나만 있습니다. 당신은 쉽게 당신의 선택의 어떤 무역 계기에 공구를 적응시킬 수 있고 renko 막대기의 크기. 나는 항상 당신이 내 소프트웨어로 수익성있게 거래 할 수 있도록 추가 지원을 제공 할 준비가되어 있습니다! 나는 당신에게 행복하고 수익성있는 거래를 기원합니다! 구매 후 저에게 연락하십시오! 내 렌코 차트 생성기를 보내드립니다. 또한 내 개인 권장 사항 및 시스템의 다른 모듈을 무료로 공유 할 것입니다!
SR Liquidity
Oleg Rodin
5 (2)
SR Liquidity 는 시장 유동성이 집중되고 가격이 가장 강력하게 반응하는 숨겨진 구간을 포착하도록 설계된 트레이딩 지표입니다. 이러한 특수 유동성 구간은 강력한 지지 및 저항선 역할을 하며, 시장 반전 가능성이 가장 높은 지점을 명확하게 보여주는 지도가 되어 줍니다. SR Liquidity는 일반적인 지지 및 저항선을 단순히 그리는 대신, 실제 가격 움직임을 분석하여 매수 및 매도 압력이 집중되는 구간을 포착합니다. 이러한 구간은 실질적인 시장의 흐름을 주도하는 유동성 풀(liquidity pools)에 해당합니다. 이 지표는 해당 구간을 차트에 직접 시각화하여, 가격 반응이 실제로 나타나기 전에 이를 미리 예측할 수 있도록 돕습니다. 즉, 가격 추세가 전환될 가능성을 사전에 파악하게 해주는 것입니다. 결과적으로 이 지표는 가공되지 않은 가격 움직임(price action)을 시장의 핵심 가격대, 다시 말해 추세 전환점이 될 수 있는 지점들을 보여주는 명확하고 실용적인 로드맵
Zoryk Gold mt4
Reda El Koutbane
5 (3)
ZORYK — MetaTrader 4용 XAUUSD 전문 신호 및 트레이드 플래닝 시스템 이런 경험이 있을 것입니다. 골드를 분석하고 진입을 기다린 뒤 마침내 포지션을 열었지만 가격이 곧바로 반대 방향으로 움직입니다. 너무 일찍 청산하거나 Stop Loss를 옮기거나 몇 초 동안 망설입니다. 그 후 시장은 내가 없이도 처음 예상했던 목표까지 정확히 움직입니다. 문제는 항상 방향이 아니었습니다. 진짜 문제는 불확실성이었습니다. 정확한 진입 위치를 몰랐습니다. 어느 지점에서 원래의 트레이드 아이디어가 무효가 되는지 몰랐습니다. 가까운 수익을 확보해야 할지 더 큰 움직임을 기다려야 할지 판단하기 어려웠습니다. 현재 setup이 정말 강한지 아니면 단지 새로운 거래를 억지로 찾고 있는지도 확신하기 어려웠습니다. 골드는 매우 빠르게 움직입니다. 명확한 계획이 없다면 좋은 분석도 몇 초 만에 나쁜 결정으로 바뀔 수 있습니다. ZORYK는 이 문제를 해결하기 위해 개발되었습니다.
Atomic Analyst
Issam Kassas
5 (14)
Atomic Analyst — MetaTrader 4 제품 문의, 설정 안내 또는 기술 지원이 필요하면 MQL5에서 직접 메시지를 보내 주세요. 이 인디케이터는 복잡한 시장 계산을 단순한 시각적 신호, 색상 표시 캔들, 추세 판독, 손절 레벨 및 여러 익절 구간으로 변환하여 트레이더가 빠르게 이해하고 실제 시장 상황에서 사용할 수 있게 합니다. 주요 거래 용도: 스캘핑 및 인트라데이 거래: 빠른 의사결정, 명확한 화살표, 알림, 캔들 색상 및 구조화된 진입/청산 구간을 위해 설계되었습니다. 데이 트레이딩 및 스윙 트레이딩: 추세 방향, 강도, 모멘텀 및 다중 시간대 분석을 사용하여 더 큰 시장 움직임을 따라갈 수 있도록 돕습니다. 주요 기능: • Price Action, 강도 및 모멘텀 분석 • 다중 시간대 추세 스캐너 • 전체 추세 비율 계산 • 매수 및 매도 화살표 • 손절 및 여러 익절 레벨 • 최대 5개의 피보나치 기반 익절 레벨 • 트레일링 스톱 로직 • 추세 및 모멘텀
Smart Trend Trading System
Issam Kassas
4.8 (10)
Smart Trend Trading System은 추세 정보, 진입·청산 신호, 가격 수준을 하나의 차트에 표시하는 MetaTrader 4용 지표입니다. 이 시스템은 추세 감지, 반전 구간, Smart Cloud, 트레일링 스톱 로직, 지지와 저항, 캔들 색상 표시, 알림, 다중 시간대 분석 등 10개 이상의 트레이딩 도구 를 하나의 시스템으로 결합합니다. 이 시스템은 다양한 시장 상황에서 거래를 돕도록 설계되었습니다: 추세장: 주요 추세를 식별하고, 되돌림을 감지하며, 모멘텀을 따라가고, 손절 가이드와 트레일링 스톱 옵션을 사용해 더 깔끔한 진입 지점을 찾습니다. 횡보장: 박스권 시장 상황을 감지하고, 반응 구간을 식별하며, 가격이 중요한 레벨에서 반응할 때 더 명확한 신호를 받을 수 있습니다. 스캘핑 및 인트라데이 거래: 빠른 신호, 캔들 색상, 알림, 다중 시간대 확인을 사용하여 단기 거래 결정을 지원합니다. 주요 기능: • 10개 이상의 인디케이터를 하나의 트레이딩 시스
SIO Oscillator: 자기 최적화 세미분산 불균형 오실레이터 지표를 구매하시면 이를 기반으로 한 전문가 어드바이저(EA)를 무료로 받으실 수 있습니다. 대부분의 오실레이터는 모든 가격 움직임을 똑같이 취급합니다. SIO는 상승 압력과 하락 압력을 분리하여 둘 사이의 불균형을 측정하고, 매수자와 매도자 중 어느 쪽이 실제로 시장을 주도하고 있는지 보여줍니다. 불균형이 극단에 도달하면 SIO는 진입가, 손절(Stop Loss), 익절(Take Profit) 수준이 포함된 명확한 신호를 표시합니다. SIO의 차별점은 고정된 설정에 의존하지 않는다는 것입니다. 내장된 자기 최적화 엔진이 현재 종목과 시간 프레임에 맞는 파라미터를 지속적으로 탐색하고, 사용하기 전에 검증합니다. 두 가지 신호 모드 평균 회귀(Mean Reversion): 불균형의 극단에서 거래하며 균형으로의 복귀를 노립니다. 추세 추종(Trend Following): 지속적이고 우세한 불균형의 방향으로 거래합니다. 자
Quant Direction
Georgios Kalomoiropoulos
Quant Direction 은 3D 시장 분석 도구입니다. 다양한 매개변수에 걸쳐 정확한 백분율 편차를 계산하면서 완벽하게 객관적인 알고리즘 기반 시장 분석을 제공합니다. 첨단 AI 기반 모델링 도구와 엄격한 테스트를 거쳐 개발된 이 알고리즘은 타의 추종을 불허하는 정확도로 시장을 분석합니다. 플랫폼에서 모든 통화쌍 또는 금융 상품을 분석할 수 있습니다. 단기 거래, 데이 트레이딩, 스윙 트레이딩 등 어떤 유형의 거래를 하든 Quant Direction은 최적의 선택입니다. 운영자가 되는 것의 진정한 이점 퀀트 디렉션의 진정한 장점은 감정, 눈의 피로, 과도한 분석을 완전히 배제한다는 점입니다. 더 이상 수십 개의 차트를 일일이 살펴보며 방향을 찾거나 자신의 판단에 끊임없이 의문을 품을 필요가 없습니다. 이 시스템은 8개의 시간 간격(5개월에서 수개월까지)을 밀리초 단위로 처리합니다. 특정 시점의 주요 시장 참여자를 정확하게 식별하여 항상 성공 확률이 가장 높은 방향으로 거래할
Trend Lines PRO
Roman Podpora
5 (2)
트렌드 라인즈 프로       이 지표는 시장이 실제로 어떤 방향으로 전환되는지 파악하는 데 도움이 됩니다. 실제 추세 반전 지점과 주요 시장 참여자들이 다시 진입하는 지점을 보여줍니다. 보시다시피       BOS 라인       복잡한 설정이나 불필요한 노이즈 없이 더 높은 시간대의 추세 변화와 주요 레벨을 확인할 수 있습니다. 신호는 차트에 다시 그려지지 않고 캔들이 마감된 후에도 계속 표시됩니다. VERSION MT 5   -   RFI LEVELS PRO   표시기   와 결합할 때 최대 잠재력을 발휘합니다. 지표가 보여주는 내용: 실제 변화       추세(BOS 라인) 한 번 신호가 나타나면 그 신호는 계속 유효합니다! 이는 신호를 발생시킨 후 변경될 수 있는 리페인팅 방식의 지표와 중요한 차이점입니다. 리페인팅 방식의 지표는 잠재적으로 자금 손실로 이어질 수 있습니다. 이제 더욱 높은 확률과 정확도로 시장에 진입할 수 있습니다. 또한 화살표가 나타난 후 목표가(익절)
AW Prime Oscillator
AW Trading Software Limited
5 (1)
두 개의 오실레이터의 조합. 첫 번째 항목은 진입점을 표시하고 두 번째 항목은 현재 추세를 표시합니다. 표시기는 두 가지 모드의 화살표로 오실레이터 신호를 표시할 수 있습니다. 모든 빠른 오실레이터 신호 또는 현재 추세 방향의 신호만 표시할 수 있습니다. 다중 시간대 패널과 세 가지 유형의 신호 알림이 있습니다. 이익: 일일 및 스캘핑 거래에 적합 추세 필터링 간단하고 민감한 설정 다중 시간대 패널 Advisor에 통합하는 데 적합합니다. 모든 기호 및 기간에서 작동합니다. 세 가지 유형의 알림 MT5 version ->  HERE  / Problem solving ->  HERE 지표 전략 표시기는 두 개의 서로 다른 오실레이터로 구성됩니다. 느린 추세선(두꺼움) - 지표의 고수준이 위에서 아래로 교차하면 하락세 지표이고, 낮은 수평 수준(지표의 낮은 수준)이 아래에서 위로 교차하면 하락 추세 지표입니다. 상승 경향. 또한, 하단 영역에서 느린 선을 발견하면 현재 추세가 하락세임을
M1 Sniper
Oleg Rodin
4.97 (30)
M1 SNIPER 는 사용하기 쉬운 거래 지표 시스템입니다. M1 시간대에 맞춰 설계된 화살표 지표입니다. 이 지표는 M1 시간대 스캘핑을 위한 단독 시스템으로 사용할 수 있으며, 기존 거래 시스템의 일부로도 사용할 수 있습니다. 이 거래 시스템은 M1 시간대 거래용으로 특별히 설계되었지만, 다른 시간대에도 사용할 수 있습니다. 원래는 XAUUSD와 BTCUSD 거래를 위해 이 방법을 설계했지만, 다른 시장 거래에도 유용하다는 것을 알게 되었습니다. 이 지표의 신호는 추세 방향과 반대로 거래될 수 있습니다. 저는 지표의 신호를 활용하여 양방향으로 거래할 수 있도록 돕는 특별한 거래 기법을 알려드립니다. 이 방법은 특별한 동적 지지선과 저항선 가격 영역을 활용하는 것을 기반으로 합니다. 구매하시면 M1 SNIPER 화살표 지표를 바로 다운로드하실 수 있습니다. 또한, 아래 스크린샷에 표시된 Apollo Dynamic SR 지표는 M1 SNIPER 도구를 사용하는 모든 사용자에게 무료로
Hidden Cycles
Lev Vladimirovic Marushkin
5 (1)
The Only 100% Universal Tool! Stop trading against nature! This is your chance to secure the only indicator rooted in the absolute laws that govern the entire universe. Most tools guess—this one reveals the truth. Buy another toy or buy the truth. Your choice... Based on Universal Laws — NOT Some Guy’s Algorithm: Let the market adjust to the Hidden Cycles Geometry — not the other way around. Most indicators are based on a man-made formula. They often lag, fail over time, or need constant re-o
Neo Wave PRO
Nikolay Raykov
5 (1)
Price & Time Market Structure Indicator A professional market structure tool that analyzes waves through both price and time — not price alone. Main Description NeoWave PRO is a professional market structure indicator for MetaTrader 4 designed for traders who want to move beyond traditional one-dimensional wave tools such as ZigZag, swing indicators, and basic high/low systems. Most wave indicators analyze only one thing: Price. But a real market wave is not only a price movement. A true wave de
PZ Turning Points MT4
PZ TRADING SLU
1 (1)
Identify key turning points with reliable fractal analysis This indicator examines the price structure of fractals of different periods to determine possible reversal points in the market, providing timing to positional traders that already have a fundamental or technical valuation model. Unlike its younger brother, Reversal Fractals , this indicator won't miss reversals because of the period selected, and will find reversal fractals on a zig-zag fashion, ignoring those reversals which do not
CRT Multi-Timeframe Market Structure & Liquidity Sweep Indicator Non-Repainting | Multi-Asset | MT5 Version Available MT5 Version:   https://www.mql5.com/en/market/product/162075 Full User Guide — explains what each feature does and why:   https://www.mql5.com/en/blogs/post/767525 Quick Start User Guide  — explains how to configure and in what order:  https://www.mql5.com/en/blogs/post/767540 Indicator Overview CRT Ghost Candle HTF Fractal is a complete institutional-grade market structure too
Gann Time Clusters
Martin Eshleman
2.5 (2)
Gann Time Clusters Indicator This indicator is based on W. D. Gann's Square of 9 method for the time axis. It uses past market reversal points and applies the mathematical formula for Gann's Square of 9 and then makes projections into the future. A date/time where future projections line up is called a 'time cluster'. These time clusters are drawn as vertical lines on the right side of the chart where the market has not advanced to yet. A time cluster will result in a market reversal point (ex.
Neuro Poseidon MT4
Daria Rezueva
4.74 (46)
Neuro Poseidon is a new indicator by Daria Rezueva. It combines precise trading signals with adaptive TP/SL levels - creating best possible trades as a result! Message me and get  Neuro Poseidon Assistant  as a gift to automize your trading process! What makes it stand out? 1. Proven profitability on all assets and timeframes 2. Only confirmed BUY and SELL signals present on the chart 3. Adaptive TP & SL levels generated by the software for each trade 4. Easy to understand - suitable for all
Non repaint MT4
Yan Zhen Du
5 (1)
This is a professional chart indicator designed for traders focused on stability and clear price action. It helps filter market noise and provides clear visual entry and exit zones for your trading decisions. Core Features: Strictly Non-Repainting: The system is built with strict non-repaint logic. What you see on the chart is the true historical performance. Confirmed Signals: Signals are triggered and confirmed only after the candle closes . Once a trading arrow appears on a closed candle, it
Forex Breath System
Oleg Rodin
5 (6)
Forex Breath System 은 모든 시장에서 사용할 수 있는 추세 기반 거래 시스템입니다. 이 시스템은 통화, 금속, 원자재, 지수, 암호화폐, 심지어 주식에도 사용할 수 있습니다. 또한 어떤 시간대에도 사용할 수 있습니다. 이 시스템은 보편적입니다. 추세를 보여주고 추세와 함께 화살표 신호를 제공합니다. 또한 이 지표는 신호가 추세 방향으로 나타날 때 특별한 유형의 경고를 제공하여 추세 거래를 쉽게 만들어줍니다. 이 표시기는 이해하기 어려운 설정을 전혀 처리할 필요가 없으므로 사용하기가 매우 쉽습니다.  차트에 첨부하기만 하면 거래 준비가 완료됩니다. 어떤 거래 스타일을 선호하든 시스템은 시장 방향과 추세 방향에서 가능한 진입점을 확인하는 데 도움이 됩니다. 표시기는 PUSH 알림을 포함한 모든 유형의 경고를 제공합니다. 거래 지침과 큰 보너스를 받으려면 구매 후 저에게 연락하십시오! 행복하고 수익성 있는 거래를 기원합니다!
Advanced Supply Demand
Bernhard Schweigert
4.91 (302)
현재 30% 할인! 초보자나 전문 트레이더를 위한 최고의 솔루션! 이 보조지표는 우리가 다수의 독창적 기능과 새로운 공식을 통합한 독특하고 고품질이며 저렴한 거래 도구입니다. 이 업데이트를 통해 이중 시간대를 표시할 수 있습니다. 더 높은 TF를 표시할 수 있을 뿐만 아니라 차트 TF와 더 높은 TF 모두를 표시할 수 있습니다: 중첩 영역 표시. 모든 Supply Demand 트레이더들이 좋아할 것입니다. :) 중요한 정보 공개 Advanced Supply Demand의 잠재력을 극대화하려면 다음을 방문하십시오. https://www.mql5.com/ko/blogs/post/720245   진입 또는 목표의 명확한 트리거 포인트를 정확히 찾아냄으로 해서 거래가 어떻게 개선될지 상상해 보십시오. 새로운 알고리즘을 기반으로 매수자와 매도자 간의 잠재적인 불균형을 훨씬 더 쉽게 분간할 수 있습니다. 왜냐하면 가장 강한 공급영역과 가장 강한 수요 영역과 과거에 어떻게 진행 되었는지를(이전
Super Signal – Skyblade Edition 전문가용 노리페인트 / 노래그 트렌드 신호 시스템, 뛰어난 승률 제공 | MT4 / MT5용 1분, 5분, 15분과 같은 낮은 타임프레임에서 가장 좋은 성능을 보입니다. 핵심 기능: Super Signal – Skyblade Edition은 추세 매매를 위해 설계된 스마트 신호 시스템입니다. 이 시스템은 다중 필터 로직을 활용하여, 명확한 방향성과 실질적인 모멘텀이 수반된 고품질 추세만을 감지합니다. 이 시스템은 고점 또는 저점을 예측하지 않으며 , 다음 세 가지 조건이 모두 충족될 때만 신호를 발생시킵니다: 명확한 추세 방향 강화되는 모멘텀 건전한 변동성 구조 또한, 시장 세션 기반의 유동성 분석을 통해 신호의 신뢰성과 타이밍을 더욱 향상시킵니다. 신호 특성: 모든 화살표 신호는 100% 리페인트 없음 / 지연 없음 신호가 한 번 발생하면 고정되며, 깜빡이거나 사라지지 않음 차트 상의 시각적 화살표, 정보 패널, 팝업 알
Liquidity Scalper System
Stanislav Konin
5 (2)
Liquidity Scalper System: 인디케이터 형식의 유동성 기반 트레이딩 시스템입니다. 대부분의 인디케이터는 화살표만 보여주고, 손절을 어디에 둘지, 목표가 어디인지, 신호를 믿어도 되는지는 트레이더가 스스로 판단해야 합니다. Liquidity Scalper System은 거래의 전체 주기를 다룹니다. 유동성 풀을 찾고, 돌파 시 신호를 주며, Entry, Stop Loss와 세 개의 목표를 즉시 계산하고, 패널에 통계와 새로운 데이터에 대한 검증 결과를 표시합니다. 설정은 시스템이 스스로 선택하고 매일 업데이트합니다. 작동 방식 1. 시스템이 유동성 풀을 찾습니다. 시장 참여자들의 스톱 주문이 쌓여 있는 레벨입니다. 2. 가격이 풀을 돌파하고 그 돌파가 움직임의 강도(필요 시 거래량)로 확인되면 차트에 BUY 또는 SELL 화살표가 나타납니다. 3. Entry, Stop Loss, TP1, TP2, TP3 레벨이 영역 채우기와 함께 즉시 그려집니다. 4. 오른쪽에 유
Tokyo mt4 Indicator
Vasiliy Strukov
5 (9)
Tokyo Indicator는 추세 방향, 잠재적 거래 신호 및 시장 상황을 명확하고 시각적으로 보여줍니다. 색상으로 구분된 계단식 추세선은 강세 구간(파란색)과 약세 구간(자홍색)을 명확히 구별해 줍니다. 추세가 전환될 때 나타나는 방향성 화살표는 잠재적인 매수 및 매도 기회를 강조하여 보여줍니다. 통합 대시보드는 현재 신호, 시장 성향(bias), 모멘텀, 변동성, 신호 품질 등의 정보를 한눈에 파악할 수 있도록 구성되어 있습니다. 이를 통해 트레이더는 별도의 패널을 오갈 필요 없이 가격 움직임(price action)과 지표의 데이터를 동시에 분석할 수 있습니다. 깔끔한 차트 화면과 간결한 시장 개요를 제공하는 Tokyo Indicator는 체계적인 추세 분석과 거래 결정을 지원합니다. 모든 시간대와 다양한 자산(특히 금)에서 활용할 수 있습니다. 추세 방향, 잠재적 거래 신호 및 시장 상황을 명확하고 시각적으로 보여줍니다. 색상으로 구분된 계단식 추세선은 강세 구간(파란색)
Gann Made Easy
Oleg Rodin
4.84 (174)
Gann Made Easy 는 mr.의 이론을 사용하여 최고의 거래 원칙을 기반으로 하는 전문적이고 사용하기 쉬운 Forex 거래 시스템입니다. W.D. 간. 이 표시기는 Stop Loss 및 Take Profit Levels를 포함하여 정확한 BUY 및 SELL 신호를 제공합니다. PUSH 알림을 사용하여 이동 중에도 거래할 수 있습니다. 구매 후 거래 방법 안내 및 유용한 추가 지표를 무료로 받으시려면 저에게 연락주세요! 아마도 Gann 거래 방법에 대해 이미 여러 번 들었을 것입니다. 일반적으로 Gann의 이론은 초보자 거래자뿐만 아니라 이미 거래 경험이 있는 사람들에게도 매우 복잡한 것입니다. Gann의 거래 방식은 이론적으로 적용하기 쉽지 않기 때문입니다. 나는 그 지식을 연마하고 Forex 지표에 최고의 원칙을 적용하기 위해 몇 년을 보냈습니다. 표시기는 적용하기가 매우 쉽습니다. 차트에 첨부하고 간단한 거래 권장 사항을 따르기만 하면 됩니다. 지표는 지속적으로 시장 분석
Break and Retest Hunter MT4 is a powerful MetaTrader 5 indicator designed to automatically identify support and resistance levels, breakout structures, and potential retest opportunities in real time. Bonus Indicator: After purchasing Break and Retest Hunter , contact me to receive Trade Indicator Assistant EA completely free as a bonus utility. $65 for the next 10 copies . Next price is $120.  Combining adaptive market analysis, clear BUY/SELL signals, Fibonacci-based profit targets, and a pre
Advanced Currency Strength28 Indicator
Bernhard Schweigert
4.91 (659)
현재 40% 할인 초보자 또는 전문가 트레이더를 위한 최고의 솔루션! 이 지표는 우리가 독점 기능과 새로운 공식을 통합했기 때문에 독특하고 고품질이며 저렴한 거래 도구입니다. 단 하나의 차트로 28 Forex 쌍의 통화 강도를 읽을 수 있습니다! 새로운 추세 또는 스캘핑 기회의 정확한 트리거 포인트를 정확히 찾아낼 수 있기 때문에 거래가 어떻게 개선될지 상상해 보십시오. 사용 설명서: 여기를 클릭  https://www.mql5.com/en/blogs/post/697384 그것이 첫 번째, 원본입니다! 쓸모없는 지망생 클론을 사지 마십시오. 더 스페셜  강력한 통화 모멘텀을 보여주는 하위 창의 화살표 GAP가 거래를 안내합니다! 기본 또는 호가 통화가 과매도/과매도 영역(외부 시장 피보나치 수준)에 있을 때 개별 차트의 기본 창에 경고 표시가 나타납니다. 통화 강도가 외부 범위에서 떨어질 때 풀백/반전 경고. 교차 패턴의 특별 경고 추세를 빠르게 볼 수 있는 다중 시간
Gold Channel XAUUSD
Paulo Rocha
5 (4)
Gold Channel is a volatility-based indicator, developed with a specific timing algorithm for the XAUUSD pair, which consists of finding possible corrections in the market. This indicator shows two outer lines, an inner line (retracement line) and an arrow sign, where the theory of the channel is to help identify overbought and oversold conditions in the market. The market price will generally fall between the boundaries of the channel. If prices touch or move outside the channel it is a tradi
현재 30% 할인 ! 초보자 또는 전문가 트레이더를 위한 최고의 솔루션! 이 대시보드 소프트웨어는 28개의 통화 쌍에서 작동합니다. 2가지 주요 지표(Advanced Currency Strength 28 및 Advanced Currency Impulse)를 기반으로 합니다. 전체 Forex 시장에 대한 훌륭한 개요를 제공합니다. 고급 통화 강도 값, 통화 이동 속도 및 모든(9) 시간대의 28 Forex 쌍에 대한 신호를 보여줍니다. 추세 및/또는 스캘핑 기회를 정확히 파악하기 위해 차트의 단일 지표를 사용하여 전체 시장을 볼 수 있을 때 거래가 어떻게 개선될지 상상해 보십시오! 잠재적인 거래를 식별하고 확인하면서 강력한 통화와 약한 통화를 더욱 쉽게 식별할 수 있도록 이 지표에 기능을 내장했습니다. 이 표시기는 통화의 강세 또는 약세가 증가 또는 감소하는지 여부와 모든 시간대에서 수행되는 방식을 그래픽으로 보여줍니다. 추가된 새로운 기능은 현재 시장 조건 변화에 적응하는
제작자의 제품 더 보기
Anchored VWAP (AVWAP) for MT4 – Ultimate Drag & Drop Volume-Weighted Average Price Indicator Unlock true institutional volume analysis with the definitive Anchored VWAP (AVWAP) indicator designed specifically for MetaTrader 4. Featuring a fully interactive, draggable vertical line right on your chart, this tool lets you anchor your volume-weighted calculations to any significant market event instantly. Simply click and drag the anchor line to any swing low, swing high, market structure shift,
FREE
Gartley Patterns
Jeffrey Lloyd Lauzon
Gartley Patterns (Harmonic Scanner) Gartley Patterns is an institutional-grade technical overlay engineered to automatically map complex harmonic price structures and swing imbalances across active execution cycles. By processing market geometry dynamically through strict multi-timeframe swing filters, this utility completely eliminates manual calculation errors and gives traders an instant visual panel of high-probability reversal zones on a single chart window. Utilizing specialized sing

FREE
Fast VWAP
Jeffrey Lloyd Lauzon
Fast VWAP  (Highly Optimized Intraday Dashboard) The Fast VWAP Matrix is an institutional-grade technical overlay designed to isolate volume-weighted fair value and intraday structural balance across active execution cycles. By processing price action dynamically through volume-weighting thresholds, this utility completely eliminates calculation delay and gives traders an instant visual panel of asset distribution on a single window. Utilizing specialized single-pass memory arrays, this matrix
FREE
EMA Trend Trader
Jeffrey Lloyd Lauzon
The EMA Trader System is a technical overlay designed to isolate trend continuation and structural balance across active execution cycles. By processing price action dynamically through multi-timeframe moving average thresholds and robust slope filters, this utility completely eliminates calculation delay and gives traders an instant visual HUD dashboard of live trade signals on a single window. Utilizing specialized single-pass memory arrays, this system tracks multi-period EMA loops and highe
FREE
Dual Slope Moving Averages & Support | Resistance Dashboard Professional Institutional-Grade Indicator for MetaTrader 4 (MT4) Transform your chart analysis with Trend Bars With Moving Averages, an elite institutional utility engineered by a professional C++ systems programmer. Designed for high-speed MQL4 execution, this indicator blends multi-slope Moving Average color-coding with a built-in, interactive Support & Resistance Reversal Dashboard. Whether you trade Forex majors or index futures,
FREE
CCI Trend Monitor
Jeffrey Lloyd Lauzon
MTF Commodity Channel Index (CCI) Matrix (Free Advanced Trend Scanner Dashboard) The Multi-Timeframe Commodity Channel Index (CCI) Matrix is an institutional-grade technical scanner designed to evaluate cyclical trend momentum and structural threshold breakouts across 4 distinct execution timeframes simultaneously[cite: 18, 19]. By monitoring the M15, H1, H4, and D1 intervals concurrently[cite: 18, 19], this utility completely eliminates multi-chart cluttering and gives traders an instant execu
FREE
MTF DeMarker Exhaustion Matrix (Free Advanced Exhaustion Dashboard) The Multi-Timeframe DeMarker Exhaustion Matrix is an institutional-grade technical scanner designed to isolate subtle price exhaustion zones and impending market reversals across multiple execution cycles simultaneously. By monitoring the M15, H1, H4, and D1 intervals concurrently[cite: 4], this utility completely eliminates multi-chart cluttering and gives traders an instant executive matrix of trend exhaustion and structural
FREE
Rate of Change Matrix
Jeffrey Lloyd Lauzon
MTF Rate of Change (ROC) Matrix (Free Advanced Price Velocity Dashboard) The Multi-Timeframe Rate of Change (ROC) Matrix is an institutional-grade technical scanner designed to evaluate pure historical price velocity across 4 distinct execution timeframes simultaneously. By monitoring the M15, H1, H4, and D1 intervals concurrently[cite: 18], this utility completely eliminates multi-chart cluttering and gives traders an instant executive matrix of momentum acceleration and structural trend force
FREE
MTF Ultimate Oscillator Matrix (Free Advanced Multi-Timeframe Dashboard) The Multi-Timeframe Ultimate Oscillator Matrix is an institutional-grade technical scanner designed to evaluate momentum convergence across three distinct lookback horizons on four execution timeframes simultaneously. By monitoring the M15, H1, H4, and D1 intervals concurrently, this utility completely eliminates multi-chart cluttering and gives traders an instant executive matrix of weighted momentum expansion and overbou
FREE
Master Trading Matrix
Jeffrey Lloyd Lauzon
Master Trading Matrix (Free Advanced Multi-Indicator Dashboard) The Master Trading Matrix is an institutional-grade technical convergence scanner designed to combine 10 foundational momentum, trend, and exhaustion engines into a single, unified execution display. By integrating RSI, Stochastic, CCI, Williams %R, DeMarker, Momentum, RVI, Chande Momentum, Rate of Change, and Ultimate Oscillator into an executive matrix, this utility eliminates multi-window clutter and provides a complete, real-ti
FREE
RSI Monitors
Jeffrey Lloyd Lauzon
MTF Relative Strength Index (RSI) Matrix (Free Advanced Momentum Dashboard) The Multi-Timeframe Relative Strength Index (RSI) Matrix is an institutional-grade technical scanner designed to evaluate momentum and overbought/oversold conditions across 4 distinct execution timeframes simultaneously[cite: 5, 6]. By monitoring the M15, H1, H4, and D1 intervals concurrently[cite: 5, 6], this utility completely eliminates multi-chart cluttering and gives traders an instant executive matrix of momentum
FREE
CMO Monitor
Jeffrey Lloyd Lauzon
MTF Chande Momentum Matrix (Free Advanced Momentum Dashboard) The Multi-Timeframe Chande Momentum Matrix is an institutional-grade technical scanner designed to isolate raw market momentum and structural exhaustion across multiple execution cycles simultaneously. By monitoring the M15, H1, H4, and D1 intervals concurrently, this utility completely eliminates multi-chart cluttering and gives traders an instant executive matrix of trend structural health on a single window. Unlike common smoothe
FREE
MTF Momentum Oscillator Matrix (Free Advanced Velocity Dashboard) The Multi-Timeframe Momentum Oscillator Matrix is an institutional-grade technical scanner designed to map out the velocity of price change across clean rolling history blocks simultaneously. By monitoring the M15, H1, H4, and D1 intervals concurrently, this utility completely eliminates multi-chart cluttering and gives traders an instant executive matrix of trend speed and directional acceleration on a single window. Instead of
FREE
RVI Monitor
Jeffrey Lloyd Lauzon
MTF Relative Vigor Index (RVI) Matrix (Free Advanced Trend Health Dashboard) The Multi-Timeframe Relative Vigor Index (RVI) Matrix is an institutional-grade technical scanner designed to evaluate directional trend vigor and conviction across 4 distinct execution timeframes simultaneously[cite: 10, 11]. By monitoring the M15, H1, H4, and D1 intervals concurrently[cite: 10, 11], this utility completely eliminates multi-chart cluttering and gives traders an instant executive matrix of trend health
FREE
Stochastic Monitor
Jeffrey Lloyd Lauzon
MTF Stochastic Matrix (Free Advanced Momentum Crossover Dashboard) The Multi-Timeframe Stochastic Matrix is an institutional-grade technical scanner designed to evaluate momentum cycles, %K/%D line crossovers, and extreme overbought/oversold boundaries across 4 distinct execution timeframes simultaneously[cite: 14, 15]. By monitoring the M15, H1, H4, and D1 intervals concurrently[cite: 14, 15], this utility completely eliminates multi-chart cluttering and gives traders an instant executive matr
FREE
MTF Simple Moving Average
Jeffrey Lloyd Lauzon
MTF Simple Moving Average (Free Institutional Moving Average Overlay) The Multi-Timeframe Simple Moving Average (MTF SMA) is an institutional-grade technical utility designed to project higher-timeframe trend baselines directly onto your lower-timeframe execution charts. Developed by a C++ systems programmer specializing in high-speed MQL4 architecture, this indicator provides traders with seamless market structure visibility without requiring multiple open windows or manual chart toggling.
FREE
Williams Monitor
Jeffrey Lloyd Lauzon
MTF Williams %R Matrix (Free Advanced Multi-Timeframe Dashboard) The Multi-Timeframe Williams %R Matrix is an institutional-grade technical scanner designed to evaluate momentum extremes and key boundary dynamics across four execution timeframes simultaneously[cite: 5, 6]. By monitoring the M15, H1, H4, and D1 intervals concurrently, this utility completely eliminates multi-chart cluttering and gives traders an instant executive matrix of price relative to recent high-low ranges on a single win
FREE
필터:
리뷰 없음
리뷰 답변