Bat Patterns

Bat Patterns (Harmonic Scanner)

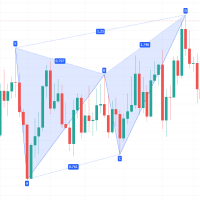
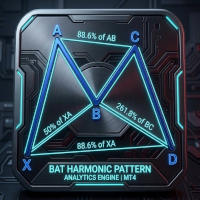
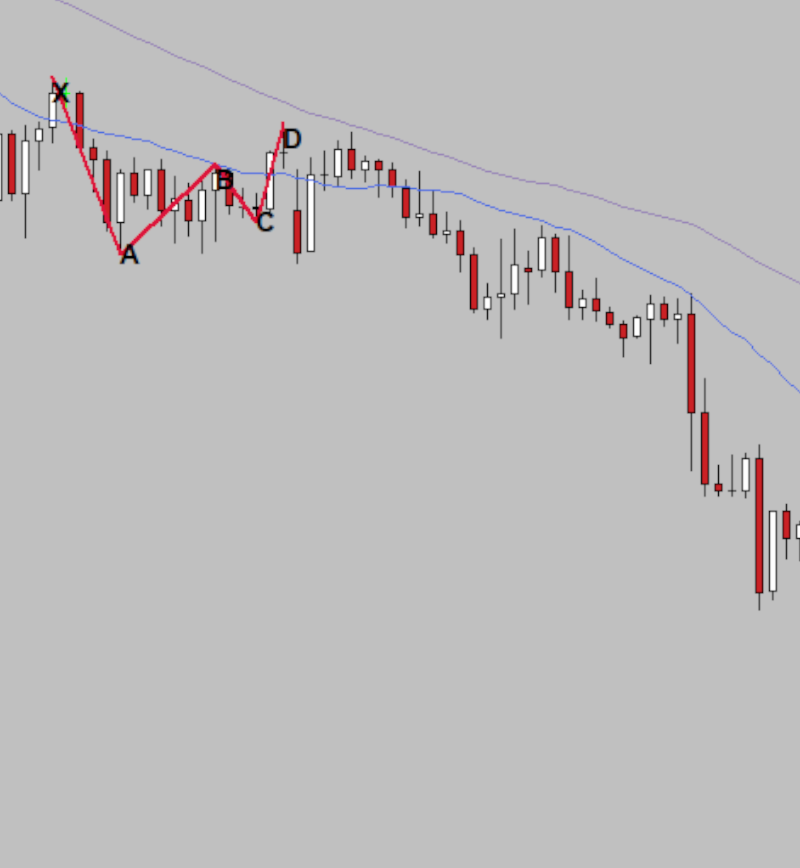
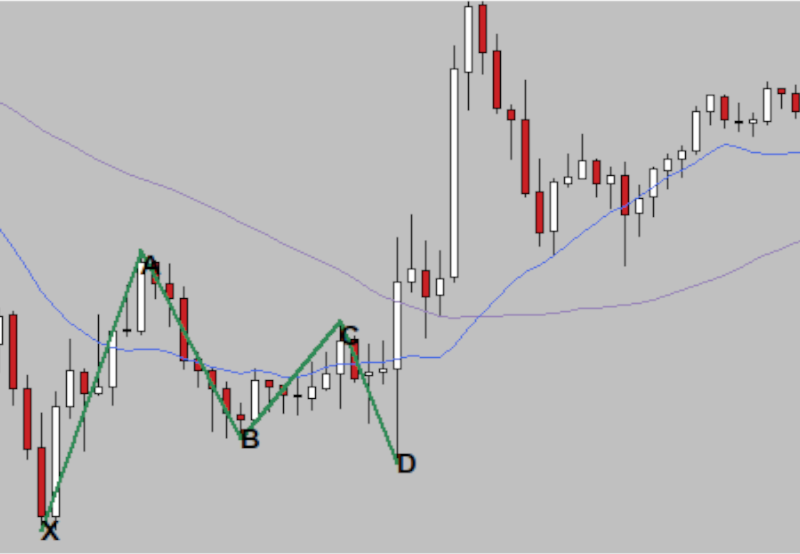
Bat Patterns is an institutional-grade technical overlay engineered to automatically map complex harmonic price structures and swing imbalances across active execution cycles. By processing market geometry dynamically through strict multi-timeframe swing filters, this utility completely eliminates manual calculation errors and gives traders an instant visual panel of high-probability reversal zones on a single chart window.

Utilizing specialized single-pass pattern recognition logic, this indicator tracks structural pivot points relative to custom history depth windows. It transforms complex Fibonacci weighting metrics into clean visual states, helping traders spot precise institutional entry and risk parameters long before standard indicators react.

Core Technical Features

- Dual-Engine Pattern Recognition: Automatically identifies and processes both Bullish and Bearish institutional Bat structures.
- Strict Harmonic Tolerance Band: Utilizes precision Fibonacci ratio verification (B point retrace 0.382-0.50, C point retrace 0.382-0.886, and D point completion ~0.886 of XA) to filter out false formations and isolate high-conviction setups.
- Intuitive Color-Coded State Machine: Instantly adapts indicator rendering and trendline legs to contrast flawlessly with the main chart workspace using customizable input colors (SeaGreen for Bullish, Crimson for Bearish).
- Actionable Value Panel Output: Translates active pattern ratios into explicit metric readouts configured down to the fractional decimal.
- Institutional Solid Workspace Panel: Includes dynamic object mapping that outlines structural legs and apex labels cleanly on a sleek, modern layout.
- Zero Terminal Lag / High Performance Architecture: Engineered with an optimized single-pass loop execution that runs smoothly, completely avoiding terminal lag during high-frequency execution.

Interactive Status & Interpretation Logic

The indicator tracks real-time data calculations and formats the active pattern readout based on asset decimal precision automatically:

- Dynamic Geometric Plotting: Draws chronological trendline legs directly across asset swings to serve as exact mean-reversion and reversal zones.
- Labeled Apex Matrix: Formats and displays structural coordinate strings (X, A, B, C, D) explicitly across pivot points utilizing clean typography standards.
- Clean Object Management: Employs automated clean-up logic that removes outdated graphical objects seamlessly when scanning new historical data.

Adjustable Input Parameters

Tailor the calculation matrix completely to your personalized risk strategy directly through the input dashboard:

- MinPipMove (Default: 10.0): Adjusts the minimum swing size filter in pips to screen out market noise.
- BarsToScan (Default: 1500): Modifies the history depth scanner window for performance tuning.
- BullishColor (Default: SeaGreen): Customizes the line color for bullish Bat formations.
- BearishColor (Default: Crimson): Customizes the line color for bearish Bat formations.

おすすめのプロダクト
Gartley Patterns (Harmonic Scanner) Gartley Patterns is an institutional-grade technical overlay engineered to automatically map complex harmonic price structures and swing imbalances across active execution cycles. By processing market geometry dynamically through strict multi-timeframe swing filters, this utility completely eliminates manual calculation errors and gives traders an instant visual panel of high-probability reversal zones on a single chart window. Utilizing specialized sing
FREE
Adaptive Volume Profile 直近のバーのボリュームプロファイルをチャート上に直接描画します。ポイントオブコントロール(POC)、バリューエリア(VAH / VAL)、高ボリュームノード(HVN)、低ボリュームノード(LVN)、オプションのボリュームヒストグラムを表示します。価格行のサイズは現在のボラティリティ(ATR)に適応するため、どの銘柄・時間足でも見やすいプロファイルになります。 機能 POC - ウィンドウ内で最も出来高の多い価格水準 Value Area (VAH / VAL) - 選択した割合の出来高を含む価格帯(デフォルトは70%) HVN / LVN - 高ボリューム・低ボリュームのノード(価格が停滞しやすい、または素早く動きやすい水準)。プロファイルの平均出来高との比較で統計的に検出します。隣接する行は1つのゾーンに統合され、チャートがすっきり保たれます 適応型の行幅 - 価格行はATRから決まり、最大行数で制限されます リアルタイムのローリングプロファイル - 新しいバーごとに直近N本から再計算されます 固定日付プロファイル - 選択した日付(例
FREE
This indicator filters the Zigzag indicator to calculate the main support and resistance levels. Variables minimum gap between peaks : is the distance (GAP) between the peaks of the Zigzag peaks sensitivity : Minimum number of nearby peaks look back: it means that it has to test the last 50 peaks in the Zigzag object name perfix: a prefix for level’s line name on chart
FREE
Scanner a diffusione Spread Scanner è uno strumento di monitoraggio multi-simbolo elegante, professionale e ad alte prestazioni, progettato per MetaTrader 4 (MT4). Consente ai trader di tracciare e confrontare in tempo reale gli spread su 10 strumenti di trading personalizzabili simultaneamente, direttamente da un'interfaccia HUD intuitiva sul grafico. Che si tratti di operare sulle principali coppie di valute Forex, sui metalli preziosi o sugli indici, sapere dove le condizioni di esecuzione so
FREE
After purchasing the Tpx Dash Supply Demand indicator, you must download this indicator which will link and feed market data to the Tpx Dash Supply Demand indicator and will provide all Supply Demand price signals, ATR Stop, VAH and VAL, trend values ​​with the ADX, and POC prices and locations in the market. Just download it and Dash will locate the indicator to retrieve the information!
FREE
Simple indicator that shows external ( outside ) bars. In certain cases, external bars can be seen as strong trend bars instead of range bars. This can be observed when a with-trend external bar occurs at a reversal from a strong trend. It will help you notice more easily different patterns like - Inside-outside-inside, Inside- Inside -inside, outside - Inside -outside, etc. Works perfectly with my other free indicators Internal bar and Shadows Inputs: How many history bars to calculate on loa
FREE
Qzones
Vinutthapon Bumroong
Quantific Structure Zone is a technical indicator designed for Price Action and SMC traders. It maps the market structure and identifies dynamic supply and demand zones on the chart. Built with a non-repainting algorithm, it provides signals upon confirmed candle closes, making it suitable for live trading and backtesting. The indicator highlights market swings and price levels. Features Automated Market Structure: Identifies and labels structural swing points with HH (Higher High), HL (Higher
FREE
Description: This indicator draw ZigZag Line in multiple time frame also search for Harmonic patterns before completion of the pattern. Features: Five instances of ZigZag indicators can be configured to any desired timeframe and inputs. Draw Harmonic pattern before pattern completion. Display Fibonacci retracement ratios. Configurable Fibonacci retracement ratios. Draw AB=CD based on Fibonacci retracement you define. You can define margin of error allowed in Harmonic or Fibonacci calculations
FREE
Volume By Color RSJ は、出来高が自身の移動平均を上回ったときに出来高バーを濃い色で表示するため、通常と異なる動きのあったローソク足が目立ちます。 オプションの4色モードでは、各ローソク足の出来高の強さを段階的に表示します。 初期設定では、各バーを出来高の20期間単純移動平均と比較します。平均の種類と期間は入力パラメータで変更できます。 使い方 色分けされたバーにより、通常を上回る出来高を伴って発生したブレイクアウト、反発、クライマックスのローソク足を簡単に見つけられます。 高い出来高で水準をブレイクしたローソク足は、その動きに多くの参加者がいることを示し、出来高の少ないブレイクアウトは関心が薄いことを示します。 4色モードでは、各色が平均と比較した出来高の強さの範囲を表し、弱いものから非常に強いものまで段階的に示します。 このインジケーターはサブウィンドウに表示され、あらゆる銘柄と時間足で使用できます。 このインジケーターが役に立ったと感じたら、レビューを書いていただけると幸いです。他のトレーダーが見つけやすくなります。
FREE
SX Supply Demand Zones accurately identifies and draws high-probability Supply and Demand zones using a sophisticated algorithm. Unlike traditional indicators that clutter your chart, this indicator is designed with a focus on performance and a clean user experience. New Unique Feature: Interactive Legend System What truly sets this indicator apart from everything else is the Interactive Control Legend. You have a professional dashboard directly on your chart that allows you to: Show/Hide: Ins
FREE
MASi Three Screens is based on the trading strategy by Dr. Alexander Elder. This indicator is a collection of algorithms. Algorithms are based on the analysis of charts of several timeframes. You can apply any of the provided algorithms. List of versions of algorithms:     ThreeScreens v1.0 - A simple implementation, with analysis of the MACD line;     ThreeScreens v1.1 - A simple implementation, with analysis of the MACD histogram;     ThreeScreens v1.2 - Combines the first two algorithms in
FREE
MT Supply Demand
Issara Seeboonrueang
4 (4)
We provide indicators tailored to better meet your trading requirements.       >>  MT Magical  << MT Supply Demand : It is an indicator created to find supply and demand, which will be important support and resistance levels for the price.  Supply Zone   is a zone where the price has reached, it is often resisted. In other words, when the price reaches this zone, there will be more selling power to push the price back down. Demand Zone   is a zone where the price has reached, it is ofte
FREE
Simple QM Pattern
Suvashish Halder
3.33 (3)
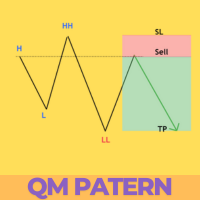
Simple QM Pattern is a powerful and intuitive trading indicator designed to simplify the identification of the Quasimodo (QM) trading pattern. The QM pattern is widely recognized among traders for effectively signaling potential reversals by highlighting key market structures and price action formations. This indicator helps traders easily visualize the QM pattern directly on their charts, making it straightforward even for those who are new to pattern trading. Simple QM Pattern includes dynamic
FREE
RelicusRoad Trading Sessions は MetaTrader 4 および MetaTrader 5 向けのトレーディングセッションインジケーターで、M1、M5、M15 のチャート上に、東京、ロンドン、ニューヨーク各セッションの開始時刻を点線の垂直線でマークします。 各セッションの開始は、当日と過去の平日について、そのセッションの色で線、小さく回転した名前のラベル、イベントマーカーとして表示されます。いずれかにカーソルを合わせると、セッション名と開始時刻が表示されます。インジケーターがマークするのは開始のみで、セッションのレンジ、重なり、終了時刻には色を付けません。 仕組み 読み込み時に、インジケーターはブローカーのサーバー時刻と UTC の差を読み取り、整数時間に丸めてから 1 時間差し引きます。そのうえで、現在の UTC の日付からさかのぼった各平日について、東京のオープンを UTC 23:00、ロンドンのオープンを UTC 07:00、ニューヨークのオープンを UTC 12:00 として、サーバー時刻に変換して配置します。土曜日と日曜日はスキップされます。 T
FREE
About: Get Free Scanner and example Strategies And understand detailed description here: https://www.mql5.com/en/blogs/post/759237 And also get example wrappers from above post. You can make your own wrappers if your indicators have complex conditions or for In-Built MT4 indicators. Features: - Specify your own Custom Indicator - Specify Buffer values and create Variables - Use those Variables to create your own Buy/Sell Conditions - Get Arrows Up/Down Signals - See Arrows Signals in Scanners
Aura Mini Candle Timer - スマート・インタラクティブ・エディション Aura Mini Candle Timerは、チャート上のスペースを最小限に抑えつつ、複数の時間足(MTF)におけるローソク足の残り時間と現在の方向を直感的に表示する軽量なインジケーターです。 本インジケーターの最大の特徴は、その「インタラクティブ(対話型)」な操作性にあります。設定画面を開くことなく、チャート上のタイマーパネルをクリックするだけで、主要な7つの時間足をリアルタイムで切り替えることが可能です。 [主な機能] ワンクリックでの時間足切り替え:タイマーパネルをクリックするたびに、時間足が M1 M5 M15 M30 H1 H4 D1 の順序で即座に切り替わります。 独立した時間足の監視:現在表示しているチャートの時間足に関わらず、タイマー上で選択した特定の時間足の終了時刻や方向を個別に監視できます。 ローソク足の方向に連動する動的な色変化:選択した時間足の現在価格(終値)と始値を比較し、パネルの背景色が直感的に変化します。 陽線(Bullis
FREE
ZigZag WaveSize - ポイント単位の波長に関する情報を追加した、修正された標準 ZigZag インジケーターです。 特徴: 最適化されたオンライン構築ロジック: ラベルは各ティックで最初から再描画されるのではなく、メインの計算と並行して動作し、ZigZag が新しい線を描画したり更新したりするときに最後のラベルのみを描画します。 ポイント計算の別のモードを追加しました: 設定で指定されたポイント数を超えるとラインが構築されます: 手動と自動 (微調整用の係数を使用した ATR による) 最新のものから始めて、任意の数のジグザグ線を色と太さで強調表示するトレンドラインを追加しました。 2 つのカラー レンダリング モードを追加しました: 1) 標準 (上向きの線 - 1 色、下向きの線 - 別の色)。 2) 構造的(上昇または下降の両極端が同時に存在する典型的なトレンド - 1 色) 2 つのアラート モードを追加しました: 1) 新しいジグザグ ラインの出現。 2) 現在のジグザグラインによる最後の極値の突破 平均線サイズとその中央値の値を追加しました。どちらもオプシ
FREE
Necessary for traders: tools and indicators Waves automatically calculate indicators, channel trend trading Perfect trend-wave automatic calculation channel calculation , MT4 Perfect trend-wave automatic calculation channel calculation , MT5 Local Trading copying Easy And Fast Copy , MT4 Easy And Fast Copy , MT5 Local Trading copying For DEMO Easy And Fast Copy , MT4 DEMO Easy And Fast Copy , MT5 DEMO The homeopathic indicator is also called the CCI indicator. The CCI indicator was proposed
FREE
私のMT4・MT5インジケーターをすべて無料で入手 — 方法はこちら 新しいツールの価格   は   $30   で、対象は   発売後最初の1週間   または   最初の3件の購入です !  MQL5のTrading Toolsチャンネル : 私のMQL5チャンネルに参加して、最新情報を受け取ってください AI Channels インジケーターは、クラスタリング分析における強力な機械学習技術である ローリングK-平均クラスタリング を使用して、価格の基礎的なトレンドについてリアルタイムの洞察を提供します。このインジケーターは、クラスタ化された価格データに基づいた適応チャネルを作成し、トレーダーがトレンド方向や市場の状況について情報に基づいた判断を下せるようにします。 インジケーターにはリスク管理に柔軟性を持たせるため、 トレーリングストップオプション も設定内に含まれています。 MT5バージョンを見る:   AI Channels MT5 他の製品を見る:     すべての製品 AI Channelsインジケーターの使い方 各チャネルの極端値は、トレンド方向を判断するための貴重な
FREE
Pattern 3 Candles
Aleksandr Butkov
4.2 (5)
An Expert Advisor based on the 3 candlestick pattern. 1-SL, 2-TP, 3-OFF - 1 pulls up StopLoss. 2 pulls up TakeProfit. 3-disabled. auto SL / TP on hi-low count bars - number of bars for 1-SL, 2-TP expiration on profit - after passing N bars, TP changes expiration on loss - after N bars have passed SL to open an order + commission pips for loss expiration - the number of points for expiration on profit The rest of the settings are intuitive.
FREE
PZ Penta O MT4
PZ TRADING SLU
2.33 (3)
The Penta-O is a 6-point retracement harmonacci pattern which usually precedes big market movements. Penta-O patterns can expand and repaint quite a bit. To make things easier this indicator implements a twist: it waits for a donchian breakout in the right direction before signaling the trade. The end result is an otherwise repainting indicator with a very reliable trading signal. The donchian breakout period is entered as an input. [ Installation Guide | Update Guide | Troubleshooting | FAQ | A
FREE
False Breakout Stochastic to be used with our Elliott Wave Indicator as part of the overall strategy on trading the 5th wave. As we cannot upload multiple files, we have listed this separately. False Breakout Stochastic is best used as a confirmation tool rather than the sole signal indicator The Elliott Wave Indicator Suite is designed around a simple but effective Swing Trading Strategy. The Indicator Suite is great for Stocks, Futures and Forex trading on multiple timeframes You can find the
FREE
Smart Flow - Institutional Aggression Tracker Smart Flow   is a powerful and intuitive indicator designed to read the true market order flow and identify zones of strong institutional aggression. Instead of guessing tops and bottoms, Smart Flow directly paints your chart's candles whenever it detects a relevant directional capital injection, making your trading decisions highly objective. Working Principle The indicator performs an advanced mathematical calculation on every candle to estimate th
FREE
Candle Time (MT4) The Candle Time indicator shows the remaining time for the current candle on the active chart timeframe. It adapts automatically to the chart period and updates on every tick. This is a charting utility; it does not provide trading signals and does not guarantee any profit. Main functions Display the time remaining for the current candle on any timeframe (M1 to MN). Color-coded state: green when price is above the open (up), gray when unchanged, and red when below the open (do
FREE
Range Explosionについて Range Explosionは、市場のレンジを検出し、正確なサポートとレジスタンスゾーンを描画し、ブレイクアウトの機会を正確かつスタイリッシュに特定するための、強力で無料の取引ツールです。 Break Out Explosionプロジェクトの一部として、初心者からプロフェッショナルトレーダーまで信頼できる高度なビジュアルソリューションを提供します。 この製品のMT5バージョンはこちらで入手できます: https://www.mql5.com/en/market/product/153004 ブレイクアウト取引の概念に興味がある場合は、主要トレンド方向のトレンドラインブレイクアウトを検出するための高度なツールをご覧ください: https://www.mql5.com/en/market/product/155132 このインジケーターの矢印に基づいて取引を行うEAが欲しいですか? 下のリンクから $30 で直接ジョブを作成すれば、私が作成いたします: https://www.mql5.com/en/job/new?prefered=eeecad
FREE
Lisek Weis Wave
Darius Hans Lischka
4 (4)
This Weis Wave Volume indicator is a tool to help traders identify the current price trend.  Understanding volume can provide insight into a market's behavior to help you determine its overall health. The most important rule is this: volume precedes price. Typically, before a market price moves, volume comes into play. It has 2 main colors histogram which are green and red. – Green indicates an upward wave. The more the price increases, the bigger the green volume gets. – The red color shows a d
FREE
Triple RSI
Pablo Leonardo Spata
1 (1)
LOOK AT THE FOLLOWING STRATEGY   WITH THIS INDICATOR.   Triple RSI   is a tool that uses the classic Relative Strength Indicator, but in several timeframes to find market reversals.    1.  ️ Idea behind the indicator and its strategy: In Trading, be it Forex or any other asset, the ideal is   to keep it simple, the simpler the better . The   triple RSI   strategy is one of the simple strategies that seek market returns. In our experience, where there is more money to always be won, i
FREE
Market Profile 3
Hussien Abdeltwab Hussien Ryad
3 (2)
Market Profile 3 MetaTrader 4 indicator  — is a classic Market Profile implementation that can show the price density over time, outlining the most important price levels, value area, and control value of a given trading session. This indicator can be attached to timeframes between M1 and D1 and will show the Market Profile for daily, weekly, monthly, or even intraday sessions. Lower timeframes offer higher precision. Higher timeframes are recommended for better visibility. It is also possible t

FREE
外国為替マーケットプロファイル(略してFMP) これは何ではありません: FMPは、従来の文字コード化されたTPO表示ではなく、チャートデータプロファイルの計算全体を表示しません。また、チャートを期間に分割して計算しません。 それが何をするか: 最も重要なことは、FMPインジケーターは、ユーザー定義のスペクトルの左端とユーザー定義のスペクトルの右端の間にあるデータを処理することです。 ユーザーは、インジケーターの両端をマウスで引くだけでスペクトルを定義できます。 インジケーターの右端がライブバーに引き寄せられ、さらに(将来に)引っ張られると、インジケーターは「ライブ」と見なされます(新しいバーで更新されます) インジケーターは、アタッチされているチャートに「アンカー」オブジェクトをドロップし、その後、そのアンカーをハードドライブ上のファイルに関連付けます。 これにより、チャート(またはインジケーター)が閉じられるまで、再起動しても設定が維持された状態で、チャート上で継続的なFMPを実行できます。 FMPインジケーターは、1つのチャート上でそれ自体の多くのインスタンスを実行でき、
FREE
このインジケータは、チャート上に任意のテキストと画像を表示し、マクロによって要求された情報を表示することもできます。 3つのテキストブロックと1つの画像ブロックがあります。フォントの選択、サイズ、色、インデント、配置が可能です。 スクリーンショットをブランド化したり、チャート上に必要な情報を表示したい場合、 UPD1 Watermark は非常に便利なツールとなるでしょう。 設定の説明 。 テキスト設定(3ブロック)。 Text 1, 2, 3 – テキストとマクロを入力します。 Font Name – フォント名を入力します。エラーの場合は、デフォルトのフォントが使用されます。 Font Size – フォント・サイズを指定します。 Font Color – フォント・カラーを指定します。 Corner – オブジェクトのスナップ角度を選択します。 Visual Position – オブジェクトをチャートの前または後ろに配置します。 X – 水平方向のインデント(単位:ピクセル Y – ピクセル単位の垂直方向のインデント。 画像設定(1ブロック)。 Image – 画像を選
FREE
このプロダクトを購入した人は以下も購入しています
Trend SniperX MT4
Sarvarbek Abduvoxobov
5 (5)
Trend Sniper X は、トレーダーがトレンドの方向性と潜在的な反転ポイントを明確かつ正確に特定できるように設計された、MetaTrader 5 用のマルチタイムフレーム・トレンドフォロー指標です。 MT5版はこちら: https://www.mql5.com/en/market/product/181101 価格情報: 現在の価格はプロモーション価格であり、今後のアップデートや新機能の追加に伴い変更される場合があります。 Code2Profit チャンネル マルチタイムフレーム分析で市場をマスターしよう! Trend Sniper Xで勝率を最大化する方法:ルールとセッションのコツ 技術仕様 プラットフォーム MetaTrader 5 インジケータータイプ マルチタイムフレーム・トレンドインジケーター 動作タイムフレーム すべてのチャート時間足(上位足M1~MN1を独立して選択可能) 主要対象銘柄 為替(Forex)、ゴールド(XAUUSD)、その他のCFD 推奨口座 すべての口座タイプ ビジュアル表示 トレンドカラーローソク足(買い/売り/弱い/変化)+ 買い/売りシグナル
「Scalper Vault」は、デイトレードで安定した成果を目指すトレーダーのために設計された、強力かつ充実した機能を備えたトレーディングシステムです。 この高精度なインジケーターは、それ単体で完結するトレーディングシステムとして機能し、FXやバイナリーオプションのトレーダーに、機関投資家レベルの分析を提供します。 ご購入後、ぜひご連絡ください。 トレードのヒントに加え、豪華なボーナスをプレゼントいたします! 「Scalper Vault」を活用すれば、勘に頼った判断や複雑な手動分析は不要です。使いやすいトレード手法に集中し、純粋に「エントリー・決済」という実行フェーズに専念できます。 高精度なトレンドフォロー・シグナル:中核となるアルゴリズムが市場構造を分析し、主要なトレンド方向に沿った高確率なシグナルを提示します。これにより、誤ったエントリーを大幅に削減できます。 精度の高い天井・底の検知:市場の勢いが尽きたポイントをスキャンし、反転の可能性が高いゾーンを特定します。 ギャン(Gann)理論に基づく売買ゾーン:数学的な「ギャン・レベル」を自動的にチャート上に描画します。機関投資家
通貨強さウィザードは、取引を成功させるためのオールインワン ソリューションを提供する非常に強力な指標です。このインジケーターは、複数の時間枠のすべての通貨のデータを使用して、このまたはその外国為替ペアのパワーを計算します。このデータは、使いやすい通貨インデックスと通貨パワーラインの形式で表され、特定の通貨のパワーを確認するために使用できます。 必要なのは、取引したいチャートにインジケーターを接続することだけです。インジケーターは、取引する通貨の実際の強さを示します。このインジケーターは、トレンドに合わせて取引するときに有利に利用できる売買高の圧力の極値も示します。このインジケーターには、フィボナッチに基づく可能なターゲットも表示されます。 このインジケーターは、PUSH 通知を含むあらゆるタイプのアラートを提供します。 購入後ご連絡下さい。私の取引のヒントをあなたと共有し、素晴らしいボーナスインジケーターを無料で提供します! 幸せで有益な取引をお祈りします。
PRO Renko Systemは、特別にRENKOチャートを取引するために設計された高精度の取引システムです。 これは、様々な取引商品に適用することができる普遍的なシステムです。 システムは効果的に正確な逆転信号へのアクセスを与えるいわゆる市場の騒音を中和する。 表示器は非常に使いやすく、信号の生成に責任がある1つの変数だけがあります。 あなたは簡単にお好みの任意の取引ツールとレンコバーのサイズにツールを適応させることができます。 私はいつもあなたが私のソフトウェアで収益性の高い取引を支援するために余分なサポートを提供する準備ができています! 私はあなたに幸せで収益性の高い取引をしたいです! ご購入後にご連絡ください! 私はあなたに私のレンコチャートジェネレータを送信します。 私はまた、私の個人的な推奨事項やシステムの他のモジュールを無料で共有します!
SR Liquidity は、市場の流動性が集中し、価格が最も強く反応する「隠れたゾーン」を可視化するために設計されたトレーディング指標です。こうした流動性の高いエリアは強力なサポート(支持)およびレジスタンス(抵抗)レベルとして機能し、市場が反転する可能性が最も高いポイントを明確に示してくれます。 単なる一般的なサポートラインやレジスタンスラインを描画するのではなく、「SR Liquidity」は実際の価格変動を分析し、売りと買いの圧力が集中するゾーンを特定します。これらは、市場の真の動きを牽引する「流動性のプール(溜まり場)」そのものです。それらをチャート上に直接可視化することで、価格が実際に反応する前に、その動きを予測することが可能になります。つまり、このインジケーターは価格の方向性が変わる可能性を予測するのです。生のプライスアクションを、市場の重要な水準(転換点となり得るポイント)を示す、明確で実用的なロードマップへと変換してくれます。 このインジケーターは、FX、株価指数、貴金属、仮想通貨など、あらゆる銘柄や時間足で使用可能です。 ご購入後、取引手順や無料の優れた追加インジケ
割引は 24 時間後に終了します — 次の価格は$ 69 ZORYK — MetaTrader 4専用 XAUUSDシグナル・トレードプランニングシステム このような経験はありませんか。 ゴールドを分析し、エントリーを待ち、ようやくポジションを持った直後に価格が逆方向へ動く。 早すぎる決済をしてしまったり、Stop Lossを動かしたり、数秒迷っている間にチャンスを逃したりする。 その後、相場は自分が最初に予想していた方向へ進み、目標へ到達する。 問題は常に方向判断ではありません。 本当の問題は、明確な計画がなかったことです。 どこでエントリーすべきか。 どこでトレードの前提が無効になるのか。 近い利益を確保すべきか、より大きな値動きを待つべきか。 現在のsetupが本当に強いのか、それとも無理にトレードを探しているだけなのか。 ゴールドは非常に速く動きます。 正しい分析でも、明確なプランがなければ数秒で悪い判断に変わることがあります。 ZORYKは、その問題を解決するために開発されました。 ZORYKとは ZORYKは、MetaTrader 4とXAU
Atomic Analyst — MetaTrader 4 製品に関するご質問、設定方法、技術サポートについては、MQL5で直接メッセージをお送りください。 このインジケーターは、複雑な市場計算をシンプルな視覚シグナル、色分けされたローソク足、トレンド表示、ストップロスレベル、複数のテイクプロフィットゾーンに変換し、トレーダーが素早く理解して実際の市場環境で使用できるようにします。 主な取引用途: スキャルピングとイントラデイトレード: 素早い判断、明確な矢印、アラート、ローソク足カラー、構造化されたエントリー/エグジットゾーンのために設計されています。 デイトレードとスイングトレード: トレンド方向、強さ、モメンタム、マルチタイムフレーム分析を使って、より大きな市場の動きを追うのに役立ちます。 主な機能: • Price Action、強さ、モメンタム分析 • マルチタイムフレームトレンドスキャナー • 全体トレンド率の計算 • 買いと売りの矢印 • ストップロスと複数のテイクプロフィットレベル • 最大5つのフィボナッチベースのテイクプロフィットレベル • トレーリングストップ
Smart Trend Trading System は、トレンド情報、エントリー・決済シグナル、価格水準をひとつのチャートにまとめて表示する MetaTrader 4 用インジケーターです。 このシステムは、トレンド検出、反転ゾーン、Smart Cloud、トレーリングストップロジック、サポートとレジスタンス、ローソク足の色分け、アラート、マルチタイムフレーム分析など、 10 種類以上のトレーディングツール を 1 つに統合しています。 このシステムは、さまざまな市場環境での取引をサポートするように設計されています。 トレンド相場: 主要トレンドを特定し、押し目を検出し、モメンタムに従い、ストップロスガイドとトレーリングストップオプションを使って、より明確なエントリーを見つけます。 レンジ相場: レンジ状態を検出し、反応ゾーンを特定し、価格が重要なレベルから反応したときに、より明確なシグナルを受け取ります。 スキャルピングとデイトレード: 短期売買の判断をサポートするために、高速シグナル、ローソク足の色、アラート、マルチタイムフレーム確認を使用します。 主な機能: • 10 種
SIO Oscillator:自己最適化型セミバリアンス・インバランス・オシレーター インジケーターをご購入いただくと、それをベースにしたエキスパートアドバイザー(EA)を無料でお受け取りいただけます。 多くのオシレーターは、すべての価格変動を同じように扱います。SIOは上昇圧力と下降圧力を分けて捉え、その間のインバランス(不均衡)を測定することで、買い手と売り手のどちらが本当に相場を支配しているかを示します。インバランスが極値に達すると、SIOはエントリー、ストップロス(Stop Loss)、テイクプロフィット(Take Profit)の水準を伴う明確なシグナルを表示します。 SIOの大きな特長は、固定パラメーターに頼らないことです。内蔵の自己最適化機能が、現在の銘柄と時間足に適したパラメーターを継続的に探索し、使用する前に検証します。 2つのシグナルモード 平均回帰(Mean Reversion):インバランスの極値で取引し、均衡への回帰を狙います。 トレンドフォロー(Trend Following):持続的で優勢なインバランスの方向に取引します。 自動モード:最適化機能が直近のデ
Quant Direction
Georgios Kalomoiropoulos
Quant Direction は、3次元の市場分析ツールです。完全に客観的なアルゴリズムベースの市場分析を提供し、様々なパラメータにわたる正確なパーセンテージ偏差を同時に算出します。高度なAI搭載モデリングツールで開発され、厳密なテストを経て開発されたこのアルゴリズムは、かつてない精度で市場を分析するように設計されています。プラットフォーム上では、あらゆる通貨ペアや金融商品を分析できます。 短期取引、デイトレード、スイングトレードなど、どのような取引スタイルに も、Quant Directionは最適な選択肢です。 オペレーターの本当の利点 Quant Directionの真の利点は、感情、眼精疲労、過剰分析を完全に排除できる点にあります。方向性を探るために何十ものチャートを手作業で精査したり、自分の好みを常に疑ったりする必要がなくなります。このシステムは、8つの時間間隔(5ヶ月から月単位まで)をミリ秒単位で処理します。あらゆる瞬間に市場を支配している主体を正確に明らかにし、常に成功確率が最も高い方向で取引できるようにします。 市場分析の3つの側面 このアルゴリズムは市場を3つの
トレンドラインプロ   市場の真の方向転換点を理解するのに役立ちます。この指標は、真のトレンド反転と主要プレーヤーが再び参入するポイントを示します。 分かりますか     BOSライン   複雑な設定や不要なノイズなしに、より長い時間足でのトレンドの変化と重要なレベルを把握できます。シグナルは再描画されず、バーが閉じた後もチャート上に残ります。 VERSION MT 5     -     RFI LEVELS PRO インジケーター と組み合わせることで、その潜在能力を最大限に発揮します。 インジケーターが示す内容: 本当の変化   トレンド(BOSライン) 一度シグナルが現れたら、それは有効です!これは、リペイント機能を持つインジケーターとの重要な違いです。リペイント機能を持つインジケーターは、シグナルを発した後、それを変更し、資金の損失につながる可能性があります。これにより、より高い確率と精度で市場に参入できます。また、矢印が現れた後、目標値(利益確定)に達するか、反転シグナルが現れるまで、ローソク足の色を変更する機能もあります。 繰り返しエントリ       主要プレーヤーの
AW Prime Oscillator
AW Trading Software Limited
5 (1)
2つのオシレーターを組み合わせたもの。 1 つ目はエントリーポイントを表示し、2 つ目は現在のトレンドを表示します。このインジケーターは、すべての高速オシレーター信号または現在のトレンドの方向のみの信号の 2 つのモードで、オシレーター信号を矢印で表示できます。マルチタイムフレームパネルと 3 種類のシグナル通知があります。 利点: デイトレードやスキャルピング取引に適しています トレンドフィルタリング シンプルかつ高感度なセットアップ マルチタイムフレームパネル アドバイザーへの統合に適しています。 あらゆるシンボルとあらゆるタイムフレームに対応 3種類の通知 MT5 version ->  HERE  / Problem solving ->  HERE 指標戦略 このインジケーターは 2 つの異なるオシレーターで構成されます。 遅いトレンド ライン (太い) - インジケーターの高レベルが上から下に交差する場合、それは下降トレンドのインジケーターであり、下側の水平レベル (インジケーターの低レベル) が下から上に交差する場合、それは下降トレンドのインジケーターです。上昇傾向。さら
M1 Sniper
Oleg Rodin
4.97 (30)
M1 SNIPER は使いやすいトレーディングインジケーターシステムです。M1時間足向けに設計された矢印インジケーターです。M1時間足でのスキャルピングのためのスタンドアロンシステムとして、また既存のトレーディングシステムの一部としても使用できます。このトレーディングシステムはM1時間足での取引に特化して設計されていますが、他の時間足でも使用できます。元々、この手法はXAUUSDとBTCUSDの取引用に設計しましたが、他の市場においても役立つと考えています。 インジケーターのシグナルは、トレンドの方向と逆方向に取引できます。インジケーターのシグナルを利用して両方向に取引するのに役立つ特別な取引テクニックをご紹介します。この手法は、特別な動的なサポートとレジスタンスの価格帯を利用することに基づいています。 ご購入後、M1 SNIPER矢印インジケーターをすぐにダウンロードできます。さらに、M1 SNIPERツールのすべてのユーザーに、以下のスクリーンショットに表示されているApollo Dynamic SRインジケーターを無料で提供しています。この2つのインジケーターを組み合わせることで
Hidden Cycles
Lev Vladimirovic Marushkin
5 (1)
The Only 100% Universal Tool! Stop trading against nature! This is your chance to secure the only indicator rooted in the absolute laws that govern the entire universe. Most tools guess—this one reveals the truth. Buy another toy or buy the truth. Your choice... Based on Universal Laws — NOT Some Guy’s Algorithm: Let the market adjust to the Hidden Cycles Geometry — not the other way around. Most indicators are based on a man-made formula. They often lag, fail over time, or need constant re-o
Price & Time Market Structure Indicator A professional market structure tool that analyzes waves through both price and time — not price alone. Main Description NeoWave PRO is a professional market structure indicator for MetaTrader 4 designed for traders who want to move beyond traditional one-dimensional wave tools such as ZigZag, swing indicators, and basic high/low systems. Most wave indicators analyze only one thing: Price. But a real market wave is not only a price movement. A true wave de
このインディケータは、異なる期間のフラクタルの価格構造を調べて、市場で起こり得る反転ポイントを決定し、すでに基本的または技術的な評価モデルを持っているポジショントレーダーにタイミングを提供します。弟の リバーサルフラクタル とは異なり、このインジケーターは選択された期間のためにリバーサルを逃すことはなく、ジグザグ形式でリバーサルフラクタルを見つけます。 [ インストールガイド | 更新ガイド | トラブルシューティング | よくある質問 | すべての製品 ] ターニングポイントは長いトレンドを開始できます インジケーターは再描画されていません あらゆる種類のアラートを実装します カスタマイズ可能な色とサイズ フラクタルは奇数番目のバーのフォーメーションであり、フォーメーションの最上位または最下位の中間バーであり、フラクタル内のすべてのバーが閉じるとインディケーターが描画されるため、このインジケーターはリアクティブまたは遅れ信号です。ただし、既存の方向バイアスを持つトレーダーは、この指標が非常に有用であり、早期のエントリポイントを取得します。 このインディケーターは、ボイルダウンされた
CRT Multi-Timeframe Market Structure & Liquidity Sweep Indicator Non-Repainting | Multi-Asset | MT5 Version Available MT5 Version:   https://www.mql5.com/en/market/product/162075 Full User Guide — explains what each feature does and why:   https://www.mql5.com/en/blogs/post/767525 Quick Start User Guide  — explains how to configure and in what order:  https://www.mql5.com/en/blogs/post/767540 Indicator Overview CRT Ghost Candle HTF Fractal is a complete institutional-grade market structure too
Gann Time Clusters Indicator This indicator is based on W. D. Gann's Square of 9 method for the time axis. It uses past market reversal points and applies the mathematical formula for Gann's Square of 9 and then makes projections into the future. A date/time where future projections line up is called a 'time cluster'. These time clusters are drawn as vertical lines on the right side of the chart where the market has not advanced to yet. A time cluster will result in a market reversal point (ex.
Neuro Poseidon is a new indicator by Daria Rezueva. It combines precise trading signals with adaptive TP/SL levels - creating best possible trades as a result! Message me and get  Neuro Poseidon Assistant  as a gift to automize your trading process! What makes it stand out? 1. Proven profitability on all assets and timeframes 2. Only confirmed BUY and SELL signals present on the chart 3. Adaptive TP & SL levels generated by the software for each trade 4. Easy to understand - suitable for all
This is a professional chart indicator designed for traders focused on stability and clear price action. It helps filter market noise and provides clear visual entry and exit zones for your trading decisions. Core Features: Strictly Non-Repainting: The system is built with strict non-repaint logic. What you see on the chart is the true historical performance. Confirmed Signals: Signals are triggered and confirmed only after the candle closes . Once a trading arrow appears on a closed candle, it
Forex Breath System は、あらゆる市場で使用できるトレンドベースの取引システムです。このシステムは、通貨、金属、商品、指数、仮想通貨、さらには株式でも使用できます。任意の時間枠でも使用できます。システムは普遍的です。トレンドを示し、トレンドに伴う矢印シグナルを提供します。このインジケーターは、シグナルがトレンドの方向に現れたときに特別なタイプのアラートを提供することもできるため、トレンド取引が簡単になります。 このインジケーターは、理解しにくい設定に対処する必要がないため、非常に使いやすいです。 チャートに添付するだけで取引の準備が完了します。どのような取引スタイルを好む場合でも、このシステムは市場の方向性とトレンド方向への可能なエントリーポイントを確認するのに役立ちます。 このインジケーターは、PUSH 通知を含むあらゆる種類のアラートを提供します。 取引手順と素晴らしいボーナスを入手するには、購入後に私にご連絡ください。 幸せで収益性の高い取引をお祈りします!
Advanced Supply Demand
Bernhard Schweigert
4.91 (302)
現在30%オフ 初心者にもエキスパートトレーダーにも最適なソリューション このインジケーターは独自の機能と新しい公式を多数内蔵しており、ユニークで高品質かつ手頃な取引ツールです。このアップデートでは、2つの時間枠ゾーンを表示できるようになります。より長いTFだけでなく、チャートTFとより長いTF(ネストゾーンを表示)の両方を表示できます。すべてのSupply Demandトレーダーの皆さんのお気に召すはずです。:) 重要情報の公開 Advanced Supply Demandの可能性を最大化するには、 https://www.mql5.com/ja/blogs/post/720245 にアクセスしてください。   エントリーまたはターゲットの正確なトリガーポイントを正確に特定できれば取引がどのように改善されるか想像してみてください。新しい基盤となるアルゴリズムに基づいて構築されているため、買い手と売り手の間の潜在的な不均衡をさらに簡単に特定できます。これは、最も強い需要と供給のゾーンと、過去のパフォーマンス(古いゾーンを表示)がグラフィカルに表現されるためです。これらの機能は、最適な
Super Signal – Skyblade Edition プロ仕様のノンリペイント / ノーラグ・トレンドシグナルシステム。卓越した勝率を実現 | MT4 / MT5 対応 1分足、5分足、15分足などの低い時間足で最も効果を発揮します。 主な特徴: Super Signal – Skyblade Edition は、トレンド取引に特化したスマートなシグナルシステムです。マルチレイヤーのフィルターロジックを用いて、明確な方向性と実際のモメンタムに支えられた強力なトレンドのみを検出します。 このシステムは 天井や底を予測するものではありません 。次の3つの条件がすべて満たされた場合にのみシグナルを発生させます: 明確なトレンド方向 モメンタムの増加 健全なボラティリティ構造 市場セッションに基づく流動性分析と組み合わせることで、シグナルの精度とタイミングがさらに向上します。 シグナルの特性: すべての矢印シグナルは 100% 非リペイント / 遅延なし 一度出現したシグナルは固定され、点滅・消失しません チャート上の矢印、情報パネル、ポップアップ通知、音声アラート、プッシュ通知
Liquidity Scalper System: インジケーター形式の流動性ベースのトレーディングシステムです。 多くのインジケーターは矢印を表示するだけで、ストップをどこに置くか、目標はどこか、そのシグナルを信頼してよいかはトレーダー自身が判断しなければなりません。Liquidity Scalper System はトレードの全サイクルをカバーします。流動性プールを見つけ、そのブレイク時にシグナルを出し、Entry、Stop Loss、3つのターゲットを即座に計算し、パネルに統計と新しいデータでの検証結果を表示します。設定はシステムが自動で選び、毎日更新します。 仕組み 1. システムが流動性プールを見つけます。市場参加者のストップ注文が集まっている価格水準です。 2. 価格がプールをブレイクし、そのブレイクが値動きの強さ(必要に応じて出来高)で確認されると、チャートに BUY または SELL の矢印が表示されます。 3. Entry、Stop Loss、TP1、TP2、TP3 の水準がゾーンの塗りつぶしとともに即座に描画されます。 4. 右側に流動性プロファイルが表示され、価
Tokyo Indicatorは、トレンドの方向性、潜在的な取引シグナル、および市場状況を視覚的に分かりやすく表示します。 色分けされた階段状のトレンドラインにより、強気局面(青色)と弱気局面(マゼンタ色)が明確に区別されます。トレンドの変化に合わせて表示される方向矢印は、売買の好機を強調します。 統合されたダッシュボードには、現在のシグナル、市場のバイアス(傾向)、モメンタム、ボラティリティ、シグナルの品質がひと目で分かるようにまとめられています。これにより、トレーダーはパネルを切り替えることなく、価格変動(プライスアクション)とインジケーターの数値を照らし合わせて分析を行うことができます。 すっきりとしたチャート表示と簡潔な市場概要により、Tokyo Indicatorはトレンド分析や取引判断における体系的なアプローチをサポートします。 あらゆる時間足や銘柄に対応しており、特に金(ゴールド)の取引に適しています。 トレンド スキャナーの強力なサポートを利用して、無料のインジケーターを入手し、プライバシーを守ります。あーみー!     設定 ShowHUD - チャート上のパネ
Gann Made Easy は、ミスター・ギャンの理論を使用した取引の最良の原則に基づいた、プロフェッショナルで使いやすい外国為替取引システムです。 W・D・ガン。このインジケーターは、ストップロスとテイクプロフィットレベルを含む正確な買いと売りのシグナルを提供します。 PUSH通知を利用して外出先でも取引可能です。 ご購入後、取引方法の説明と優れた追加インジケーターを無料で入手するには、私にご連絡ください! おそらく、ギャンの取引手法についてはすでに何度も聞いたことがあるでしょう。通常、ギャンの理論は初心者のトレーダーだけでなく、すでにある程度の取引経験がある人にとっても非常に複雑なものです。なぜなら、ギャンの取引手法は理論的にはそれほど簡単に適用できるものではないからです。私はその知識を磨き、最良の原則を私の外国為替インジケーターに組み込むために数年を費やしました。 このインジケーターは非常に簡単に適用できます。必要なのは、それをチャートに添付し、簡単な取引推奨事項に従うだけです。このインジケーターは常に市場分析の仕事を行い、取引の機会を探します。適切なエントリーポイントを検出す
Break and Retest Hunter MT4 is a powerful MetaTrader 5 indicator designed to automatically identify support and resistance levels, breakout structures, and potential retest opportunities in real time. Bonus Indicator: After purchasing Break and Retest Hunter , contact me to receive Trade Indicator Assistant EA completely free as a bonus utility. $65 for the next 10 copies . Next price is $120.  Combining adaptive market analysis, clear BUY/SELL signals, Fibonacci-based profit targets, and a pre
現在40%オフ 初心者やエキスパートトレーダーに最適なソリューション! このインジケーターは、独自の機能と新しい計算式を取り入れた、ユニークで高品質、かつ手頃な価格のトレーディングツールです。たった1枚のチャートで28の為替ペアの通貨強度を読み取ることができます。新しいトレンドやスキャルピングチャンスの引き金となるポイントを正確に特定することができるので、あなたのトレードがどのように改善されるか想像してみてください。 ユーザーマニュアルはこちら  https://www.mql5.com/en/blogs/post/697384 これが最初の1本、オリジナルだ! 価値のないクローンを買わないでください。 特別な サブウィンドウの矢印で強い通貨の勢いを表示 GAPがあなたのトレードを導く! 基準通貨や気配値が売られすぎ・買われすぎのゾーン(外相フィボナッチレベル)にあるとき、個別チャートのメインウィンドウに警告表示。 通貨がレンジの外側から反落した場合、プルバック/リバーサルのアラート。 クロスパターンの特別なアラート 複数の時間枠を選択可能で、トレンドを素早く確認できます
Gold Channel is a volatility-based indicator, developed with a specific timing algorithm for the XAUUSD pair, which consists of finding possible corrections in the market. This indicator shows two outer lines, an inner line (retracement line) and an arrow sign, where the theory of the channel is to help identify overbought and oversold conditions in the market. The market price will generally fall between the boundaries of the channel. If prices touch or move outside the channel it is a tradi
現在30%OFF! 初心者やエキスパートトレーダーのためのベストソリューション! このダッシュボードソフトウェアは、28の通貨ペアで動作しています。それは私達の主要な指標(高度な通貨の強さ28と高度な通貨インパルス)の2に基づいています。それは全体の外国為替市場の大きい概観を与えます。それは、すべての(9)時間枠で28の外国為替ペアのための高度な通貨の強さの値、通貨の動きの速度と信号を示しています。チャート上で1つのインディケータを使用して市場全体を観察し、トレンドやスキャルピングの機会をピンポイントで見つけることができたら、あなたのトレードがどのように改善されるか想像してみてください。 このインディケータには、強い通貨と弱い通貨の識別、潜在的な取引の識別と確認がより簡単になるような機能が搭載されています。このインディケータは、通貨の強さや弱さが増加しているか減少しているか、また、すべての時間枠でどのように機能しているかをグラフィカルに表示します。 新機能として、現在の市場環境の変化に適応するダイナミックなマーケットフィボナッチレベルが追加され、すでに当社のAdvanced
作者のその他のプロダクト
Anchored VWAP (AVWAP) for MT4 – Ultimate Drag & Drop Volume-Weighted Average Price Indicator Unlock true institutional volume analysis with the definitive Anchored VWAP (AVWAP) indicator designed specifically for MetaTrader 4. Featuring a fully interactive, draggable vertical line right on your chart, this tool lets you anchor your volume-weighted calculations to any significant market event instantly. Simply click and drag the anchor line to any swing low, swing high, market structure shift,
FREE
Gartley Patterns (Harmonic Scanner) Gartley Patterns is an institutional-grade technical overlay engineered to automatically map complex harmonic price structures and swing imbalances across active execution cycles. By processing market geometry dynamically through strict multi-timeframe swing filters, this utility completely eliminates manual calculation errors and gives traders an instant visual panel of high-probability reversal zones on a single chart window. Utilizing specialized sing

FREE
Fast VWAP
Jeffrey Lloyd Lauzon
Fast VWAP  (Highly Optimized Intraday Dashboard) The Fast VWAP Matrix is an institutional-grade technical overlay designed to isolate volume-weighted fair value and intraday structural balance across active execution cycles. By processing price action dynamically through volume-weighting thresholds, this utility completely eliminates calculation delay and gives traders an instant visual panel of asset distribution on a single window. Utilizing specialized single-pass memory arrays, this matrix
FREE
The EMA Trader System is a technical overlay designed to isolate trend continuation and structural balance across active execution cycles. By processing price action dynamically through multi-timeframe moving average thresholds and robust slope filters, this utility completely eliminates calculation delay and gives traders an instant visual HUD dashboard of live trade signals on a single window. Utilizing specialized single-pass memory arrays, this system tracks multi-period EMA loops and highe
FREE
Dual Slope Moving Averages & Support | Resistance Dashboard Professional Institutional-Grade Indicator for MetaTrader 4 (MT4) Transform your chart analysis with Trend Bars With Moving Averages, an elite institutional utility engineered by a professional C++ systems programmer. Designed for high-speed MQL4 execution, this indicator blends multi-slope Moving Average color-coding with a built-in, interactive Support & Resistance Reversal Dashboard. Whether you trade Forex majors or index futures,
FREE
MTF Commodity Channel Index (CCI) Matrix (Free Advanced Trend Scanner Dashboard) The Multi-Timeframe Commodity Channel Index (CCI) Matrix is an institutional-grade technical scanner designed to evaluate cyclical trend momentum and structural threshold breakouts across 4 distinct execution timeframes simultaneously[cite: 18, 19]. By monitoring the M15, H1, H4, and D1 intervals concurrently[cite: 18, 19], this utility completely eliminates multi-chart cluttering and gives traders an instant execu
FREE
MTF DeMarker Exhaustion Matrix (Free Advanced Exhaustion Dashboard) The Multi-Timeframe DeMarker Exhaustion Matrix is an institutional-grade technical scanner designed to isolate subtle price exhaustion zones and impending market reversals across multiple execution cycles simultaneously. By monitoring the M15, H1, H4, and D1 intervals concurrently[cite: 4], this utility completely eliminates multi-chart cluttering and gives traders an instant executive matrix of trend exhaustion and structural
FREE
MTF Rate of Change (ROC) Matrix (Free Advanced Price Velocity Dashboard) The Multi-Timeframe Rate of Change (ROC) Matrix is an institutional-grade technical scanner designed to evaluate pure historical price velocity across 4 distinct execution timeframes simultaneously. By monitoring the M15, H1, H4, and D1 intervals concurrently[cite: 18], this utility completely eliminates multi-chart cluttering and gives traders an instant executive matrix of momentum acceleration and structural trend force
FREE
MTF Ultimate Oscillator Matrix (Free Advanced Multi-Timeframe Dashboard) The Multi-Timeframe Ultimate Oscillator Matrix is an institutional-grade technical scanner designed to evaluate momentum convergence across three distinct lookback horizons on four execution timeframes simultaneously. By monitoring the M15, H1, H4, and D1 intervals concurrently, this utility completely eliminates multi-chart cluttering and gives traders an instant executive matrix of weighted momentum expansion and overbou
FREE
Master Trading Matrix (Free Advanced Multi-Indicator Dashboard) The Master Trading Matrix is an institutional-grade technical convergence scanner designed to combine 10 foundational momentum, trend, and exhaustion engines into a single, unified execution display. By integrating RSI, Stochastic, CCI, Williams %R, DeMarker, Momentum, RVI, Chande Momentum, Rate of Change, and Ultimate Oscillator into an executive matrix, this utility eliminates multi-window clutter and provides a complete, real-ti
FREE
MTF Relative Strength Index (RSI) Matrix (Free Advanced Momentum Dashboard) The Multi-Timeframe Relative Strength Index (RSI) Matrix is an institutional-grade technical scanner designed to evaluate momentum and overbought/oversold conditions across 4 distinct execution timeframes simultaneously[cite: 5, 6]. By monitoring the M15, H1, H4, and D1 intervals concurrently[cite: 5, 6], this utility completely eliminates multi-chart cluttering and gives traders an instant executive matrix of momentum
FREE
MTF Chande Momentum Matrix (Free Advanced Momentum Dashboard) The Multi-Timeframe Chande Momentum Matrix is an institutional-grade technical scanner designed to isolate raw market momentum and structural exhaustion across multiple execution cycles simultaneously. By monitoring the M15, H1, H4, and D1 intervals concurrently, this utility completely eliminates multi-chart cluttering and gives traders an instant executive matrix of trend structural health on a single window. Unlike common smoothe
FREE
MTF Momentum Oscillator Matrix (Free Advanced Velocity Dashboard) The Multi-Timeframe Momentum Oscillator Matrix is an institutional-grade technical scanner designed to map out the velocity of price change across clean rolling history blocks simultaneously. By monitoring the M15, H1, H4, and D1 intervals concurrently, this utility completely eliminates multi-chart cluttering and gives traders an instant executive matrix of trend speed and directional acceleration on a single window. Instead of
FREE
MTF Relative Vigor Index (RVI) Matrix (Free Advanced Trend Health Dashboard) The Multi-Timeframe Relative Vigor Index (RVI) Matrix is an institutional-grade technical scanner designed to evaluate directional trend vigor and conviction across 4 distinct execution timeframes simultaneously[cite: 10, 11]. By monitoring the M15, H1, H4, and D1 intervals concurrently[cite: 10, 11], this utility completely eliminates multi-chart cluttering and gives traders an instant executive matrix of trend health
FREE
MTF Stochastic Matrix (Free Advanced Momentum Crossover Dashboard) The Multi-Timeframe Stochastic Matrix is an institutional-grade technical scanner designed to evaluate momentum cycles, %K/%D line crossovers, and extreme overbought/oversold boundaries across 4 distinct execution timeframes simultaneously[cite: 14, 15]. By monitoring the M15, H1, H4, and D1 intervals concurrently[cite: 14, 15], this utility completely eliminates multi-chart cluttering and gives traders an instant executive matr
FREE
MTF Simple Moving Average (Free Institutional Moving Average Overlay) The Multi-Timeframe Simple Moving Average (MTF SMA) is an institutional-grade technical utility designed to project higher-timeframe trend baselines directly onto your lower-timeframe execution charts. Developed by a C++ systems programmer specializing in high-speed MQL4 architecture, this indicator provides traders with seamless market structure visibility without requiring multiple open windows or manual chart toggling.
FREE
MTF Williams %R Matrix (Free Advanced Multi-Timeframe Dashboard) The Multi-Timeframe Williams %R Matrix is an institutional-grade technical scanner designed to evaluate momentum extremes and key boundary dynamics across four execution timeframes simultaneously[cite: 5, 6]. By monitoring the M15, H1, H4, and D1 intervals concurrently, this utility completely eliminates multi-chart cluttering and gives traders an instant executive matrix of price relative to recent high-low ranges on a single win
FREE
フィルタ:
レビューなし
レビューに返信