Volume Comparator

Volume Comparator is an institutional-grade intraday volume analysis utility designed to benchmark market activity against historical norms for the exact time of day.

Standard volume indicators evaluate volume strictly in isolation or against immediately preceding bars. However, financial markets follow systematic diurnal cycles: regular opening session bursts, scheduled algorithmic liquidity handoffs, and subdued quiet hours. A high-volume bar during the London Open is completely normal, whereas that identical volume level during the late Asian session represents extraordinary market activity.

Volume Comparator eliminates this ambiguity by creating an intraday-aware empirical baseline for every discrete time slot of the trading day.


### HOW IT WORKS


1. Discrete Time-Slot Segmentation: Automatically divides the 24-hour day into fixed intraday slots matching your chart's timeframe (e.g., 24 slots on H1, 96 slots on M15).
2. Dynamic Rolling Baseline: Computes a rolling average of past market activity specifically for each time slot over the designated lookback period (default: 10 trading days / two weeks). Sundays and anomalous zero-volume bars are excluded from the baseline calculations.
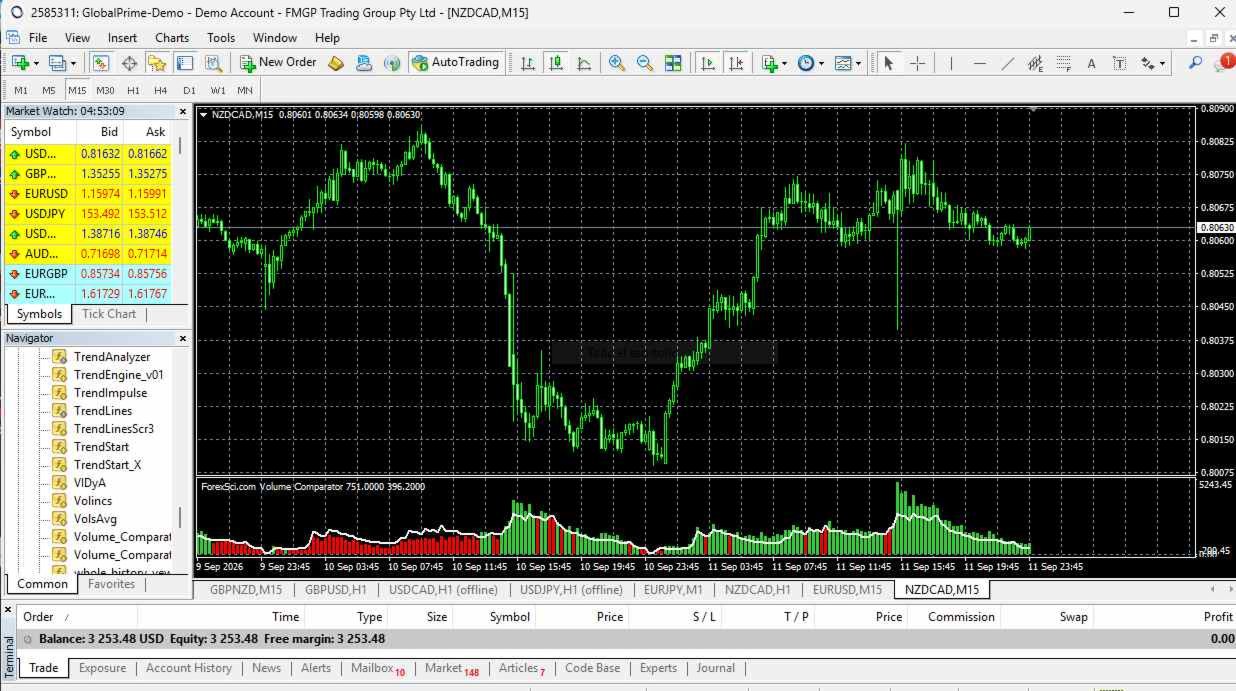
3. Immediate Visual Contrast: Plots real-time tick activity against the historical threshold:
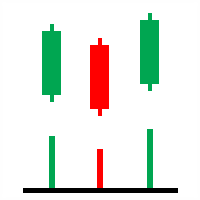
   * LimeGreen Histogram: Current volume exceeds the historical baseline, confirming elevated participation and institutional interest.
   * Red Histogram: Current volume remains below the expected baseline, signaling subdued momentum or lack of conviction.
   * Continuous White Line: Real-time expected baseline threshold across each consecutive bar.


### STRATEGIC APPLICATIONS

* Breakout Validation: Confirm breakouts beyond key support or resistance levels. Breakouts accompanied by above-average volume (LimeGreen) demonstrate genuine institutional participation, whereas low-volume breakouts (Red) warn of potential fakeouts and liquidity traps.
* Algorithmic Noise Filtering: Identify whether market spikes reflect true conviction or merely routine, pre-scheduled executions that occur naturally at that minute.
* Climax & Exhaustion Identification: Detect buying or selling climaxes when extreme LimeGreen surges materialize following extended trends, signaling potential institutional exhaustion.


### INPUT PARAMETERS

* InpDaysToAverage: Historical lookback window in trading days used to establish the intraday benchmark (Default: 10).
* InpUseAlerts: Enable/Disable native MetaTrader pop-up and sound alerts when unusual volume activity occurs (Default: false).
* InpAlertMultiplier: Sensitivity threshold for volume alerts, expressed as a multiple of the expected historical average (Default: 1.5).


### SPECIFICATIONS & RECOMMENDATIONS

* Supported Timeframes: Engineered for intraday charts from M1 up to H4 (M1, M5, M15, M30, H1, H4).
* Multi-Asset Compatibility: Functions with Forex currency pairs, Metals (XAUUSD, XAGUSD), Indices, and Commodities.
* Lightweight & Pure Native MQL: High-efficiency execution with zero third-party DLL dependencies or external libraries.
Recommended products
This is a volume profile where you can customize the time period you want. You can do this with a line or choose automatic functions such as showing the volume from the last time period. The indicator also shows the maximum volume value (VPOC - VOLUME POINT OF CONTROL) and the average value, colors and settings you can adjust as you like, there are many possibilities. If you need an indicator that shows the constant volume time frames there is  ...HERE... Volume Profile  is an advanced charting
Introducing the Delta Volume Profile Indicator - Unleash the Power of Institutional Precision!  Technical Indicator: Are you ready to trade like the pros? The Delta Volume Profile Indicator is no ordinary tool. It’s a high-precision, cutting-edge indicator that puts the power of institutional-grade trading in your hands. This unique indicator analyses delta volume distribution in real-time, revealing the market's hidden buy/sell imbalances that the biggest financial institutions rely on to antic
QQE Mod MT4
Filip Valkovic
The   Quantitative Qualitative Estimation   (QQE) indicator is derived from Wilder’s famous Relative Strength Index (RSI). In essence, the QQE is a heavily smoothed RSI. Modification of this version: (   converted from tradingview   script by Mihkell00, original from Glaz, 100% identical output) So there are Two QQEs. One that is shown on the chart as columns, and the other "hidden" in the background which also has a 50 MA   bollinger band   acting as a zero line. When both of them agree - y
Dublgis
Ivan Simonika
Here is a sensitive indicator for Dublgis professionals. It is built on completely new algorithms and is more efficient, on any timeframes, since it filters random price movements. Finds and visually displays price reversal points. This tool can be used as confirmation when making a deal, as well as to determine the direction of the trend and its strength. The indicator was developed as a complement to a number of our other trading tools.
Market Profile Osw MT4
William Oswaldo Mayorga Urduy
User Manual: Market Profile Osw Market Profile Osw is an advanced auction analysis tool that allows you to visualize volume and price distribution over a specific period. Unlike conventional candlestick charts, this system reveals where the most trading activity occurred, identifying psychological support and resistance zones based on real market participation. 1. Parameters Guide (Inputs Menu) General Settings Show Market Profile: Enables or disables the profile visualization on the chart. Vo
Delta AG
Yurij Kozhevnikov
The difference between the arithmetic and geometric means at the specified range. Since the greater is the difference between the values, the greater the resulting figure is, actually the indicator shows volatility fluctuations. The arithmetic mean of a certain number of values ​​is the sum of the values ​​divided by their number. The geometric mean is the root of the power of the number of values ​​extracted from the product of these values. If all values ​​are equal, the arithmetic mean and th
ContiStat
Matous Bartl
Brief description The ContiStat indicator calculate statistic frequency of green (up) and red (down) movement in the chart and determine movement dynamics (silver curve). There are two key parameters to understand the ContiStat principle: Block height and Block count . The ContiStat engine convert instrument price chart move to Blocks of constant height (price) regardles of how much time it take. Example 1: Block height is set to 50. DE30 index price make move from 15230 to 15443 in an hour. 4 g
Smart Adaptive Trend Flow MT4 Professional adaptive trend, market structure, price levels and flow analysis indicator for MetaTrader 4. Would you like to test it before purchasing? Request a fully functional trial version by sending us a private message through MQL5.com and evaluate the indicator directly on your own charts. A Complete Market View Smart Adaptive Trend Flow MT4 combines several analytical components in a single indicator: Adaptive trend analysis. BULLISH and BEARISH market regim

Fasb1a
Li Qiang Tang
欢迎来到本产品界面 指标,简单可观,直接加载即可,对于趋势有一定的把握及反转。 本指标可在Taxcr EA工具中使用,作为开初始单依据,单次运用,非循环开单!伙伴们可以去了解 axcr EA工具。 IWelcome to the product interface Indicators, simple and considerable, can be loaded directly, and have a certain grasp and reversal of the trend. This indicator can be used in Taxcr EA tool as the basis for initial billing, single use, non cyclic billing!
MyZtrade Margin Zones (NKZ) The indicator shows on the chart the zones where major players — market makers and central banks — concentrate their activity, as well as key price levels derived from extremes. **Zones:** - market maker / central bank percentage zones - **5%, 10%, 15%, 20%, 25%** and fine 0.5%…5%; - NKZ zones from highs and lows - 1/4, 1/2, 3/4, 100%, 200%; - ATR zones of higher timeframes (H4, D1, W1, MN). **Features:** - automatic zone building from the latest price extremes; -
Ersi
Iurii Tokman
Ersi   The indicator shows overbought and oversold zones. Zones can be adjusted by levels, set in the settings. Settings: Period_I   - averaging period for calculating the indicator; Applied_Price   - used price; Percent_Coefficient   - percentage coefficient; Count_Bars   - the number of bars to display the indicator; Overbought_level   - overbought zone level; Oversold_level   - oversold zone level; Overbought_color   - color of the overbought zone; Oversold_color   - color of the oversold zon
This indicator shows the high volume zone. From the last minutes that you set yourself, the image of the volume zone is generated on an ongoing basis. The indicator also shows the V-Poc, Average Volumen and V-WAP lines. if you are using high intervals you must enter a large number of minutes. the zone builds itself up as the chart moves. if you want to build a zone from:  last day - 1440 minutes,    last week - 10080 minutes, ... etc. If you need an indicator that shows the constant volume zone
The Trend Ultimate Indicator is designed for visualizing and analyzing market trends, allowing traders to quickly assess current market tendencies. It is particularly useful for: Determining the duration of the current trend (bullish or bearish). Providing a clear visualization of price behavior relative to key moving averages and the MACD indicator. Supporting decision-making based on histogram dynamics (trend direction and intensity). Trend Ultimate does not guarantee profit but assists trader
MQL5 Blogs = https://www.mql5.com/en/blogs/post/776873 MT4 Version = https://www.mql5.com/en/market/product/199357 MT5 Version = https://www.mql5.com/en/market/product/199358 Pressure Breakout [tambangEA] is a professional MetaTrader indicator designed to identify price-pressure formations, evaluate directional dominance inside the formation, and confirm breakouts using a structured combination of wick behavior, volatility, volume proxy, and price expansion. Instead of reacting to a single can
Currency Strength Oscillator MT4
Narayanan Mohanan Mohanan Krishnan
Currency Strength Oscillator for MetaTrader 4 A relative currency strength indicator that plots the history of the eight majors. This currency strength oscillator plots the relative strength of the eight major currencies as a history, decomposed from the 28 major pairs. While a standard currency strength meter tells you where things stand right now, this shows how they got there — which currency has been strengthening, which has rolled over, and where the ranking changed hands. All eight series
CorrelationCalculator
Sofia Mohammad Rashed
The Forex Correlation Indicator is a powerful tool designed to analyze and display the correlation between different major forex pairs in the market. This indicator helps traders identify relationships and trends between currency pairs, allowing for more informed trading decisions. Key Features: Displays correlation coefficients between pairs. Visualizes correlation strength through color-coded indicators. Customizable settings for timeframes and correlation calculations. User-friendly interfac
CME Nexus Prime - Auction Market Theory & Volume Profile CME Nexus Prime is an advanced analytical indicator for MetaTrader 4 combining Auction Market Theory, session volume profiling, structural reference levels, and volume participation analysis into a single interactive decision-support panel.  Note: This is an analysis tool only and does not execute trades automatically. NEXUS RAIL INTERFACE The indicator features an interactive chart panel divided into four working sections: - LIVE: Sum
Dragon Trend
Marco Fornero Monia
Trend indicator with Multi-level Take Profit indication. Possibility to setting in normal or Aggressive mode. Fully customizable in color and alarm. Very useful to understand the trend and where price could go No need to explain, see the images. You'll se the trend, 3 possibly target and stop loss (or other take profit) when the trend change. You can adopt various strategy, for example. 1) Open trade and try to close it at target 1 2) Open 2 trade, close 1 at target 1, stop in profit for 2 and t
The Dow Theory structure of the chart — in one look. DowTheoryVisual labels every swing high and low as HH, HL, LH or LL and draws a zigzag colored by the trend: blue for an uptrend, red for a downtrend, gray for a range. The panel keeps showing the trend of the current chart and of two higher timeframes side by side. Features HH / HL / LH / LL labels: each swing high and low is compared with the previous one. Trend-colored zigzag: up blue, down red, range gray. The color changes on the bar wher
The indicator allows you to determine the current price direction and market volatility. This version of the Traders Dynamic Index  (TDI) has the redrawing of the historical data eliminated, the algorithm calculation speed optimized, more external parameters for a more precise adjustments, and its functionalities extended: added the selection of the initial oscillator and the smoothing methods of the averages. Parameters: Mode Osc - estimation oscillator selection; Period Osc - the calculation p
Определения текущей тенденции одна из самых важных задач трейдера не зависимо от стиля торговли. Индикатор  Price Detect   Volume поможет с достаточно высокой вероятностью это сделать. Price Detect Volume  - индикатор распознавания тенденции, использующий авторский алгоритм расчета, использующий объемы. Показания индикатора не изменяются не при каких условиях. Также с помощью индикатора можно наблюдать за коррекцией цены в сторону глобального тренда, определять возможные границы окончания отката
Cloud Power
Andriy Sydoruk
Implementation of indication of trend movement with moments for potential stops in the Cloud Power indicator. The transition to the shadow warns of a possible reversal. The entry of the price inside the shadow speaks of a flat movement. The indicator tracks the market trend with unmatched reliability, ignoring sharp market fluctuations and noise around the average price. Simple, visual and efficient use. The indicator does not redraw and does not lag. It can be easily used as an independent t
Rira VWAP Bands
Vitor Palmeira Abbehusen
VWAP Bands gives you the regular Volume-Weighted Average Price and also the deviation bands. Use this indicator to see the possible amount of market movement, find support and resistance lines, find good spots for entry and exit,  and the most important feature is to find possible pivot points. This indicator has been mathematically improved by Rira team. The calculation begins at the start of each trading day
Implement
Vitalii Zakharuk
5 (1)
Implement analyzes market dynamics for pivot points. If you want to learn how to spot the correct reversals for consistently likely profitable trading, buy this indicator. Shows favorable moments of entering the market in stripes. Ready-made trading system. The principle of operation of the indicator is to automatically determine the current state of the market when placed on a chart, analyze historical data based on historical data and display instructions for further actions on the trader's
Market Profile
Artem Titarenko
5 (1)
The "Market Profile" indicator displays the profiles and volumes of periods – weekly, daily, session (8-hour), 4-hour, hour, summary. The VAH/VAL price area is automatically highlighted by a dotted line for each profile (except for the summary). The indicator includes chroma Delta, which colors the profile areas. The areas of prevailing Buys is colored in green, that of Sells - in red. The intensity histogram features blue/red respectively. In the filter mode, the indicator displays the volume a
Activity Meter
Svyatoslav Kucher
Activity Meter is designed to identify the activity of sellers or buyers, to detect the current trend, and to search for extrema, where the price may reverse and the current trend may be replaced by the opposite one. The indicator works with any symbol provided that you have sufficient history data for a timeframe the indicator is launched at. It is recommended to launch Activity Meter on M1, М5, М15. Alerts Alerts are activated when the indicator histogram crosses the dynamic level upwards for
MetaForecast M4
Vahidreza Heidar Gholami
5 (2)
MetaForecast predicts and visualizes the future of any market based on the harmonics in price data. While the market is not always predictable, if there is a pattern in the price, MetaForecast can predict the future as accurately as possible. Compared to other similar products, Metaforecast can generate more accurate results by analyzing market trends. Input Parameters Past size Specifies the number of bars that MetaForecast uses to create a model for generating future predictions. The model is
GT_Volume - это универсальный индикатор подходящий для всех валютных пар. Показывает текущий объем на горизонтальных уровнях. Объемы рисуются по мере движения цены. Все просто и нет ни чего лишнего. Индикатор очень помогает быстро определить сильные уровни сопротивления и поддержки, работает шустро! Есть возможность поменять цвет и выбрать день на котором отображать объемы.
VWAP Indicator MT4
Kyra Nickaline Watson-gordon
5 (2)
Description : VWAP (Volume-Weighted Average Price) is the ratio of the value traded to total volume traded over a particular time horizon. It is a measure of the average price at which pair is traded over the trading horizon. Read More. All Symbols and All Timeframes are supported. Indicator Inputs :     VWAP Mode : Mode of VWAP Calculation. Options can be selected : Single,Session,Daily,Weekly,Monthly     Volumes : Real Volumes,Tick Volumes     Price Type : Used price for calculating.
Colored Volume
Seyed Ali Tabatabaei Lotfi
The Colored Volume is a simple, yet useful indicator that paints the color of the volume based on the price direction.  If the price has increased, the volume will be shown in green. If the price has decreased, the volume will be shown in red. This indicator will make it super easy for traders to track volume bars based on price movements. (The settings of the volume bars including line width and color can be manually changed by the trader.)
Buyers of this product also purchase
Trend SniperX MT4
Sarvarbek Abduvoxobov
5 (5)
Trend Sniper X is a multi-timeframe trend-following indicator for MetaTrader 5 that helps traders identify trend direction and potential reversal points with clarity and precision. For MT5: https://www.mql5.com/en/market/product/181101 Price Information: The current price is promotional and is subject to change as upcoming updates and new features are released. Code2Profit Channel Master the Market with Multi-Timeframe Analysis! How to Maximize Your Win Rate with Trend Sniper X: Key Rules & Sess
Zoryk Gold mt4
Reda El Koutbane
5 (3)
discount ends soon original price 69 $ ZORYK — Advanced XAUUSD Signal System for MetaTrader 4 You know the feeling. You spend time analyzing gold. You wait for the entry. You finally open the trade, and price immediately moves against you. You close too early, move the Stop Loss, or hesitate for a few seconds. Then the market reaches the exact destination you originally expected without you. The direction was not always the problem. The real problem was uncertainty. You did not know exactl
PRO Renko System
Oleg Rodin
5 (31)
PRO Renko System is a highly accurate trading system specially designed for trading RENKO charts. The ARROWS and Trend Indicators DO NOT REPAINT! The system effectively neutralizes so called market noise giving you access to accurate reversal signals. The indicator is very easy to use and has only one parameter responsible for signal generation. You can easily adapt the tool to any trading instrument of your choice and the size of the renko bar. I am always ready to provide extra support to help
Currency Strength Wizard is a very powerful indicator that provides you with all-in-one solution for successful trading. The indicator calculates the power of this or that forex pair using the data of all currencies on multiple time frames. This data is represented in a form of easy to use currency index and currency power lines which you can use to see the power of this or that currency. All you need is attach the indicator to the chart you want to trade and the indicator will show you real str
Atomic Analyst
Issam Kassas
5 (14)
Atomic Analyst — MetaTrader 4 For product questions, setup guidance, or technical support, message me directly here on MQL5. The indicator turns complex market calculations into simple visual signals, color-coded candles, trend readings, stop-loss levels, and multiple take-profit zones that traders can understand quickly and use in real market conditions. Main Trading Uses: Scalping and intraday trading: Designed for fast decision-making, clear arrows, alerts, candle colors, and structured entry
Gann Made Easy
Oleg Rodin
4.84 (173)
Gann Made Easy is a professional and easy to use Forex trading system which is based on the best principles of trading using the theory of W.D. Gann. The indicator provides accurate BUY and SELL signals including Stop Loss and Take Profit levels. You can trade even on the go using PUSH notifications. PLEASE CONTACT ME AFTER PURCHASE TO GET TRADING  INSTRUCTIONS   AND GREAT EXTRA INDICATORS  FOR FREE! Probably you already heard about the Gann trading methods before. Usually the Gann theory is a
Smart Trend Trading System is a chart indicator for MetaTrader 4 that brings trend information, entry and exit signals, and price levels into one workspace. It combines 10+ trading tools into one system, including trend detection, reversal zones, smart cloud, trailing stop logic, support and resistance, candle coloring, alerts, and multi-timeframe analysis. The system is designed to help you trade different market conditions: Trending markets: Identify the main trend, detect pullbacks, follow mo
Top Bottom Tracker is an indicator based on sophisticated algorithms that analyse the market trend and can detect the highs and lows of the trend / MT5 version . The price will progressively increase until it reaches 500$. Next price --> $99 Features No repainting This indicator does not change its values when new data arrives Trading pairs All forex pairs Timeframe     All timeframes Parameters ==== Indicator configuration ==== Configuration parameter // 40 (The higher the value, the
Scalper Vault
Oleg Rodin
5 (40)
Scalper Vault is a powerful, fully-equipped trading system designed for traders who want to achieve consistency in intraday trading . This high-precision indicator serves as a complete, standalone trading system that delivers institutional-grade analysis for both Forex and Binary Options traders. PLEASE CONTACT ME AFTER PURCHASE TO GET MY TRADING TIPS PLUS A GREAT BONUS! By eliminating the guesswork and complex manual analysis, Scalper Vault allows you to focus purely on execution using easy t
Neuro Poseidon MT4
Daria Rezueva
4.74 (46)
Neuro Poseidon is a new indicator by Daria Rezueva. It combines precise trading signals with adaptive TP/SL levels - creating best possible trades as a result! Message me and get  Neuro Poseidon Assistant  as a gift to automize your trading process! What makes it stand out? 1. Proven profitability on all assets and timeframes 2. Only confirmed BUY and SELL signals present on the chart 3. Adaptive TP & SL levels generated by the software for each trade 4. Easy to understand - suitable for all
Tokyo mt4 Indicator
Vasiliy Strukov
5 (9)
Tokyo Indicator provides a clear visual overview of trend direction, potential trading signals, and market conditions. Its colour-coded, stepped trend line distinguishes bullish phases in blue from bearish phases in magenta. Matching directional arrows highlight potential buying and selling opportunities when the displayed trend changes. An integrated dashboard brings together the current signal, market bias, momentum, volatility, and signal quality in one convenient view. This allows traders t
Liquidity Scalper System: a liquidity-based trading system in indicator form. Most indicators only show an arrow, and the trader then has to decide where the stop goes, where the target is and whether the signal can be trusted at all. Liquidity Scalper System covers the full trade cycle: it finds liquidity pools, gives a signal when they are broken, immediately calculates Entry, Stop Loss and three targets, and shows statistics and out-of-sample test results on the panel. The system picks its o
Trading Special – 30% OFF Best Solution for any Newbie or Expert Trader! This dashboard software is working on 28 currency pairs plus one. It is based on 2 of our main indicators (Advanced Currency Strength 28 and Advanced Currency Impulse). It gives a great overview of the entire Forex market plus Gold or 1 indices. It shows Advanced Currency Strength values, currency speed of movement and signals for 28 Forex pairs in all (9) timeframes. Imagine how your trading will improve when you can watch
SR Liquidity
Oleg Rodin
5 (2)
SR Liquidity is a trading indicator designed to reveal the hidden zones where market liquidity concentrates and price reacts most strongly. These special liquidity areas act as powerful support and resistance levels, giving you a clear map of where the market is most likely to reverse. Instead of drawing ordinary Support/Resistance lines, SR Liquidity analyzes real price behavior to detect the zones where buying and selling pressure accumulate. These are actually the pools of liquidity that driv
AW Prime Oscillator
AW Trading Software Limited
5 (1)
A combination of two oscillators. The first one displays the entry points, the second shows the current trend . The indicator can display oscillator signals by arrows in two modes, all fast oscillator signals or signals only in the direction of the current trend. It has a multi-timeframe panel and three types of signal notifications. Benefits: Suitable for day and scalping trading Trend filtering Simple and sensitive setup Multi-timeframe panel Suitable for integration into an advisor. Works on
M1 Sniper
Oleg Rodin
4.97 (30)
M1 SNIPER  is an easy to use trading indicator system. It is an arrow indicator which is designed for M1 time frame. The indicator can be used as a standalone system for scalping on M1 time frame and it can be used as a part of your existing trading system. Though this trading system was designed specifically for short-term trading, it still can be helpful for all traders. This trading system can be used with any forex pair and time frame, though lower time frames are recommended from M1 up to M
CRT Candle Range Theory HTF MT4 - Ultimate CRT Indicator: Advanced ICT Concepts and Malaysian SnR Trading System Master the Market Maker's Footprints with the Most Advanced Candle Range Theory Indicator. Unlock the true power of Smart Money Concepts (SMC) and trade precisely like the institutions with the Ultimate CRT Indicator. Built exclusively for serious traders, this indicator automates the highly effective Candle Range Theory (CRT), a core pillar of ICT Concepts (Inner Circle Trader), and
Cycles Predictor Indicator This indicator uses past market cycles to predict future price movements. The indicator scans through past data and considers  combinations  of cycles. When cycles  coincide  at the same future date/time then it is considered a valid future prediction. The predictions are drawn as vertical lines on the right side of the chart in the future. A prediction will often result in type of candle (ex. bull or bear) and/or a reversal point (ex. bottom or top) forming at this ex
GoldRush Trend Arrow Signal V1.6 The GoldRush Trend Arrow Signal indicator V1.6 continues to provide precise, real-time trend analysis tailored for high-speed, short-term scalpers in XAU/USD , but it now has additional features and improved efficiency and reliability. Built specifically for the 1-minute time frame, this tool displays directional arrows for clear entry points, allowing scalpers to navigate volatile market conditions with confidence. The indicator consists of PRIMARY and SECONDARY
Break and Retest Hunter MT4 is a powerful MetaTrader 5 indicator designed to automatically identify support and resistance levels, breakout structures, and potential retest opportunities in real time. Bonus Indicator: After purchasing Break and Retest Hunter , contact me to receive Trade Indicator Assistant EA completely free as a bonus utility. $65 for the next 10 copies . Next price is $120.  Combining adaptive market analysis, clear BUY/SELL signals, Fibonacci-based profit targets, and a pre
ForexTrendMT4
Andriy Sydoruk
5 (1)
ForexTrendMT4 Indicator: A Reliable Tool for Market Tracking The ForexTrendMT4 indicator offers reliable market trend tracking, filtering out sudden fluctuations and market noise. This tool helps identify trends and signals favorable entry points into the market using arrows. It is suitable for both scalping on shorter timeframes and long-term trading strategies. Based on the principles of technical analysis, ForexTrendMT4 takes into account the cyclical nature of the market. Key Features and A
CRT Multi-Timeframe Market Structure & Liquidity Sweep Indicator Non-Repainting | Multi-Asset | MT5 Version Available MT5 Version:   https://www.mql5.com/en/market/product/162075 Full User Guide — explains what each feature does and why:   https://www.mql5.com/en/blogs/post/767525 Quick Start User Guide  — explains how to configure and in what order:  https://www.mql5.com/en/blogs/post/767540 Indicator Overview CRT Ghost Candle HTF Fractal is a complete institutional-grade market structure too
Super Signal – Skyblade Edition Professional No-Repaint / No-Lag Trend Signal System with Exceptional Win Rate | For MT4 / MT5 It works best on lower timeframes, such as 1-minute, 5-minute, and 15-minute charts. Core Features: Super Signal – Skyblade Edition is a smart signal system designed specifically for trend trading. It applies a multi-layered confirmation mechanism to detect only strong, directional moves supported by real momentum. This system does not attempt to predict tops or bottoms
Trading Special –40% OFF Best Solution for any Newbie or Expert Trader! This Indicator is a unique, high quality and affordable trading tool because we have incorporated a number of proprietary features and a new formula. With only ONE chart you can read Currency Strength for 28 Forex pairs! Imagine how your trading will improve because you are able to pinpoint the exact trigger point of a new trend or scalping opportunity? User manual: click here Looking for the MT5 version? Click here: https:/
Volume Orderflow Profile
Suvashish Halder
5 (2)
Introducing Volume Orderflow Profile , a versatile tool designed to help traders visualize and understand the dynamics of buying and selling pressure within a specified lookback period. Perfect for those looking to gain deeper insights into volume-based market behavior! MT5 Version -  https://www.mql5.com/en/market/product/122657 The indicator gathers data on high and low prices, along with buy and sell volumes, over a user-defined period. It calculates the maximum and minimum prices during this
Smart Price Action Concepts — MetaTrader 4 For product questions, setup guidance, or technical support, message me directly here on MQL5. Smart Money Concepts SMC  Inner Circle Trading ICT  Price Action PA and Institutional Trading IT Real time market structure and swing structure highs and lows ( HH HL LL LH ) Real time internal and swing supply and demand order blocks Premium Equilibrium and Discount Zones Automatic Fibonacci Detection with 2 Options (current swing or previous swing ) Equal hi
VWAP Ultimate Pro MT4 – Persistent Anchored VWAP | Session VWAP | Dynamic Bands & Smart Alerts Bring an Advanced Professional VWAP Workflow to the Classic MetaTrader 4 Platform WHY TRADERS CHOOSE VWAP ULTIMATE PRO MT4? VWAP (Volume-Weighted Average Price) is a widely used benchmark for evaluating fair value, session bias and price positioning. VWAP Ultimate Pro MT4 delivers a complete VWAP workflow optimised for the MT4 architecture, including persistent Anchored VWAP, multiple VWAP periods,
This indicator works on MT4 and is very easy to use. When you receive a signal from it, you wait for that candle with the signal to close and you enter your trade at the beginning of the next new candle . A red arrow means sell and a green arrow means buy. All arrows comes with Alert  like for easy identification of trade signal. Are you okay with that? 1 minute candle 1 minute expire
Trend Lines PRO
Roman Podpora
5 (2)
TREND LINES PRO    helps understand where the market is truly changing direction. The indicator shows real trend reversals and points where major players re-enter. You see   BOS lines   Trend changes and key levels on higher timeframes — without complex settings or unnecessary noise. Signals don't repaint and remain on the chart after the bar closes. VERSION MT 5     -     Reveals its maximum potential when paired with the   RFI LEVELS PRO  indicator What the indicator shows: Real shifts   tren
Advanced Supply Demand
Bernhard Schweigert
4.91 (302)
Trading Special – 30% OFF Best Solution for any Newbie or Expert Trader! This indicator is a unique, high quality and affordable trading tool because we have incorporated a number of proprietary features and a new formula. With this update, you will be able to show double timeframe zones. You will not only be able to show a higher TF but to show both, the chart TF, PLUS the higher TF: SHOWING NESTED ZONES. All Supply Demand traders will love it. :) Important Information Revealed Maximize the pot
More from author
Statistical Edge Calculator
Eugenio Garcia Pastoriza
Do you know your true mathematical trading edge, or are you just relying on a temporary run of luck? A rising account balance can be deceptive. Oversized positions, favorable market regimes, or isolated winning streaks often mask deeply flawed strategies. The Statistical Edge Calculator removes all guesswork by auditing your terminal's closed trade history and calculating your true mathematical expectancy, win rates, and directional performance in seconds. Zero manual data entry. Zero external
Risk Controlled Trading
Eugenio Garcia Pastoriza
Professional on-chart risk management and automatic lot size calculator for MetaTrader. Stop calculating lot sizes manually on external calculators while the market moves away from your entry price. Risk Controlled Volume integrates dynamic position sizing, visual interactive stop-loss lines, and one-click order execution directly onto your chart screen. Execute orders with mathematical certainty that your defined risk tolerance will never be breached. ========================================
Slippage Execution Monitor
Eugenio Garcia Pastoriza
Overview Slippage Execution Monitor is a utility panel designed for traders who require precise transparency regarding order execution quality. While traditional post-analysis tools rely on closed trading history where the initial click quote has already been lost, Slippage Execution Monitor captures the exact Bid/Ask prices locally at the very instant you send the order and benchmarks it against the broker fill price. This allows you to accurately measure latency slippage, liquidity gaps, an
Spread Guardian
Eugenio Garcia Pastoriza
Spread Guardian is a professional broker execution auditing utility designed to monitor and log real-time Bid/Ask spreads and volatility directly on your chart. While brokers often advertise fixed or typical tight spreads, true market execution costs fluctuate continuously during liquidity shifts, major macroeconomic releases, and daily rollover windows (21:00–23:00 GMT). Spread Guardian provides complete empirical transparency regarding your actual trading costs. ### KEY FEATURES * Tick-by
Candle Lengths Analyzer
Eugenio Garcia Pastoriza
Candle Lengths Analyze r is an institutional-grade quantitative utility that models and measures how financial price volatility, candle range, and body displacement scale across all timeframes. Financial markets do not expand linearly. By mathematically separating extreme high-to-low ranges (Bar Length) from net open-to-close directional progress (Body Length), this tool reveals the underlying diffusive power-law behavior of any financial asset, replacing subjective chart inspection with empiri
Statistical Edge Analyzer
Eugenio Garcia Pastoriza
Do you know your true mathematical trading edge, or are you just relying on a temporary run of luck? A rising account balance can be deceptive. Oversized positions, favorable market regimes, or isolated winning streaks often mask deeply flawed strategies. The Statistical Edge Calculator removes all guesswork by auditing your terminal's closed trade history and calculating your true mathematical expectancy, win rates, and directional performance in seconds. Zero manual data entry. Zero external
Risk Controlled Trades
Eugenio Garcia Pastoriza
Professional on-chart risk management and automatic lot size calculator for MetaTrader. Stop calculating lot sizes manually on external calculators while the market moves away from your entry price. Risk Controlled Volume integrates dynamic position sizing, visual interactive stop-loss lines, and one-click order execution directly onto your chart screen. Execute orders with mathematical certainty that your defined risk tolerance will never be breached. ========================================
True Slippage Monitor
Eugenio Garcia Pastoriza
Overview Slippage Execution Monitor is a utility panel designed for traders who require precise transparency regarding order execution quality. While traditional post-analysis tools rely on closed trading history where the initial click quote has already been lost, Slippage Execution Monitor captures the exact Bid/Ask prices locally at the very instant you send the order and benchmarks it against the broker fill price. This allows you to accurately measure latency slippage, liquidity gaps, an
Spread Sentinel
Eugenio Garcia Pastoriza
Spread Sentinel is a professional broker execution auditing utility designed to monitor and log real-time Bid/Ask spreads and volatility directly on your chart, now fully optimized for the MetaTrader 5 (MT5) multi-threaded environment. While brokers often advertise fixed or typical tight spreads, true market execution costs fluctuate continuously during liquidity shifts, major macroeconomic releases, and daily rollover windows (21: 00–23: 00 GMT). Spread Sentinel provides complete empirical tran
Volume Comparator MT5
Eugenio Garcia Pastoriza
Volume Comparator is an institutional-grade intraday volume analysis utility designed to benchmark market activity against historical norms for the exact time of day, fully optimized for the MetaTrader 5 (MT5) platform. Standard volume indicators evaluate volume strictly in isolation or against immediately preceding bars. However, financial markets follow systematic diurnal cycles: regular opening session bursts, scheduled algorithmic liquidity handoffs, and subdued quiet hours. A high-volume b
Candle Lengths Analyzer MT5
Eugenio Garcia Pastoriza
Candle Lengths Analyzer is an institutional-grade quantitative utility that models and measures how financial price volatility, candle range, and body displacement scale across all timeframes, now fully optimized for the MetaTrader 5 (MT5) multi-threaded architecture. Financial markets do not expand linearly. By mathematically separating extreme high-to-low ranges (Bar Length) from net open-to-close directional progress (Body Length), this tool reveals the underlying diffusive power-law behavio
Filter:
No reviews
Reply to review