Volume Comparator
- Indicadores
- Versão: 3.0
- Ativações: 5

Volume Comparator is an institutional-grade intraday volume analysis utility designed to benchmark market activity against historical norms for the exact time of day.
Standard volume indicators evaluate volume strictly in isolation or against immediately preceding bars. However, financial markets follow systematic diurnal cycles: regular opening session bursts, scheduled algorithmic liquidity handoffs, and subdued quiet hours. A high-volume bar during the London Open is completely normal, whereas that identical volume level during the late Asian session represents extraordinary market activity.
Volume Comparator eliminates this ambiguity by creating an intraday-aware empirical baseline for every discrete time slot of the trading day.
### HOW IT WORKS
1. Discrete Time-Slot Segmentation: Automatically divides the 24-hour day into fixed intraday slots matching your chart's timeframe (e.g., 24 slots on H1, 96 slots on M15).
2. Dynamic Rolling Baseline: Computes a rolling average of past market activity specifically for each time slot over the designated lookback period (default: 10 trading days / two weeks). Sundays and anomalous zero-volume bars are excluded from the baseline calculations.
3. Immediate Visual Contrast: Plots real-time tick activity against the historical threshold:
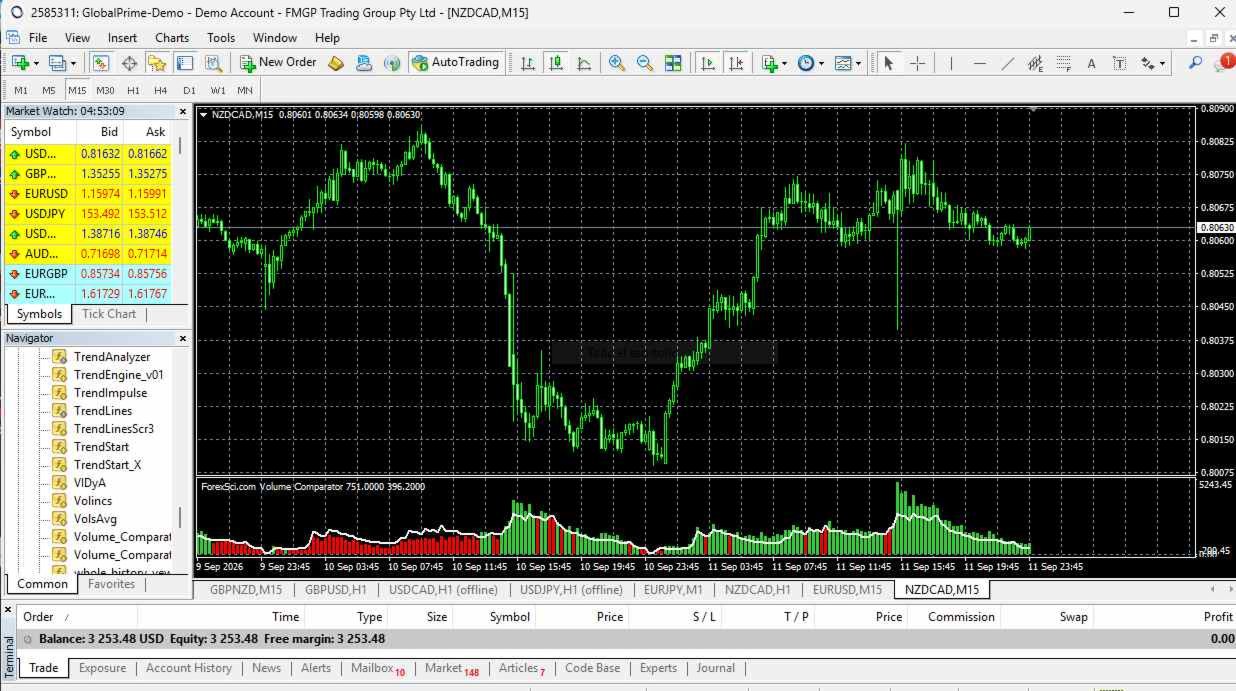
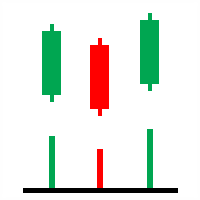
* LimeGreen Histogram: Current volume exceeds the historical baseline, confirming elevated participation and institutional interest.
* Red Histogram: Current volume remains below the expected baseline, signaling subdued momentum or lack of conviction.
* Continuous White Line: Real-time expected baseline threshold across each consecutive bar.
### STRATEGIC APPLICATIONS
* Breakout Validation: Confirm breakouts beyond key support or resistance levels. Breakouts accompanied by above-average volume (LimeGreen) demonstrate genuine institutional participation, whereas low-volume breakouts (Red) warn of potential fakeouts and liquidity traps.
* Algorithmic Noise Filtering: Identify whether market spikes reflect true conviction or merely routine, pre-scheduled executions that occur naturally at that minute.
* Climax & Exhaustion Identification: Detect buying or selling climaxes when extreme LimeGreen surges materialize following extended trends, signaling potential institutional exhaustion.
### INPUT PARAMETERS
* InpDaysToAverage: Historical lookback window in trading days used to establish the intraday benchmark (Default: 10).
* InpUseAlerts: Enable/Disable native MetaTrader pop-up and sound alerts when unusual volume activity occurs (Default: false).
* InpAlertMultiplier: Sensitivity threshold for volume alerts, expressed as a multiple of the expected historical average (Default: 1.5).
### SPECIFICATIONS & RECOMMENDATIONS
* Supported Timeframes: Engineered for intraday charts from M1 up to H4 (M1, M5, M15, M30, H1, H4).
* Multi-Asset Compatibility: Functions with Forex currency pairs, Metals (XAUUSD, XAGUSD), Indices, and Commodities.
* Lightweight & Pure Native MQL: High-efficiency execution with zero third-party DLL dependencies or external libraries.