Mako VWAP
- Indicators
- Version: 1.60
- Activations: 10

MAKO VWAP - Anchored VWAP with Standard Deviation Bands and HUD Panel
THE PAIN
Every trader knows price revolves around a "fair" value, but few can measure it clearly. A plain VWAP shows the volume-weighted average, yet it does not tell you how far price has already moved away from it. Without that measure, it is hard to know whether a move is still normal or already stretched, and traders end up buying tops, selling bottoms or entering too late. Calculating bands by hand is tedious, and changing symbol or period means starting over.
THE SOLUTION
MAKO VWAP is an indicator that plots the VWAP anchored at the start of the period you choose, with standard deviation bands around it. You see, right on the chart, where the average value is and how far price has moved from it. It does NOT open or close orders: it is a market reading tool, not a trading robot.
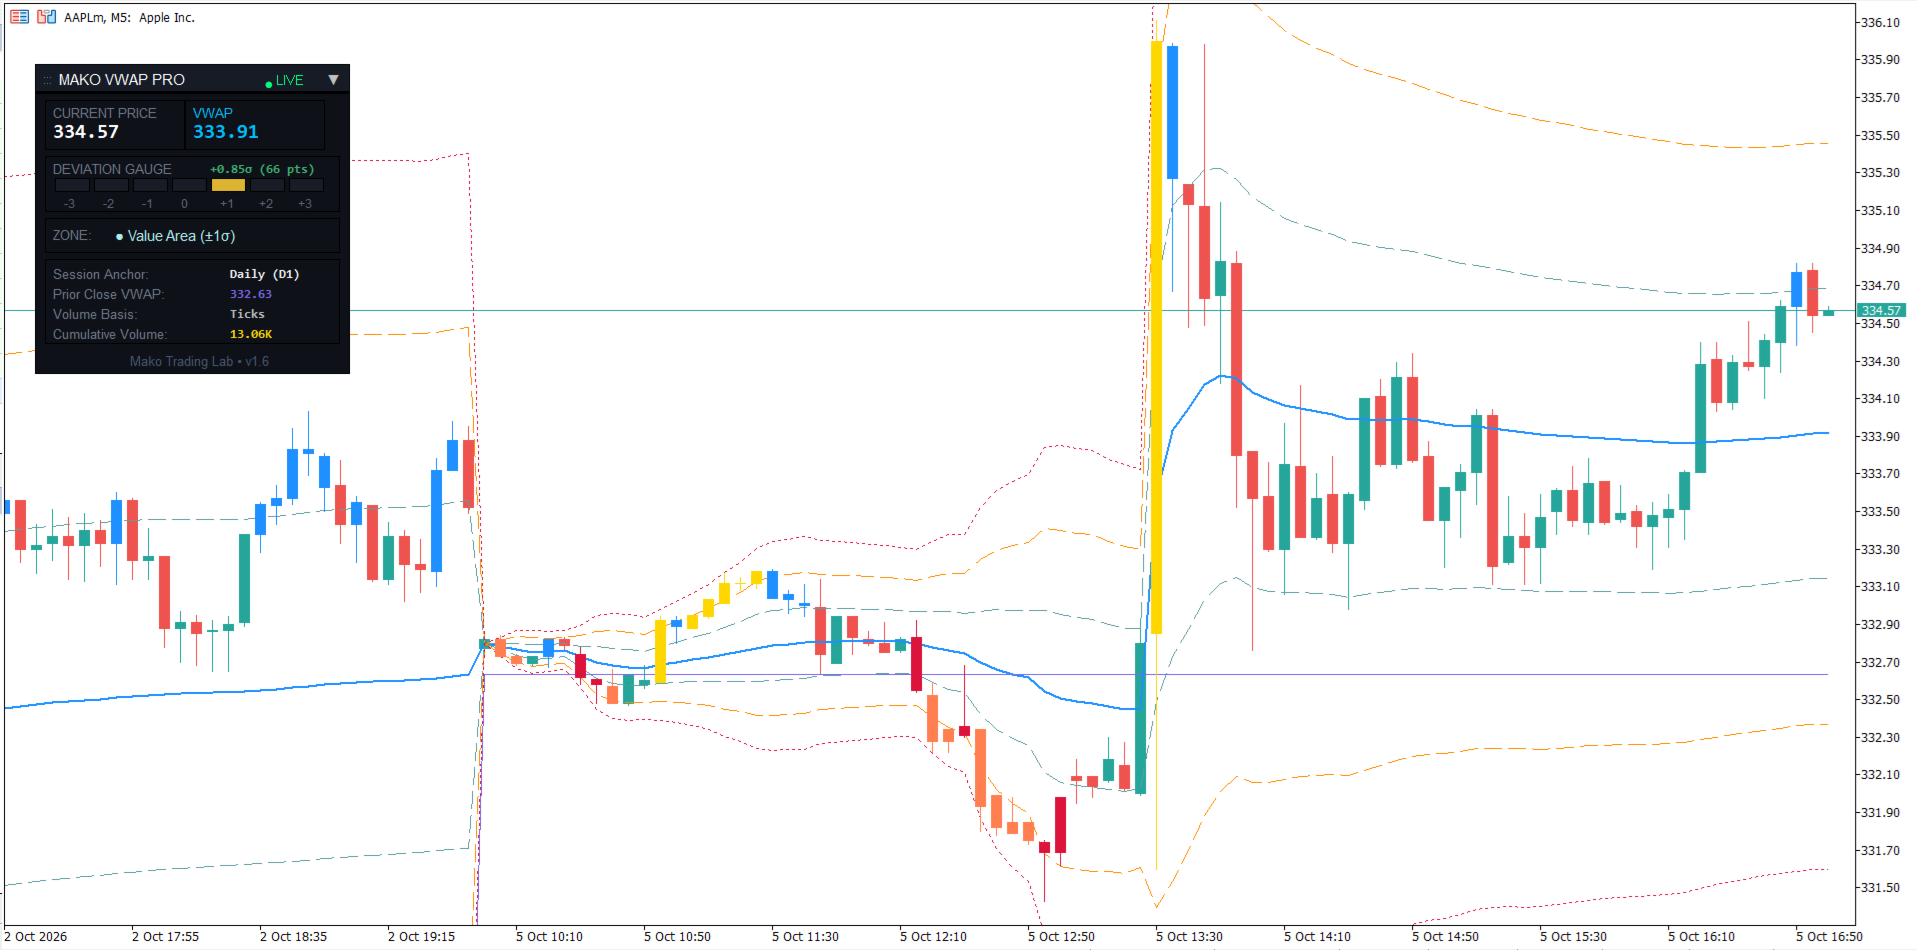
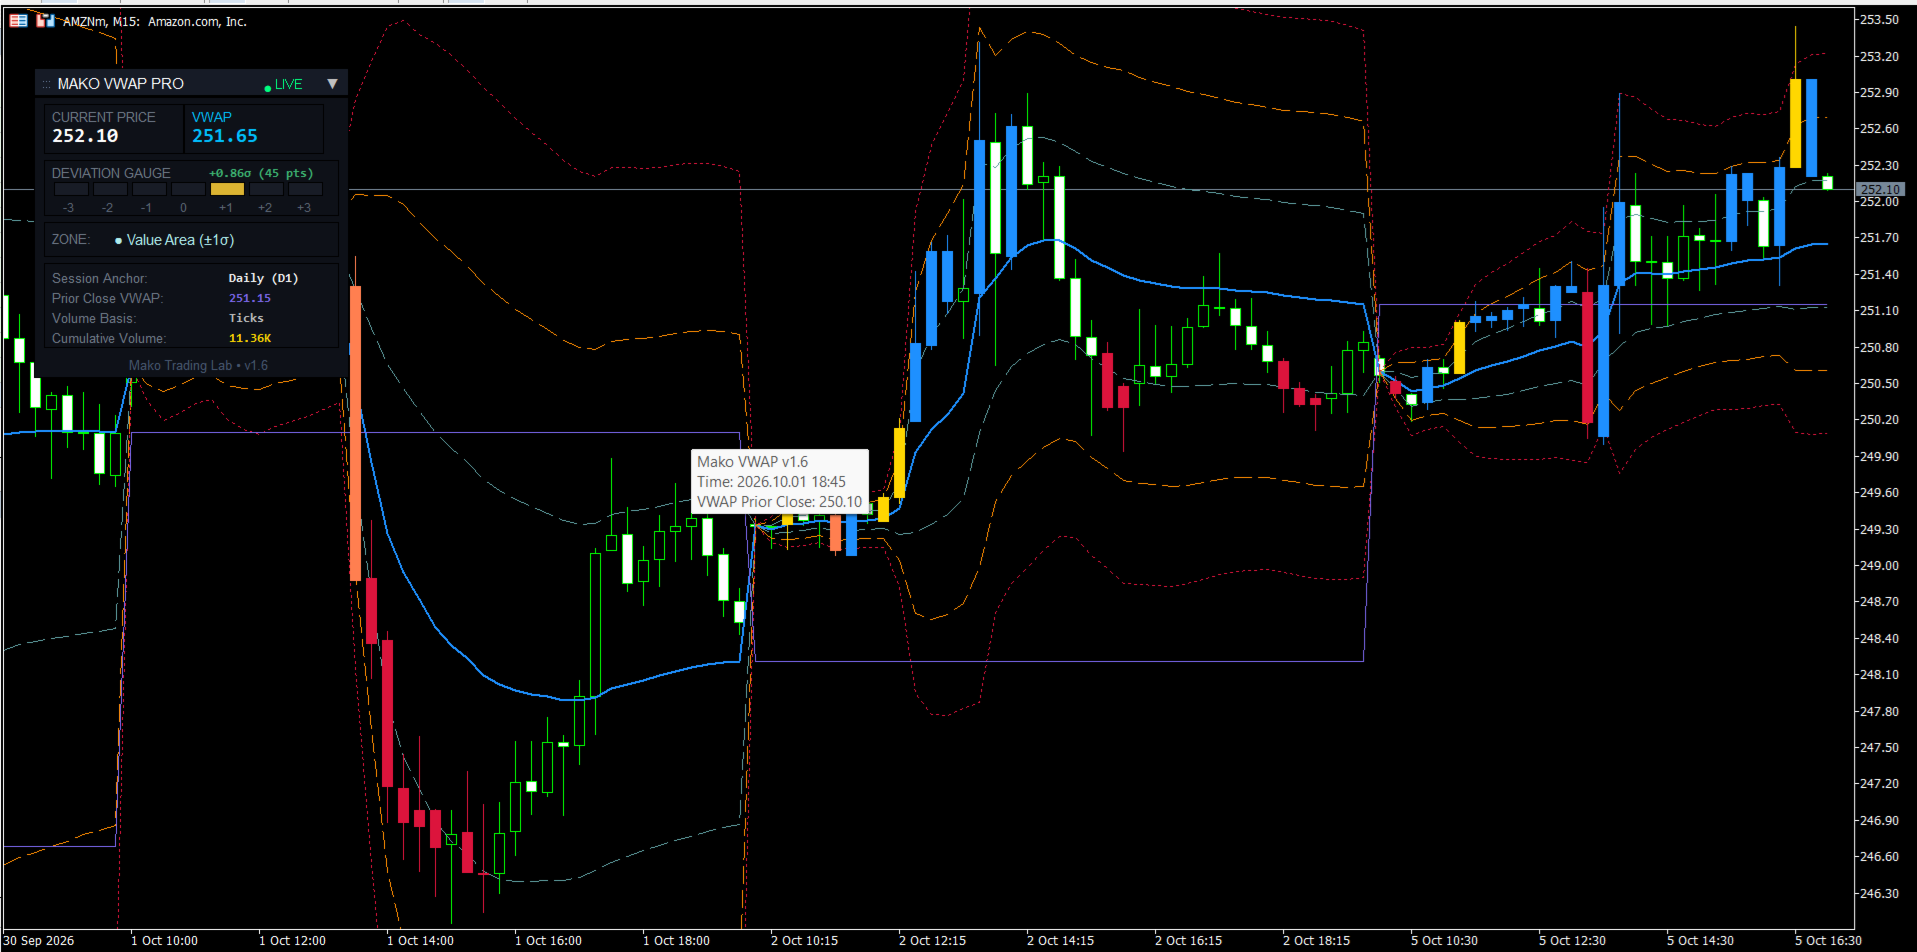
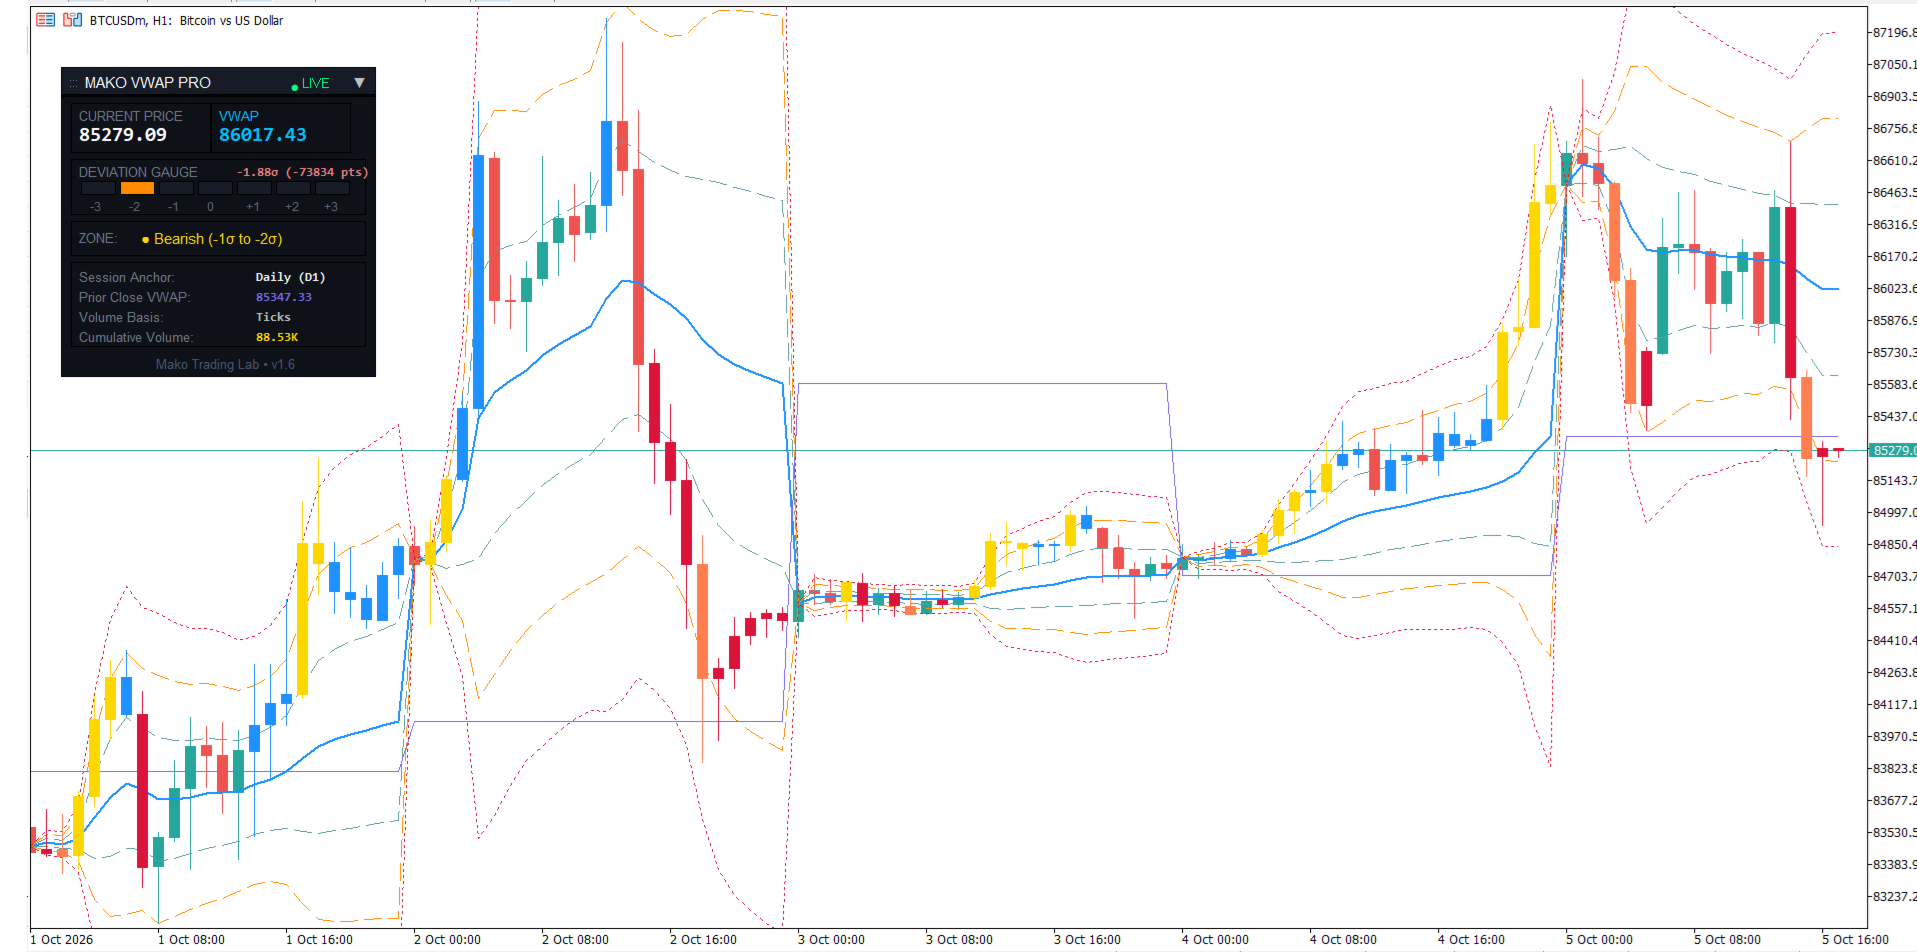
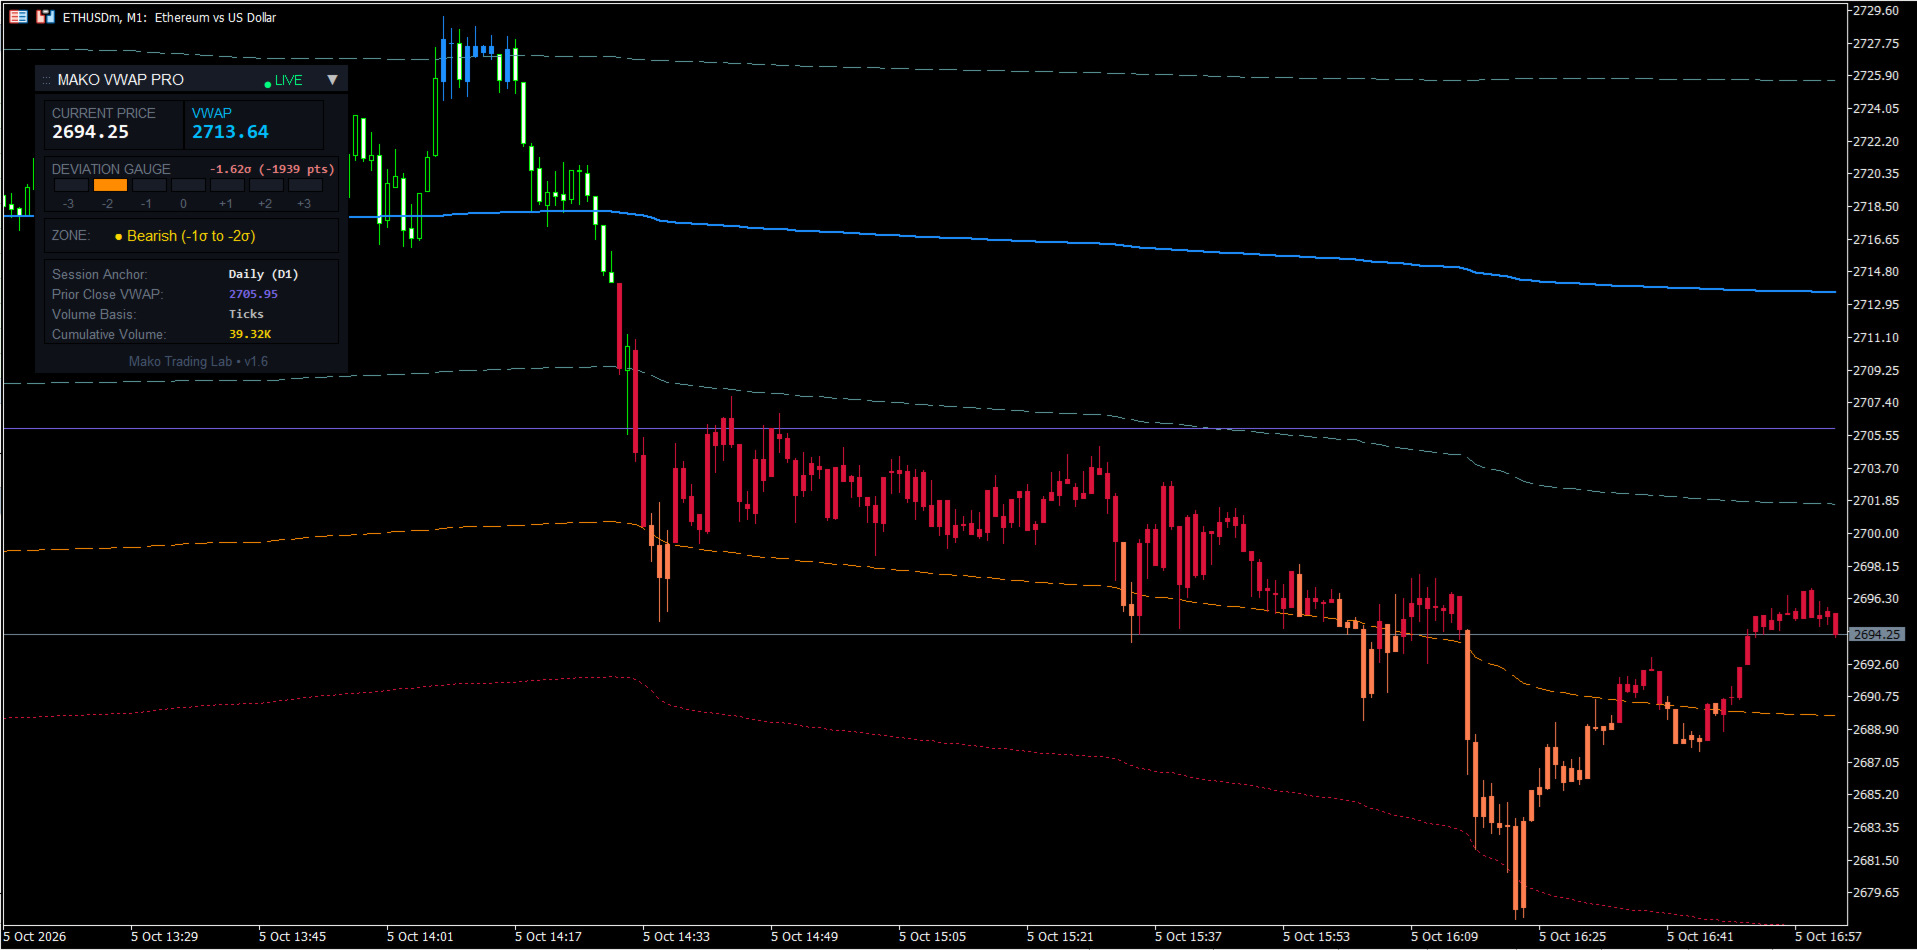
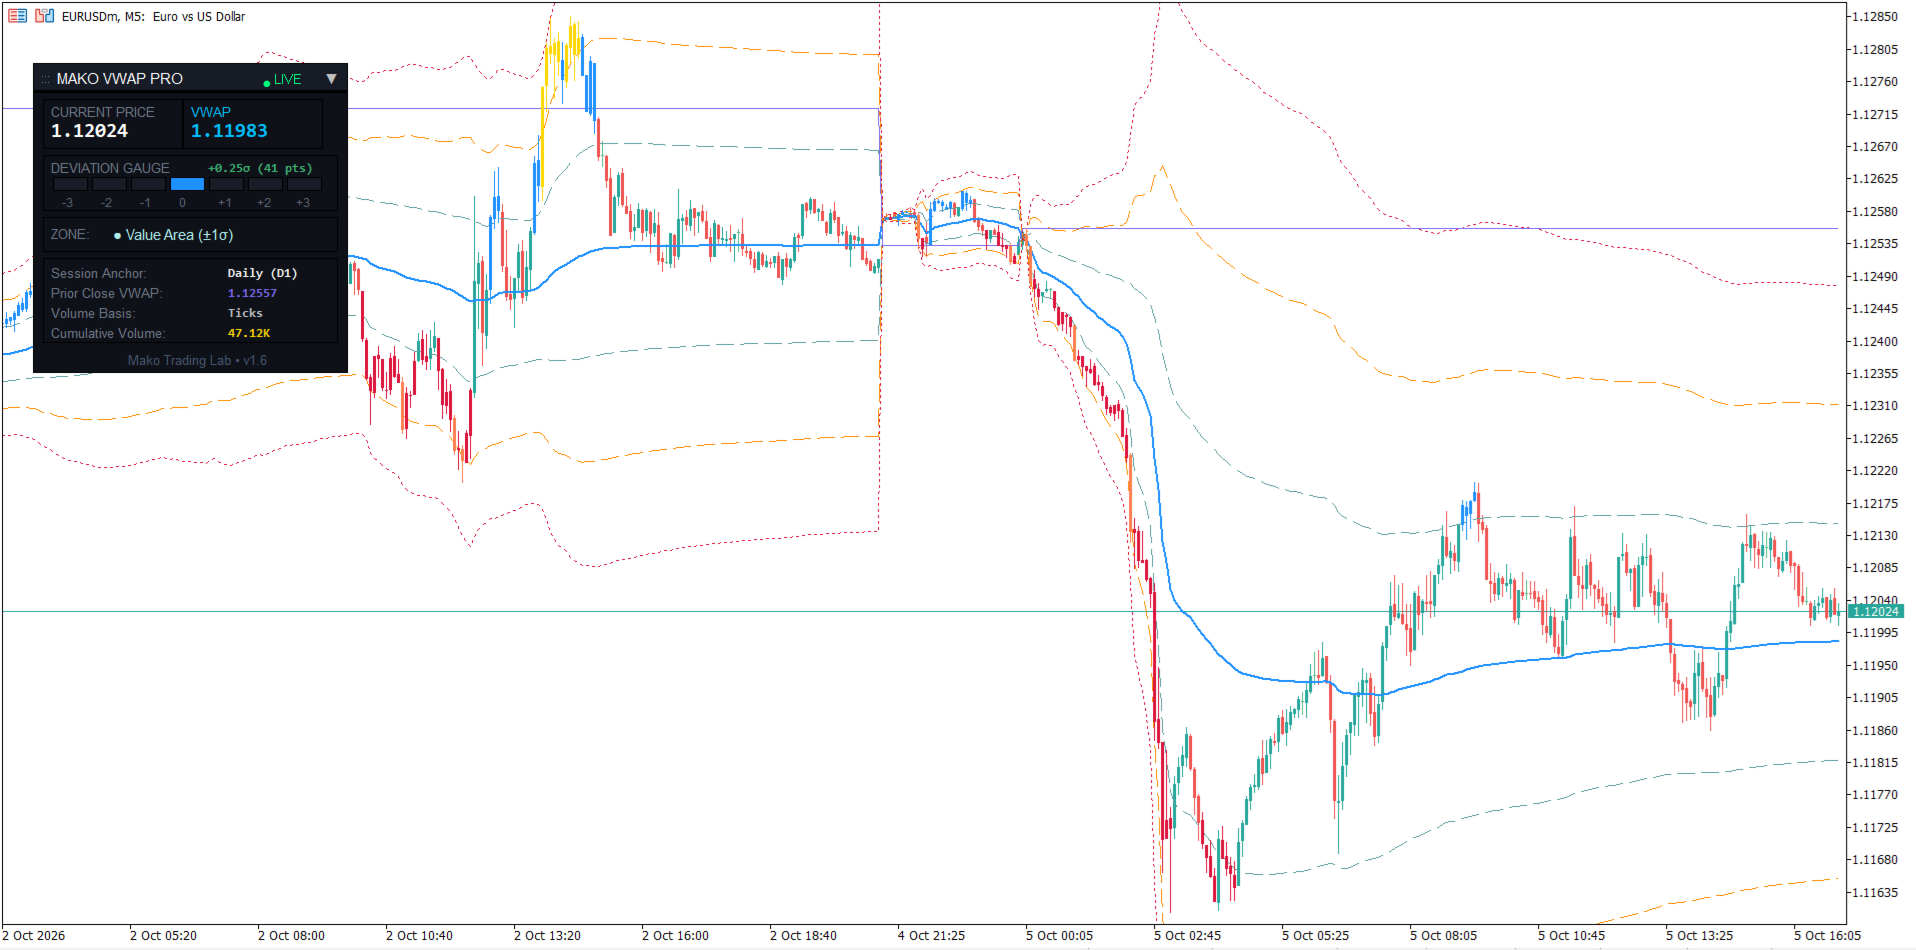
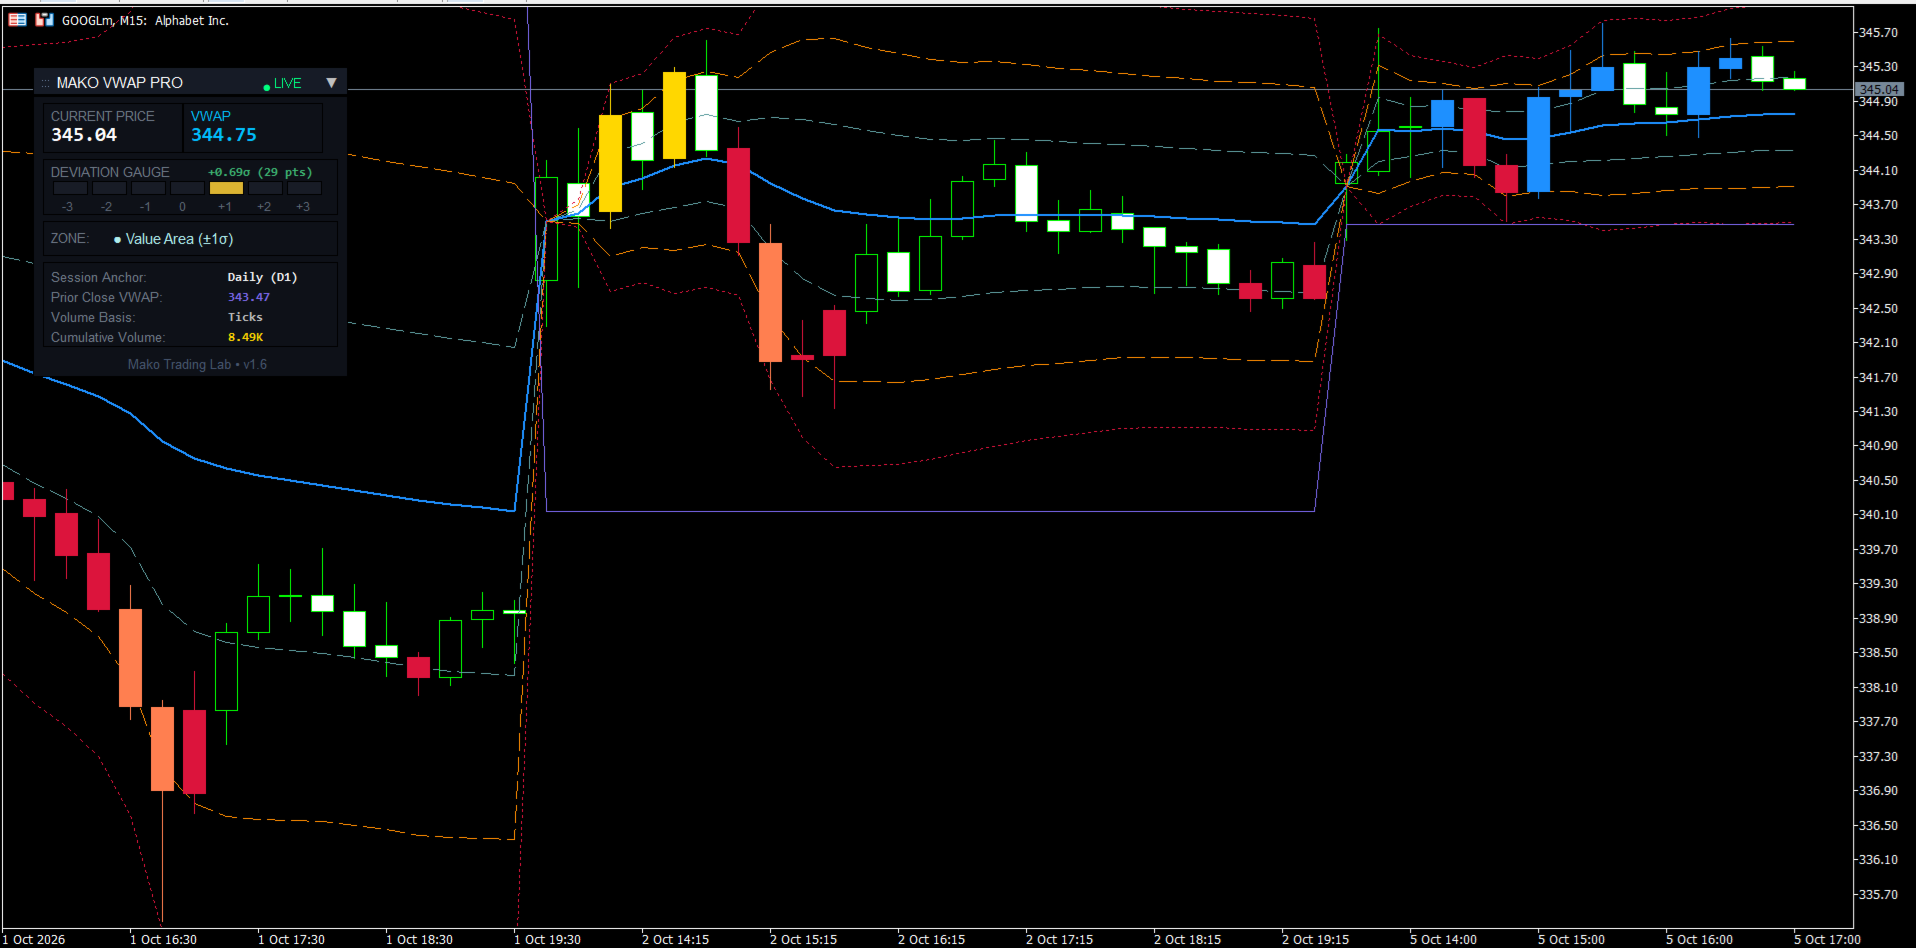
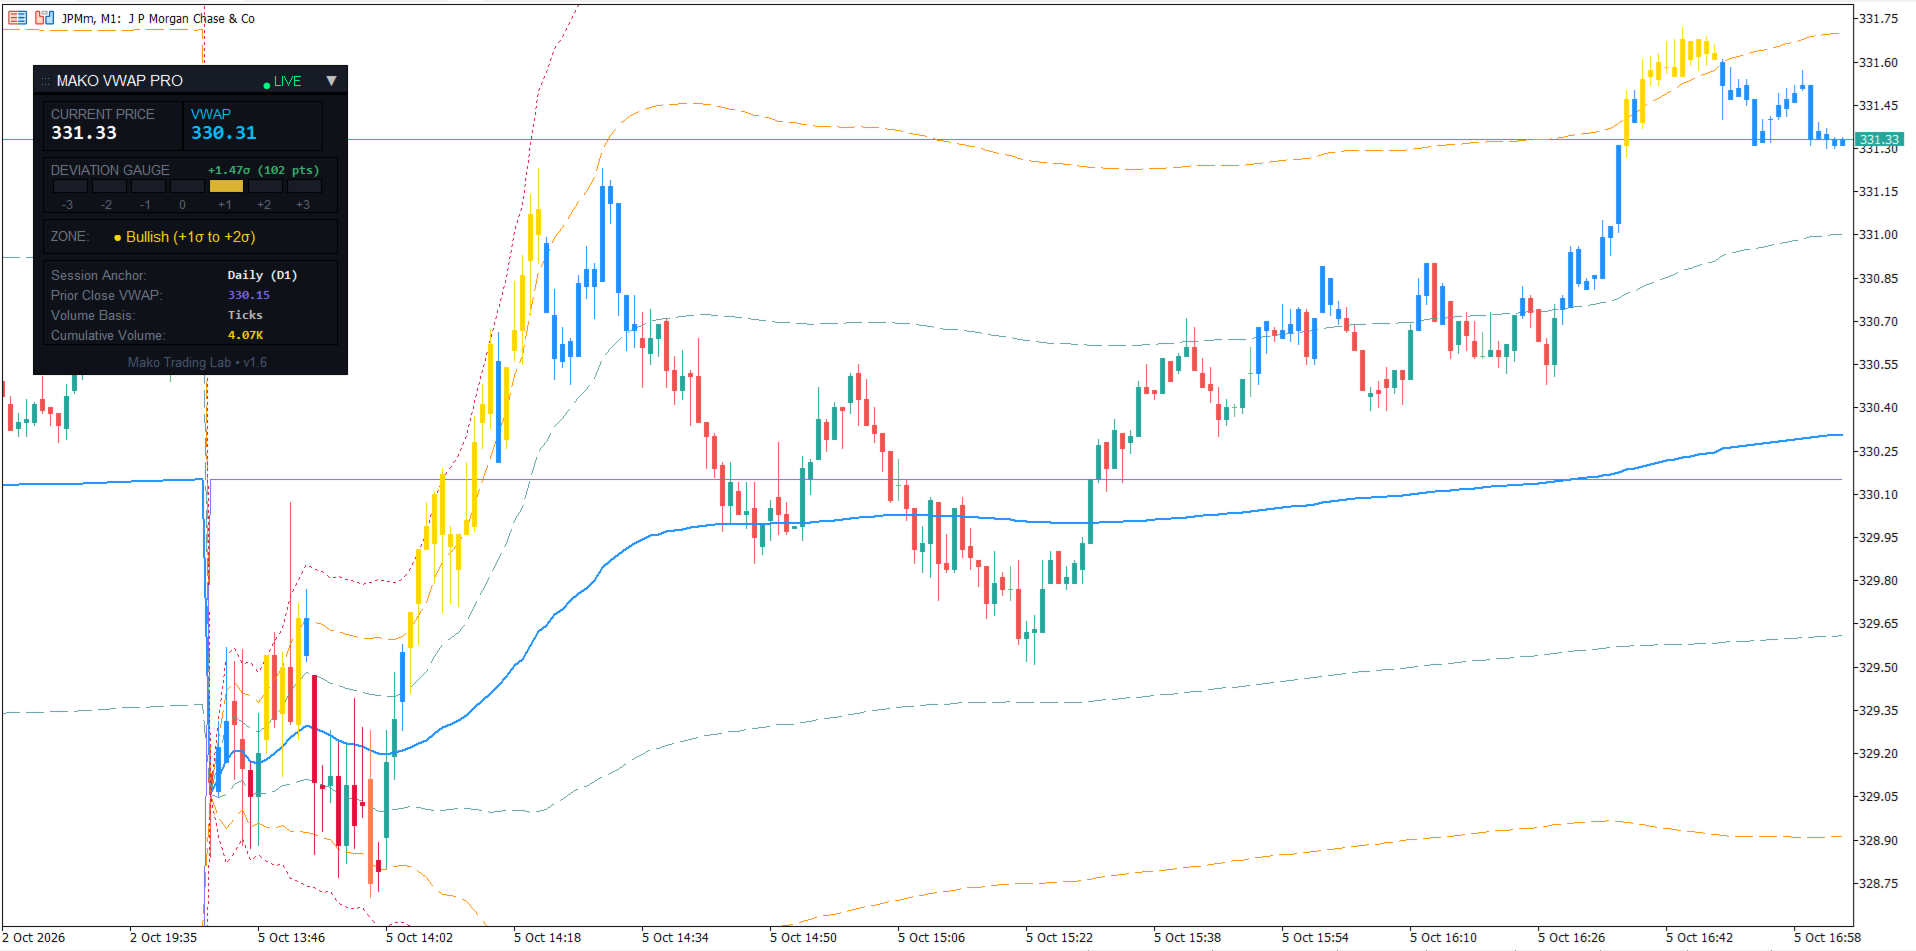
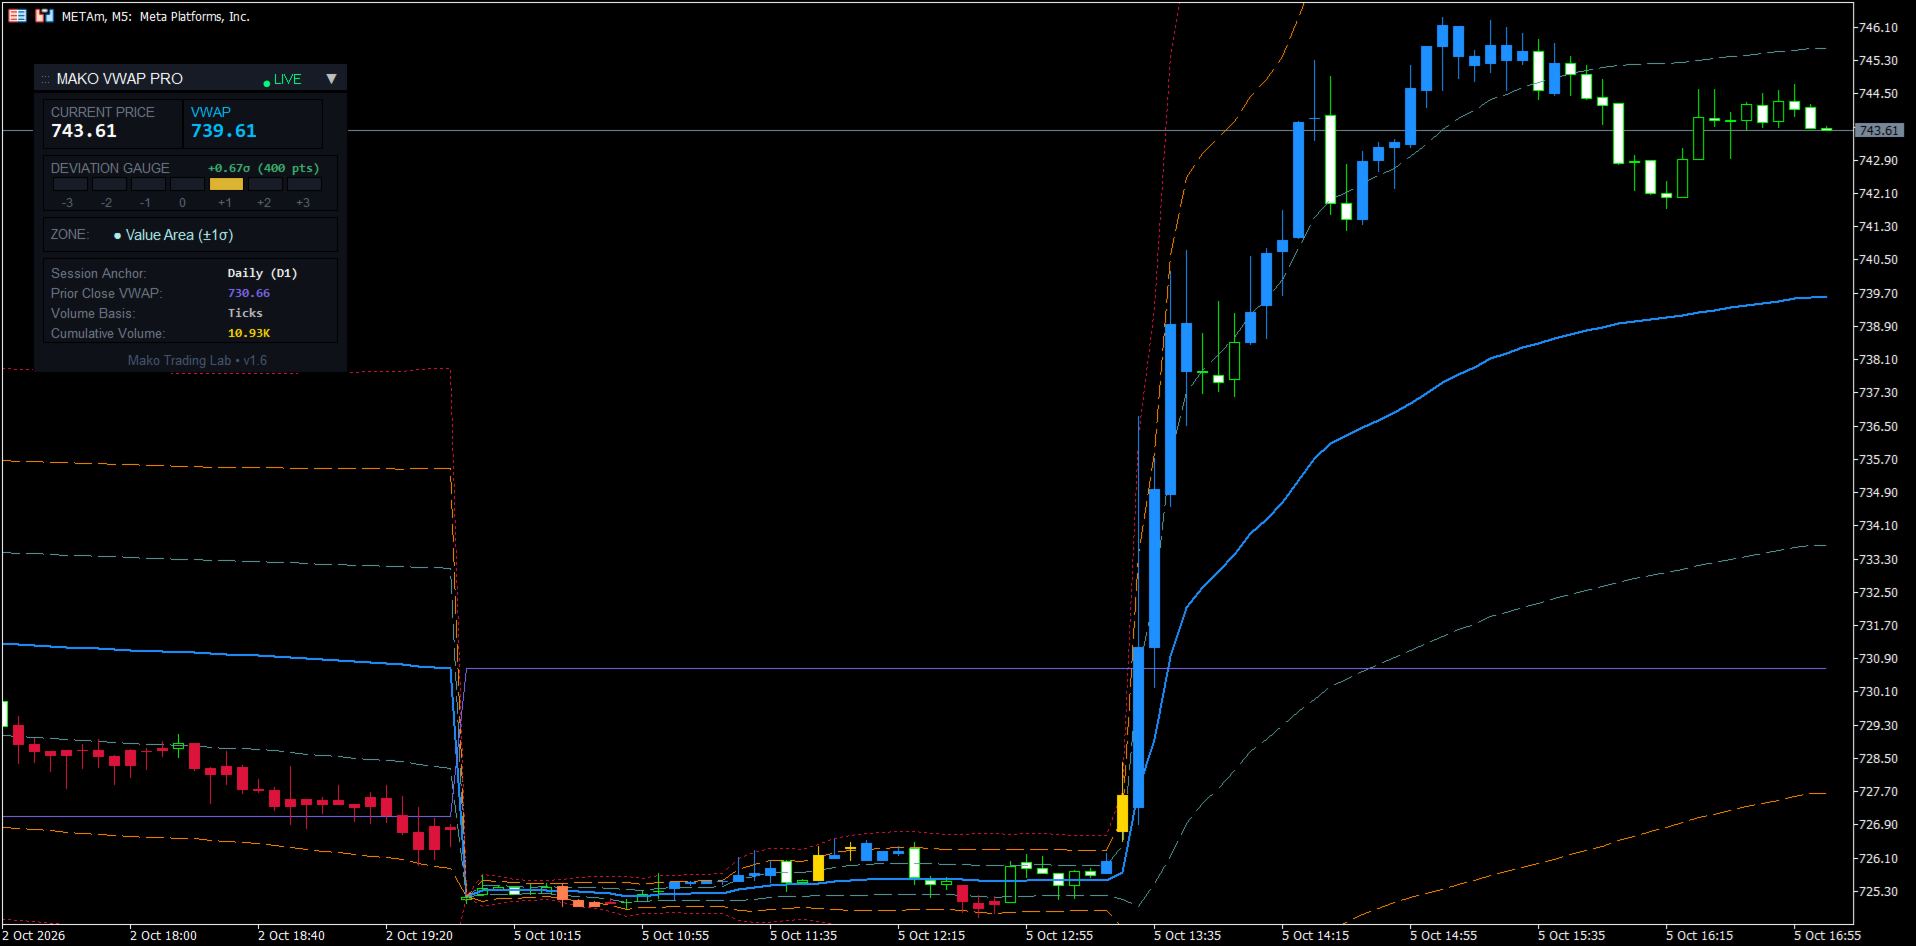
WHAT YOU SEE ON THE CHART
- The anchored VWAP line, reset every Day, Week, Month or Year (your choice);
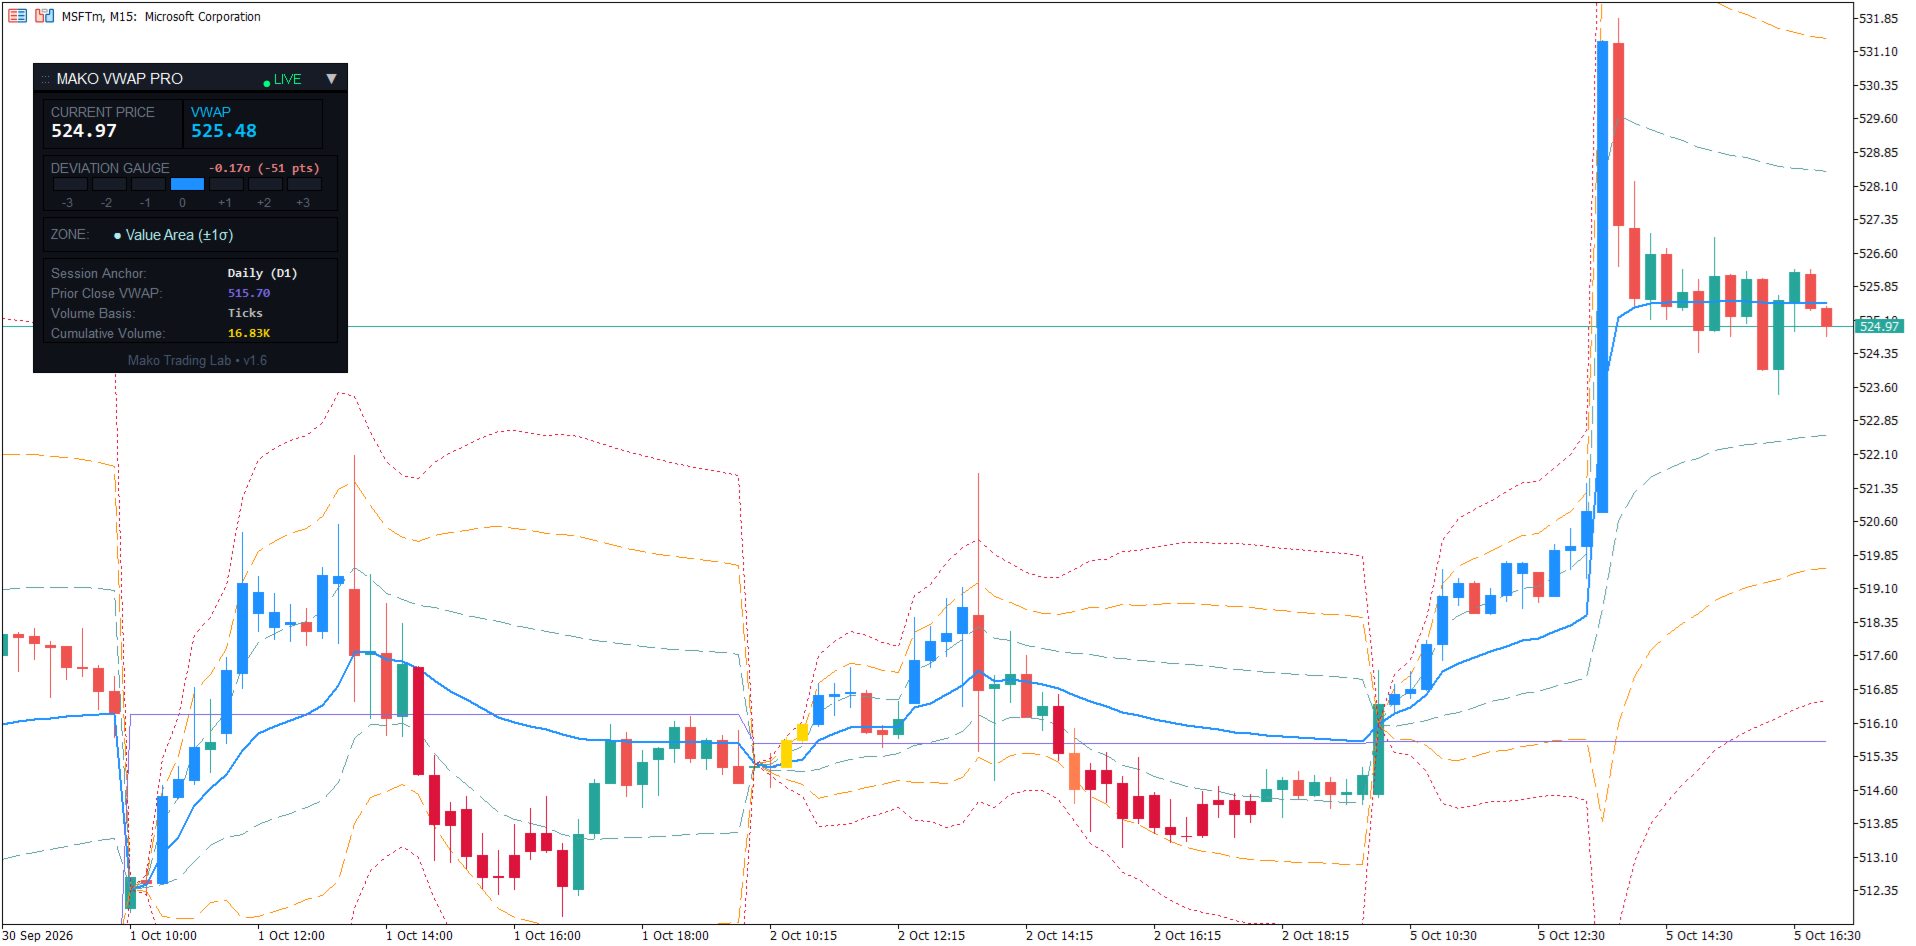
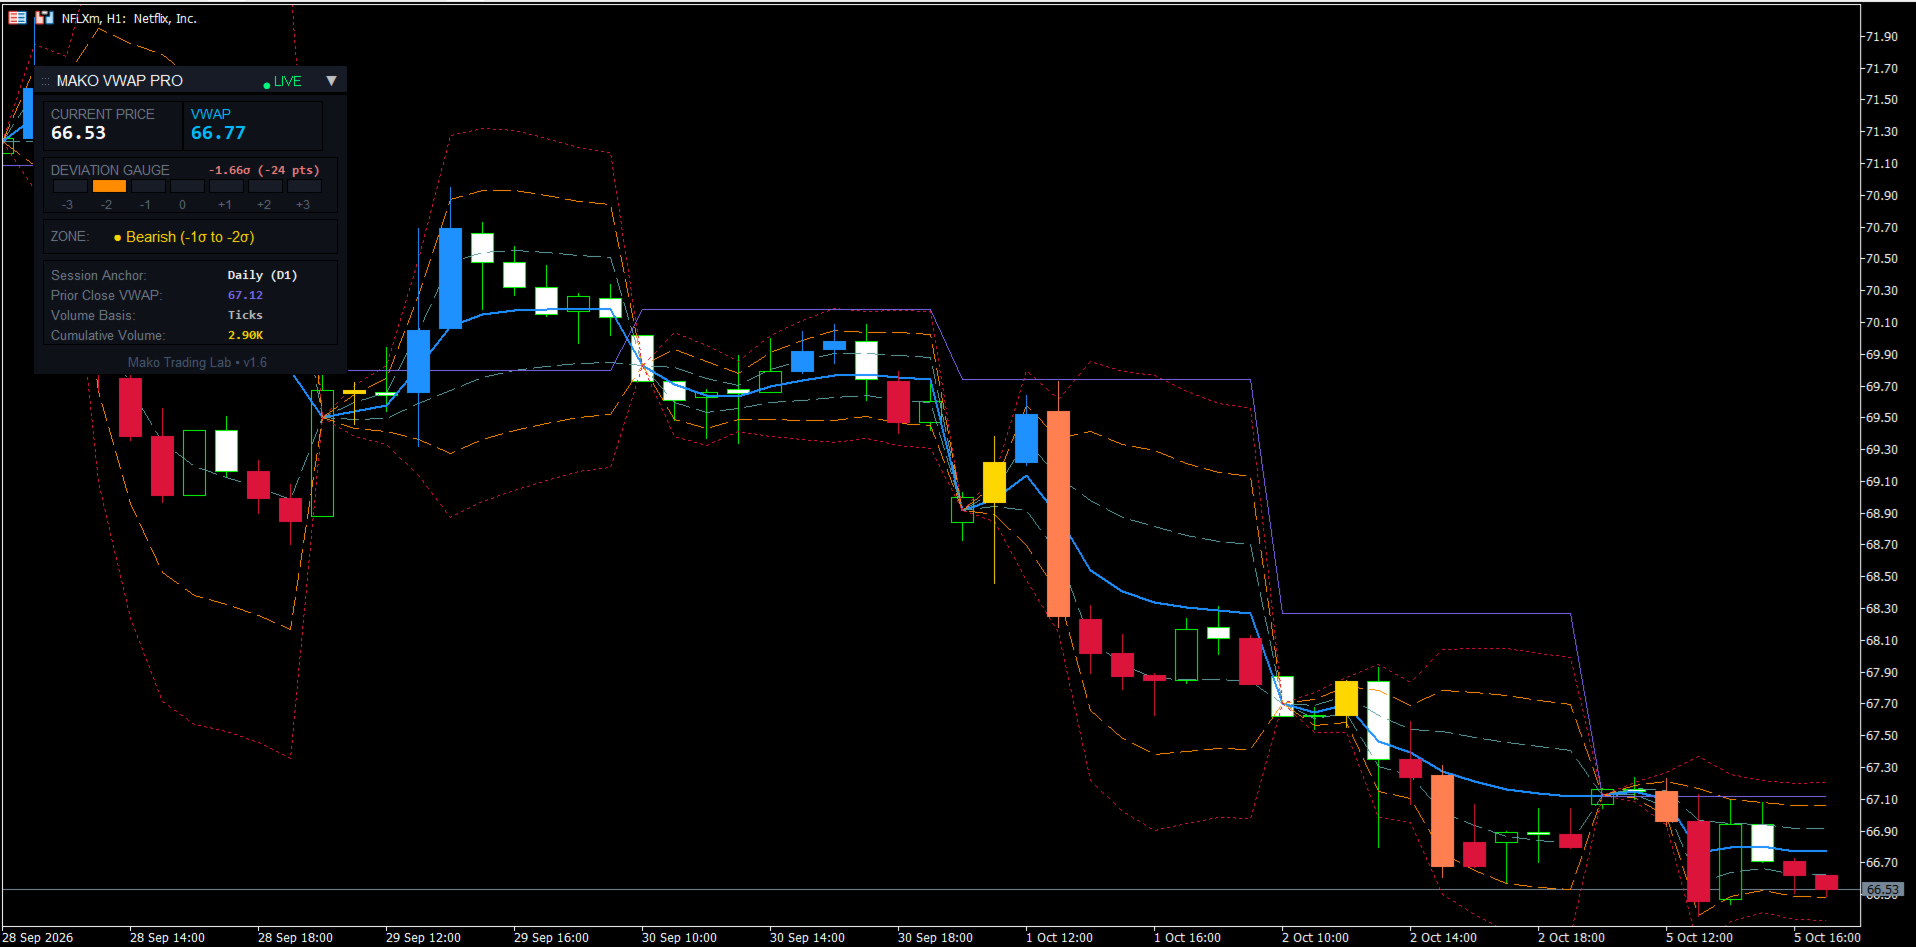
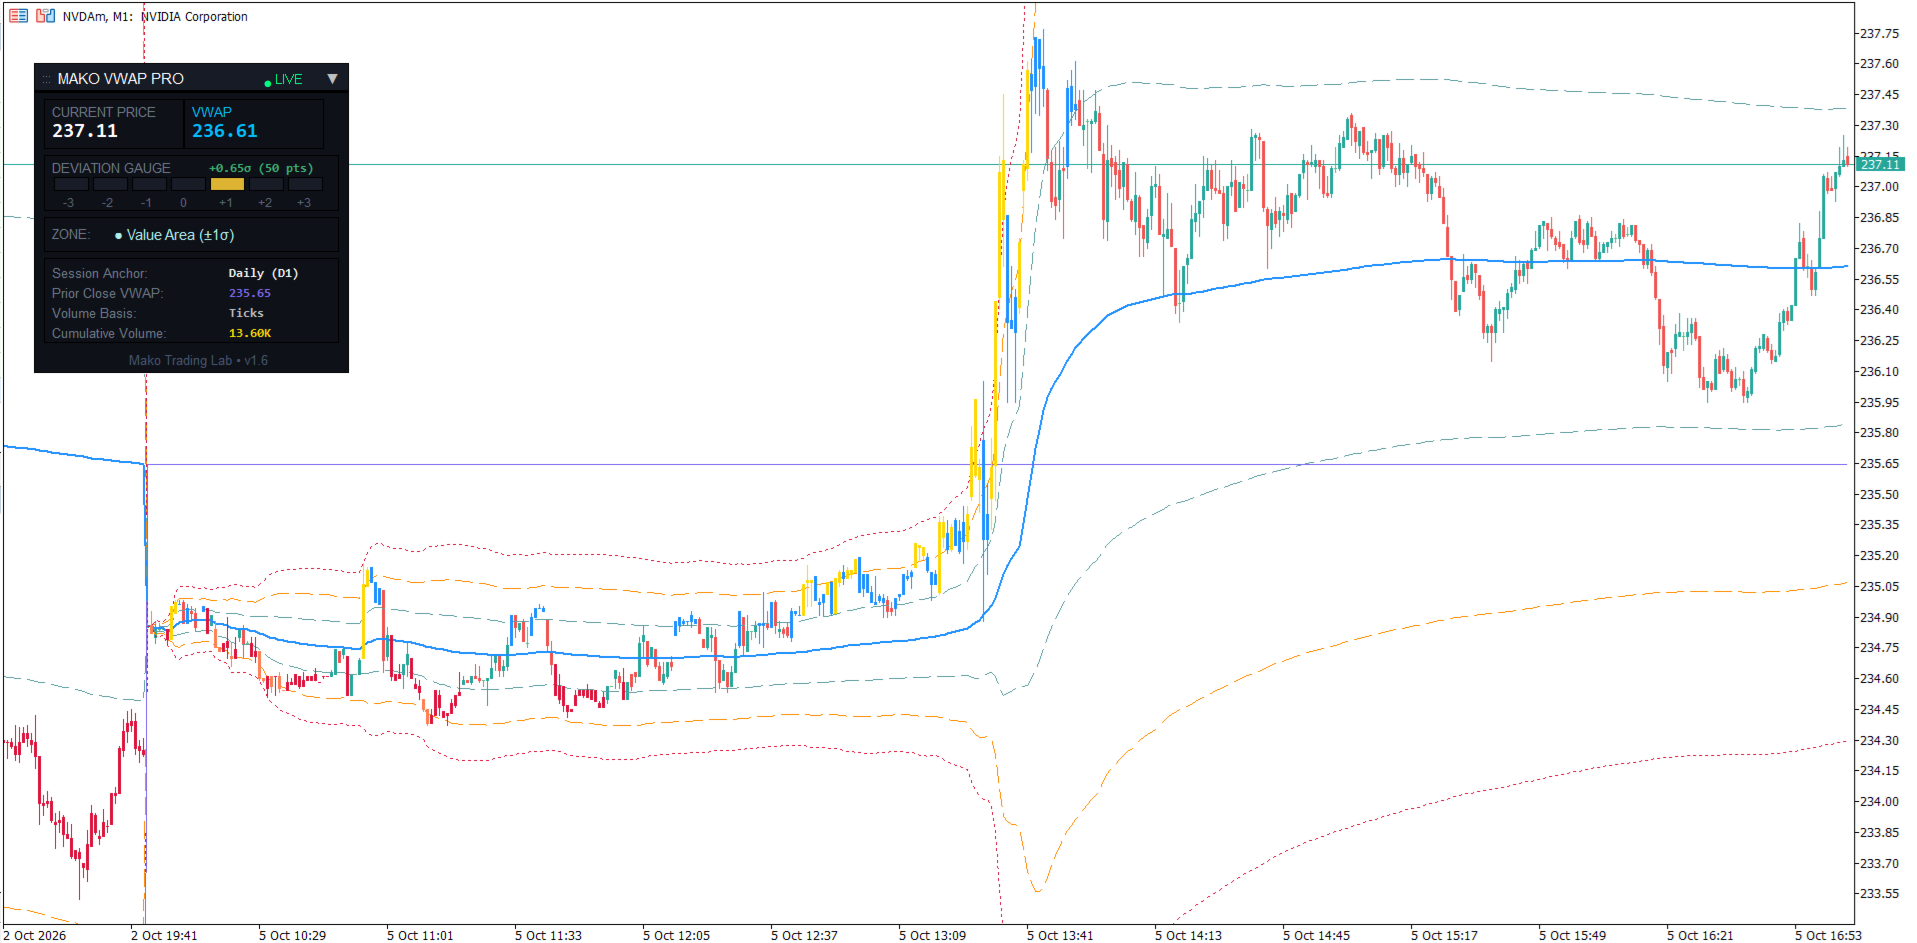
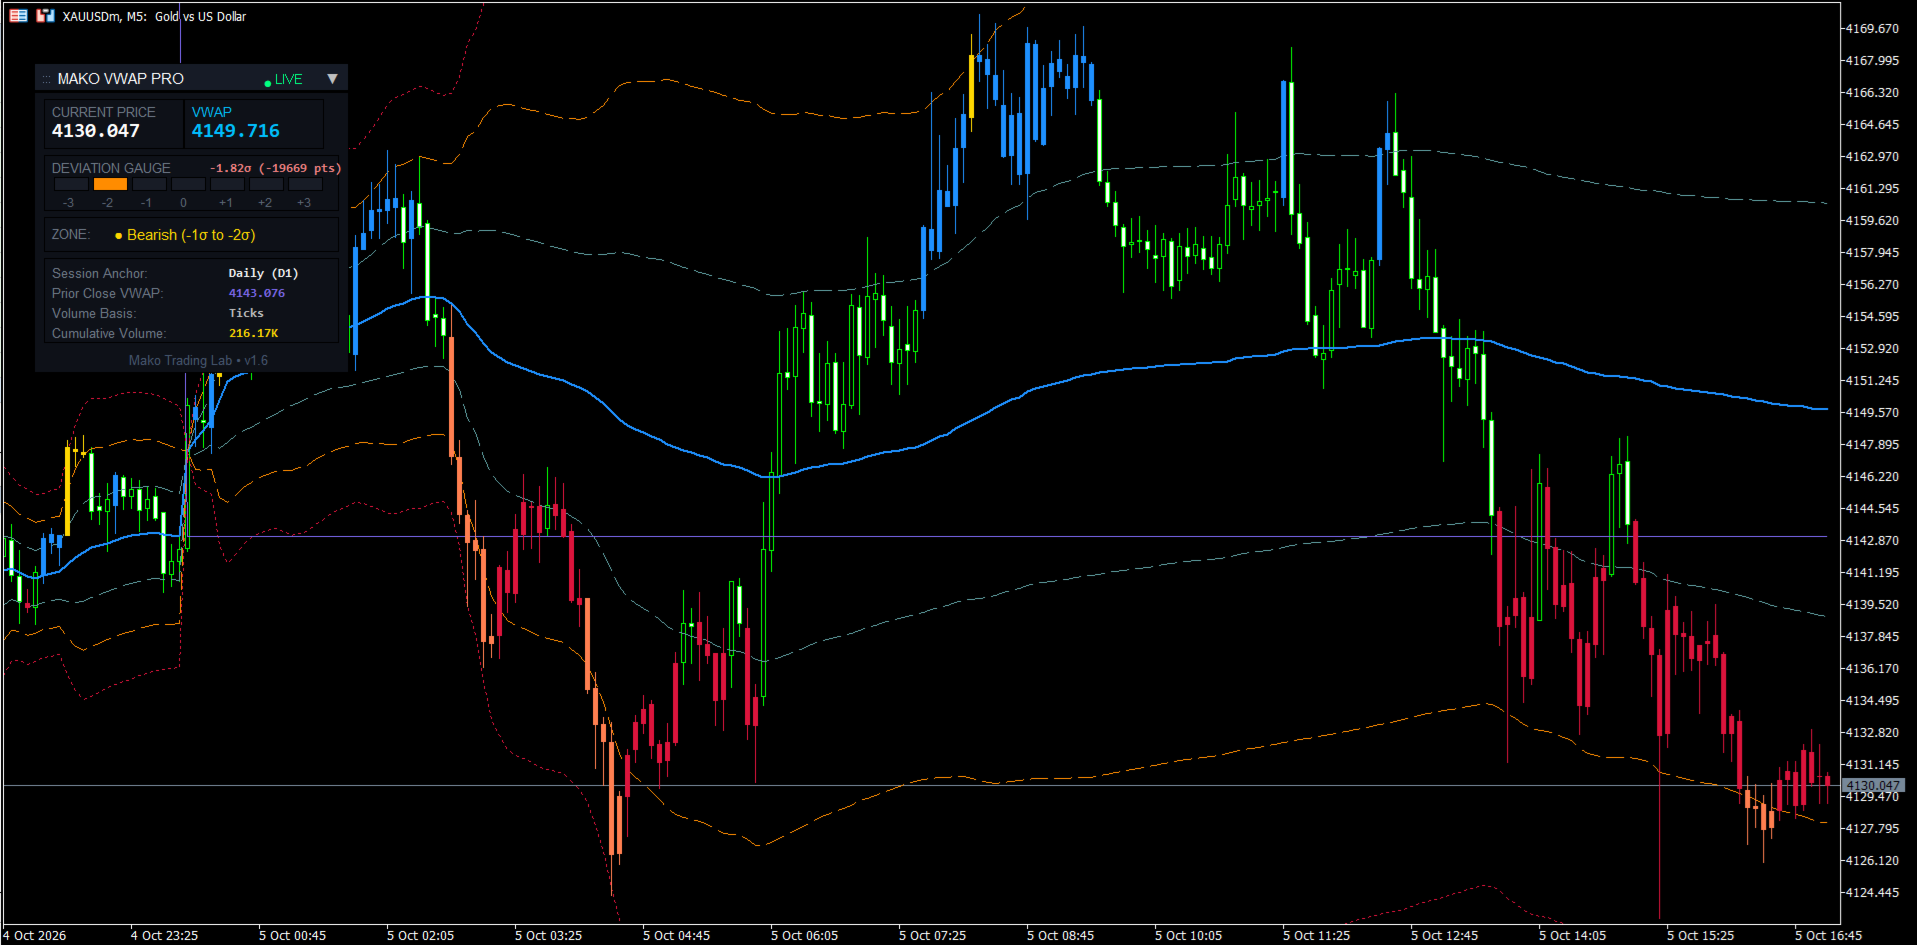
- Bands at +1, -1, +2, -2, +3 and -3 standard deviations: band 1 marks the value area, band 2 flags overbought or oversold, and band 3 flags statistical exhaustion;
- The prior session close VWAP line, useful as a reference;
- Candles painted automatically when price leaves the value area or enters an exhaustion zone.
HUD PANEL
A modern, draggable panel shows the current price, a deviation gauge, the zone price is in (Value Area, Bullish/Bearish, Overbought/Oversold or Exhaustion), the session anchor, the prior close VWAP, the volume basis in use and the cumulative volume.
FEATURES
- Alerts when price touches band 2 or band 3 (pop-up, sound or push notification), with a minimum number of session bars before alerting to avoid signals at the start of the period;
- Configurable band multipliers and the option to show or hide each band;
- Real volume (futures and stocks) or tick volume (Forex and CFDs), with automatic selection;
- Configurable applied price;
- Customizable panel colors; the panel remembers its position when you change timeframe;
- Incremental calculation, light even with a monthly or yearly anchor on low timeframes;
- Can be used in more than one instance on the same chart.
WHO IT IS FOR
For day traders, swing traders and scalpers who use VWAP, mean reversion or order flow reading and want a quick, objective view of where price stands relative to the volume-weighted average.
Note: MAKO VWAP is an analysis support tool. It does not execute trades and does not guarantee results. Trading involves risk.