Mako Market Structure
- Indicators
- Version: 1.19
- Updated: 3 October 2026
- Activations: 10

MAKO Market Structure - BOS CHoCH Scanner | Structure Before Prediction
Still counting highs and lows by hand?
Most traders see candles, not structure. They mark a high where there isn't one, confuse a pullback with a reversal, and only spot the CHoCH after the move is gone. Result: late entries, stopped out, and a noisy chart.
MAKO Market Structure was built to fix that. It turns price action into a clean, organized and instant structure reading - with zero chart clutter.
THE PROBLEM IT SOLVES:
- Messy charts with manually marked tops and bottoms
- Hard to tell in real time where a real BOS happened vs. a liquidity grab
- CHoCH you only see after the reversal already happened
- Pullbacks with no clear reference zone to watch
THE MAKO SOLUTION:
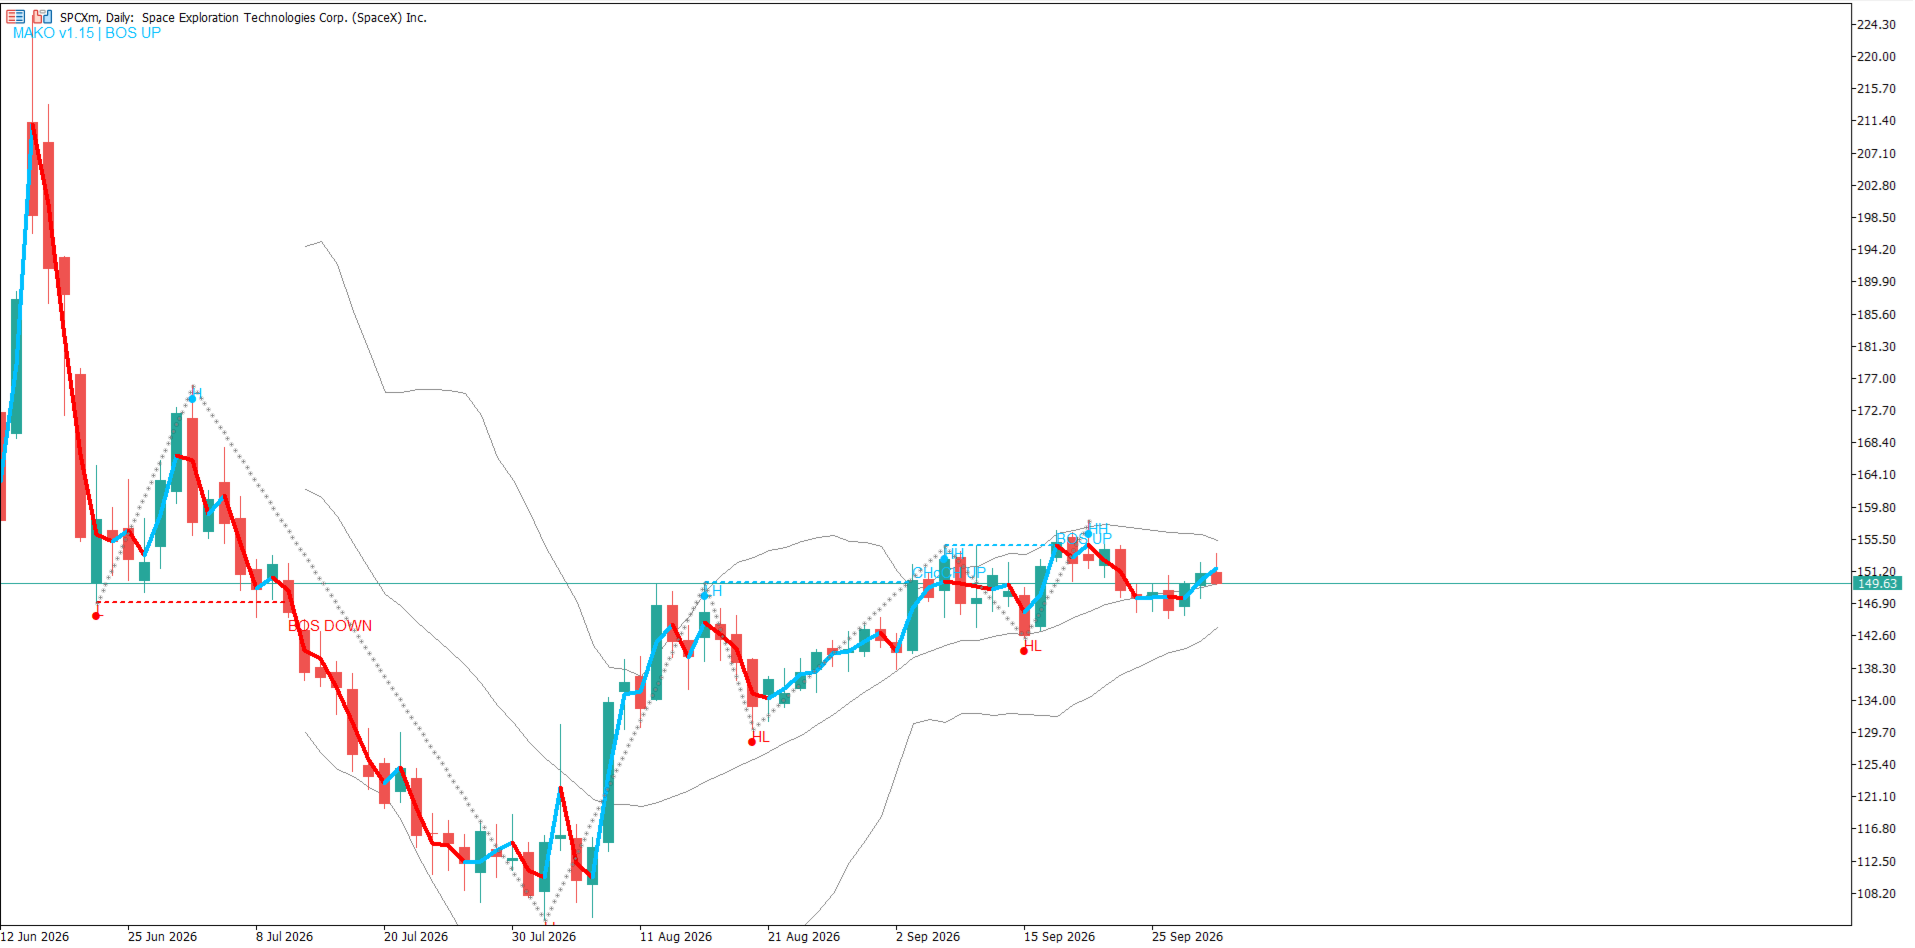
Instead of analyzing each candle in isolation, the indicator tracks the structural sequence of price and automatically draws the path, key points and relevant breaks directly on your chart.
KEY FEATURES:
- Automatic HH - Higher High / HL - Higher Low marking
- Automatic LH - Lower High / LL - Lower Low marking
- Structural path connecting major swings
- Automatic BOS - Break of Structure detection - trend continuation
- Automatic CHoCH - Change of Character detection - potential shift in market behavior
- Clean marking of major highs and lows
- Instant visual reading of the dominant structural direction
- Dynamic Pullback Zone based on recent structure
- Visual retracement reference between 38.2% and 61.8%
- Clean, non-repainting on closed swing, fully integrated into the chart
HOW TO USE IT IN PRACTICE (ATTACK MODE):
- Trend: HH + HL sequence = bullish structure. LH + LL sequence = bearish structure.
- Continuation: BOS broken = market holding structure. Use it to follow the flow.
- Reversal: CHoCH marked = visual alert that structural behavior may be changing.
- Entry Reference: Use the Pullback Zone + 38.2-61.8 retracement as a reference to wait for price to return into structure, not to chase.
WHO IS IT FOR:
For traders who use SMC / Smart Money / Price Action and need a fast, no-guesswork structure reading to complement breakouts, liquidity and Order Blocks.
WHAT IT IS NOT:
It is not an EA, it does not execute trades and it does not promise profit. It is not a magic buy/sell arrow. It is a visual reading tool to give you structure clarity before the decision.
Works on any symbol and timeframe on MetaTrader 5.
MAKO Trading Lab
Structure before prediction.