Pivot Point Indicator Hybrid MT5
- Indicators
- Version: 1.0
- Activations: 7

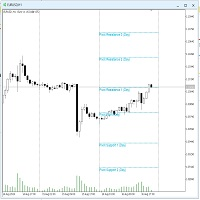
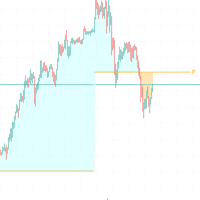
Pivot Point Hybrid MT5 is an institutional-grade, multi-model pivot indicator engineered for precision chart analysis and automated trading. It calculates key support and resistance levels across standard or multi-year anchor periods, displaying clean visual lines on your chart while seamlessly communicating all pivot data to your Expert Advisors.
Unlike standard indicators that only draw basic lines, this hybrid tool combines clear chart visualization with built-in data integration. Your trading robots can automatically detect and react to key pivot levels in real time without lag or complex setup.
Designed for traders and algorithmic strategists seeking a reliable, high-performance pivot point system with zero visual conflicts.
-
6 Calculation Formulas: Full support for Traditional, Fibonacci, Classic, Woodie, DeMark, and Camarilla pivot models
-
10 Flexible Anchor Periods: Calculate pivots across Auto, Daily, Weekly, Monthly, Quarterly, Yearly, 2-Year, 3-Year, 5-Year, and 10-Year cycles
-
Automated Trading Ready: Built-in data structure allows any trading robot to read Central Pivot, Support, and Resistance levels instantly
-
Multi-Instance Protection: Smart object management prevents conflicts when running multiple timeframes (such as Daily and Weekly pivots) on the same chart simultaneously
-
Fully Customizable Visuals: Toggle individual level visibility, custom colors, line thickness, and line styles (Solid, Dash, Dot) for each support and resistance tier
-
Dynamic Price & Text Labels: Position level names and exact price tags on the left or right side of each cycle
-
Historical Depth Control: Adjust how many historical pivot periods to display to keep your charts clean and focused
-
Ultra-Low Resource Usage: Advanced period caching calculates only when a new cycle begins, ensuring smooth charts and optimal performance
-
Pivot Type: Calculation formula (Traditional, Fibonacci, Woodie, Classic, DeMark, Camarilla)
-
Pivot Anchor: Cycle calculation period (Auto, Daily, Weekly, Monthly, Quarterly, Yearly, and Multi-Year)
-
Max Historical Pivots: Number of historical pivot cycles retained on the chart (default: 5)
-
Use Daily-Based Values: True to pull higher timeframe data; False to compute from current chart bars
-
Show Labels: Toggle display of level name labels (P, R1, S1, etc.)
-
Show Prices: Toggle display of exact price tags alongside labels
-
Label Position: Display labels on the Left or Right side of each period
-
Line Width: Thickness of drawn pivot lines
-
Line Style: Visual style for drawn lines (Solid, Dash, Dot)
-
Level Visibility & Colors: Individual color and on/off toggles for P, R1–R5, and S1–S5 levels