Gann Pulse MT5
- Indicators
- Version: 1.0
- Activations: 10

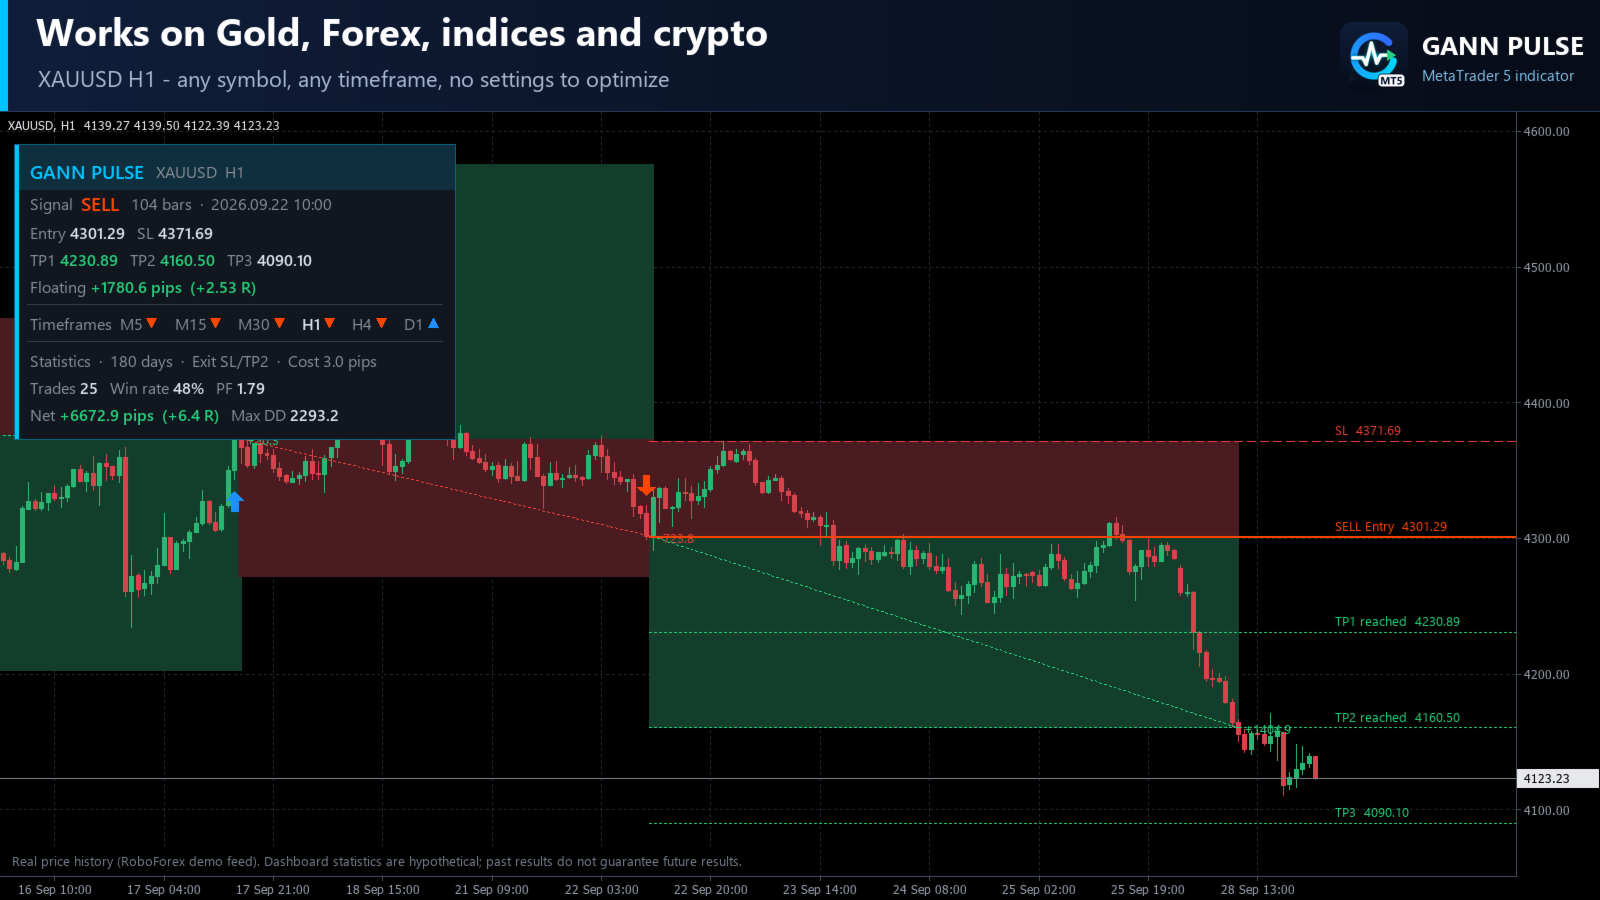
Gann Pulse is a non-repainting trend signal indicator for MetaTrader 5. When a bar closes it shows a clear BUY or SELL arrow and immediately draws the entry price, the Stop Loss and three Take Profit levels. No theory is needed: attach it to a chart and follow the signals.
The idea
Two of W. D. Gann's classic rules are "never trade against the trend" and "always protect a trade with a Stop Loss". Gann Pulse follows both. Its proprietary momentum engine detects the moment when the pulse of the market turns in a new direction, and every signal comes with a complete trade plan.
Main features
- BUY and SELL arrows fixed at bar close. They never repaint, move or disappear.
- Entry, Stop Loss, TP1, TP2 and TP3 lines for the active signal. Reached levels are marked on the chart.
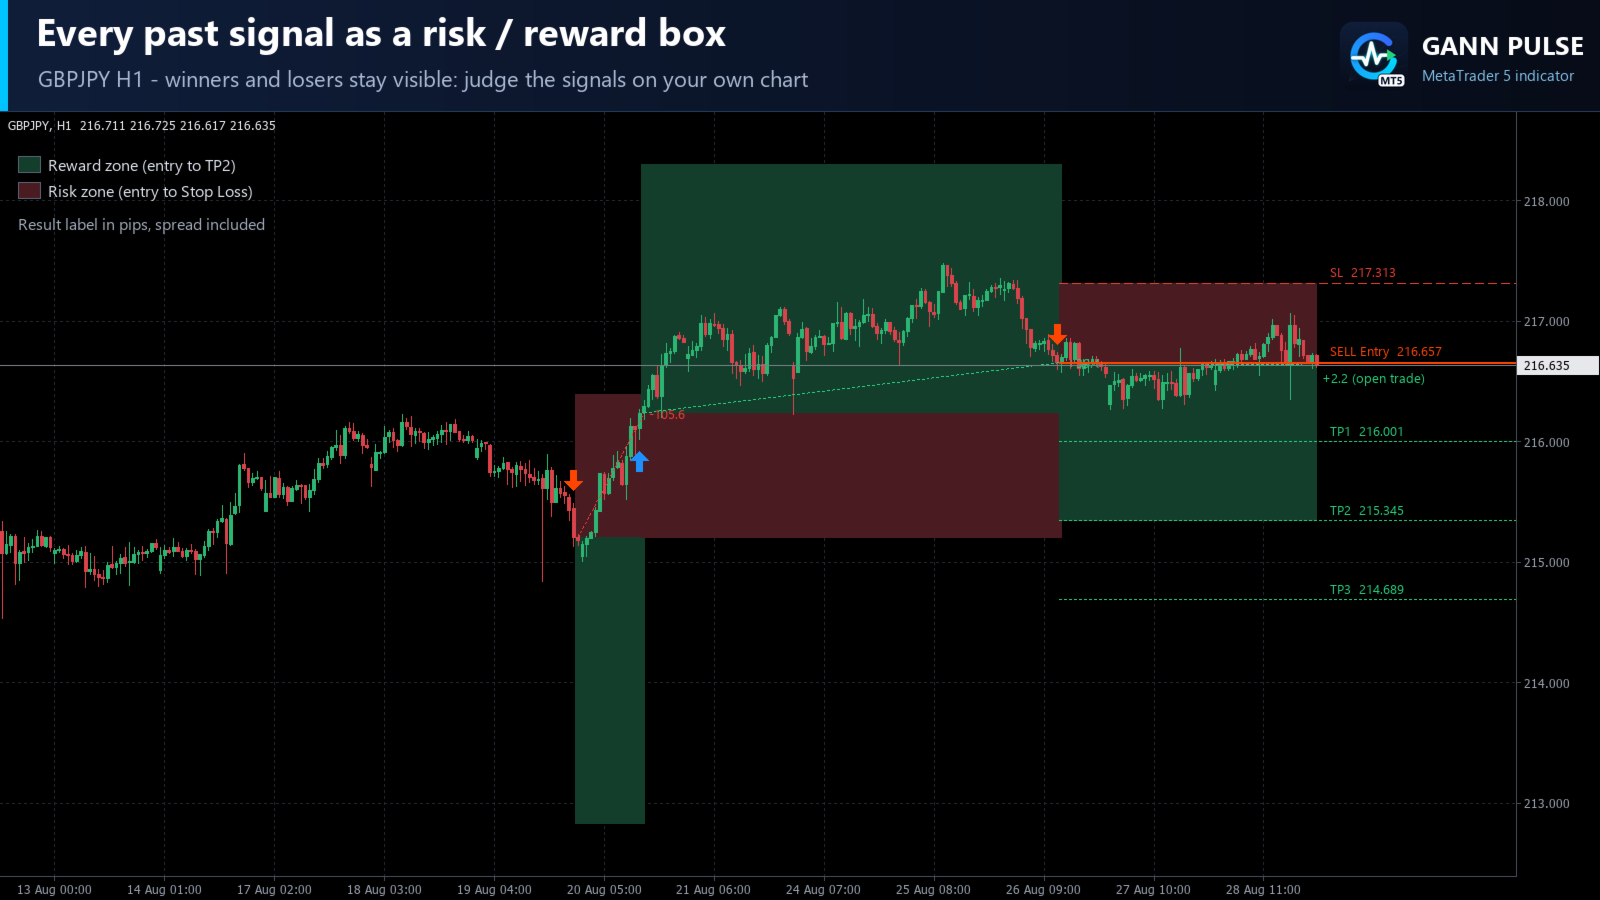
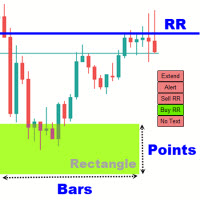
- History boxes: every past signal is drawn as a risk / reward box with its result in pips, so you can judge the signals on your own chart before trading.
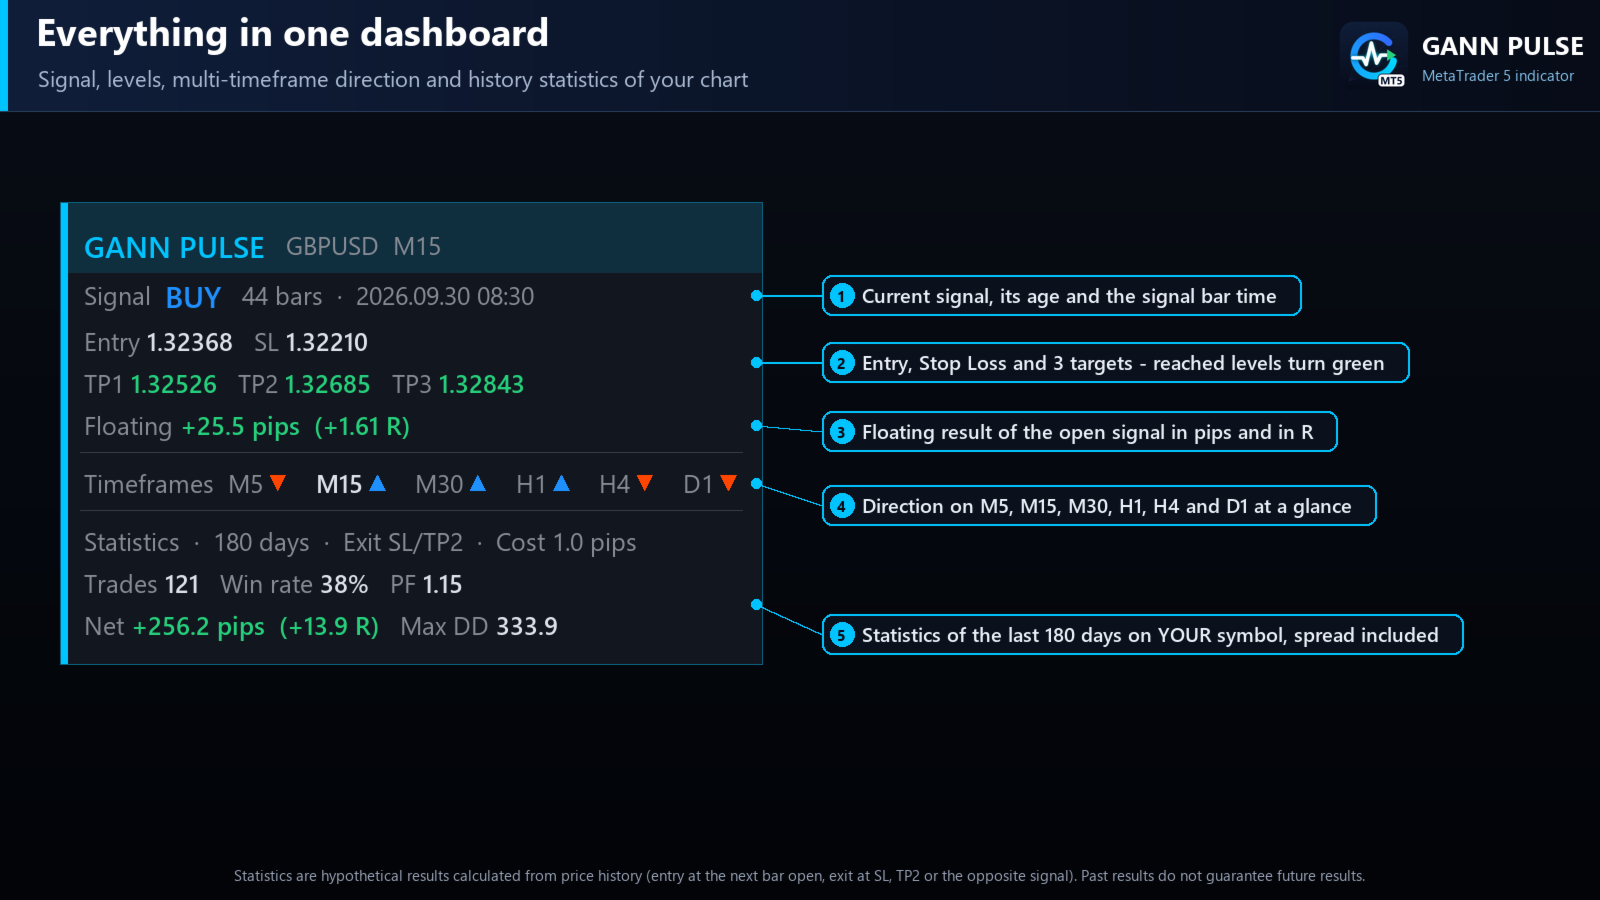
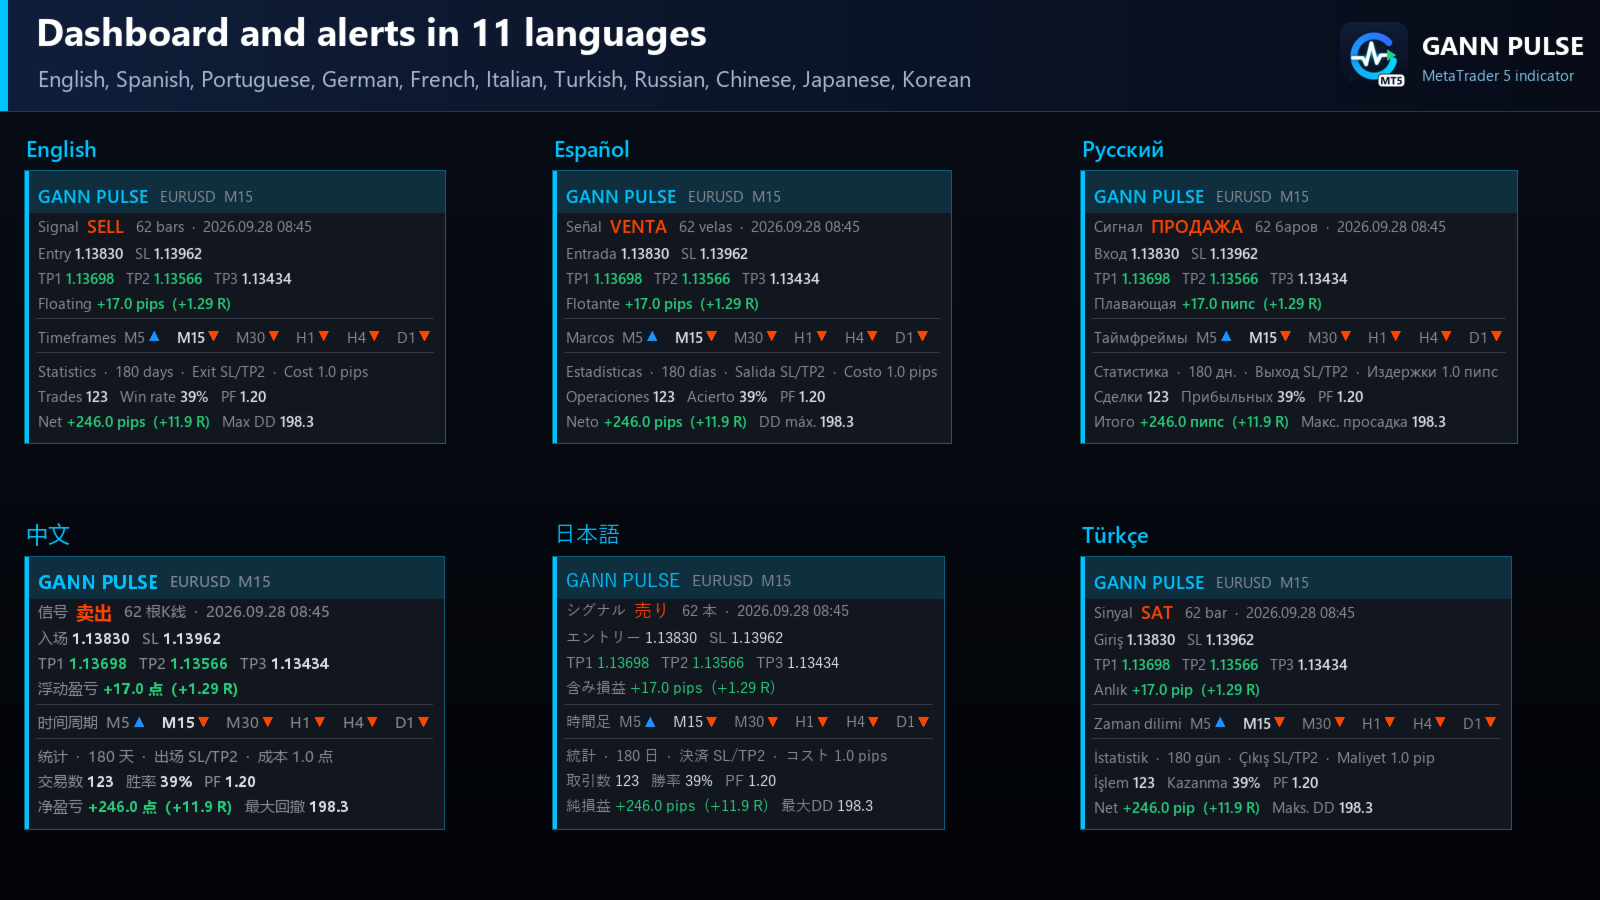
- Dashboard: current signal and its age, levels, floating result in pips and R, direction on M5, M15, M30, H1, H4 and D1, statistics of the last 180 days.
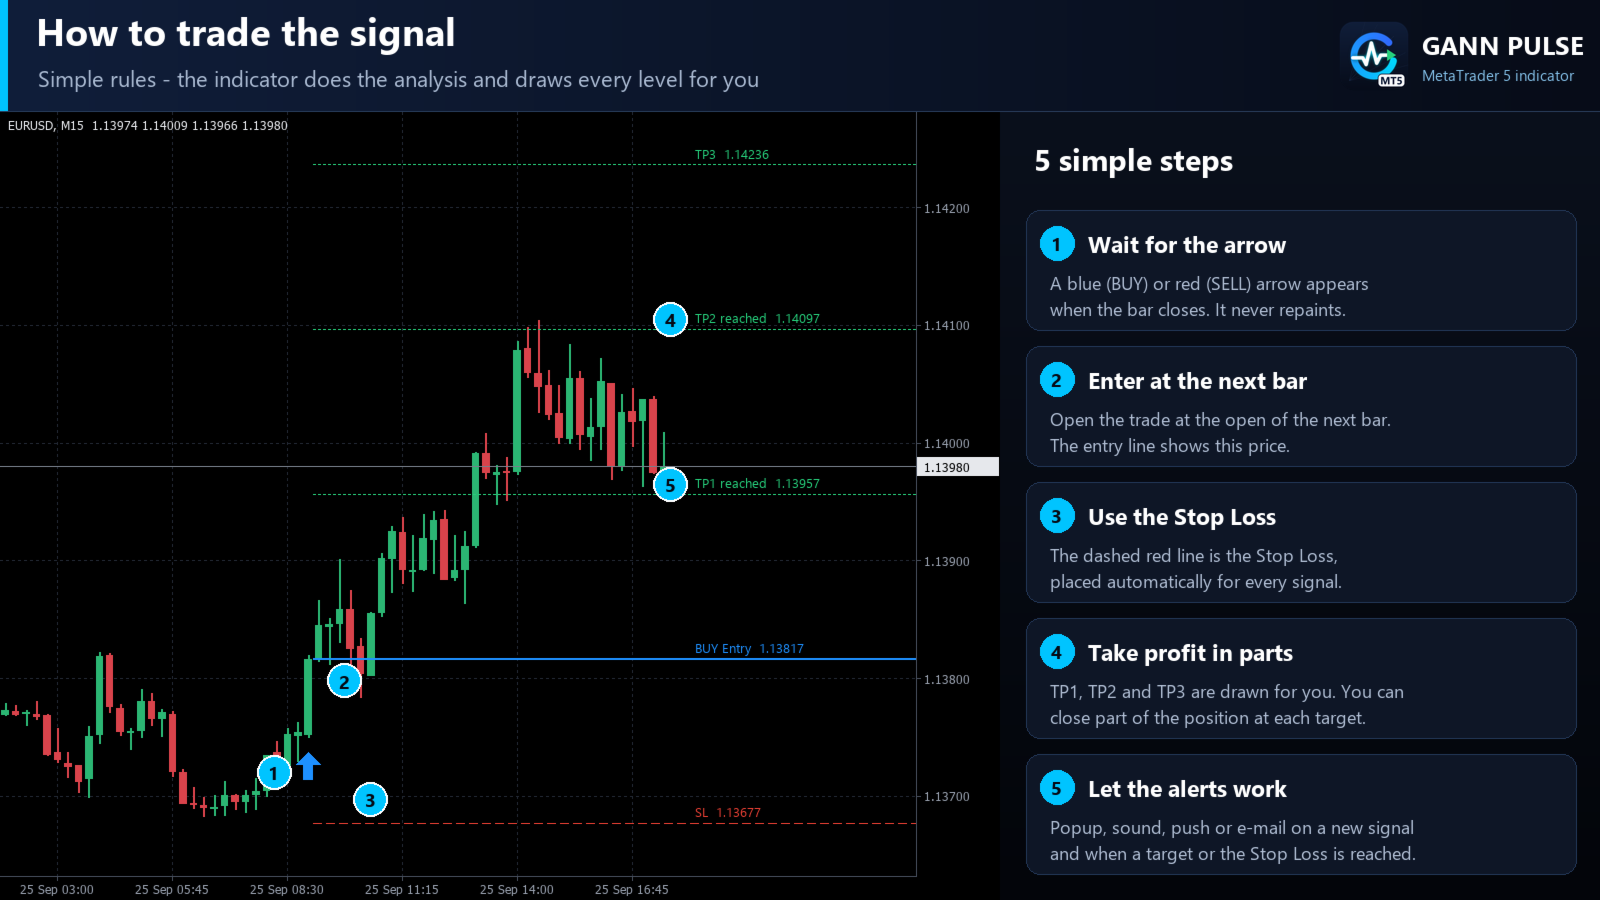
- Alerts: popup, sound, push notification and e-mail on every new signal, plus alerts when TP1, TP2, TP3 or the Stop Loss is reached.
- Any symbol and timeframe: Forex, Gold, indices, crypto. Nothing to optimize.
- Dashboard and alerts in 11 languages. Dark and light chart themes.
- 8 buffers for Expert Advisors (direction, arrows, entry, Stop Loss, TP1-TP3).
How to trade
1. Wait for an arrow. It appears only after the bar has closed.
2. Enter at the open of the next bar in the direction of the arrow.
3. Place the Stop Loss at the red dashed line.
4. Take profit at TP1, TP2 and TP3, for example one third of the position at each level, or hold until the opposite signal.
5. Optional filter: prefer signals that agree with the higher timeframe in the dashboard.
Recommendations
- Timeframes: M15 to H4 for day and swing trading. Lower timeframes give more signals and more noise.
- Symbols: major Forex pairs, Gold and indices with low spreads.
- Risk a small, fixed part of the account per trade (for example 1 percent) and calculate the lot size from the Stop Loss distance.
Statistics on your chart
The dashboard counts the signals of the last 180 days on the current symbol and timeframe: entry at the next bar open, exit at the Stop Loss, TP2 or the opposite signal, current spread included. These are hypothetical results calculated from price history and they differ from market to market. Use them to find the symbols and timeframes that suit your style. Past results do not guarantee future results.
Settings
Alerts: popup, sound, sound file, push notification, e-mail, level alerts.
Display: language, dark or light theme, dashboard on/off and corner, SL / TP levels, history boxes, EA mode.
Free demo
Download the demo and run it in the Strategy Tester in visual mode to see the arrows, levels and dashboard on any symbol before you buy.
After the purchase, send me a private message: I will send you the user guide and answer your questions.