Deep Reaper
- Experts
- Version: 1.8
- Activations: 5

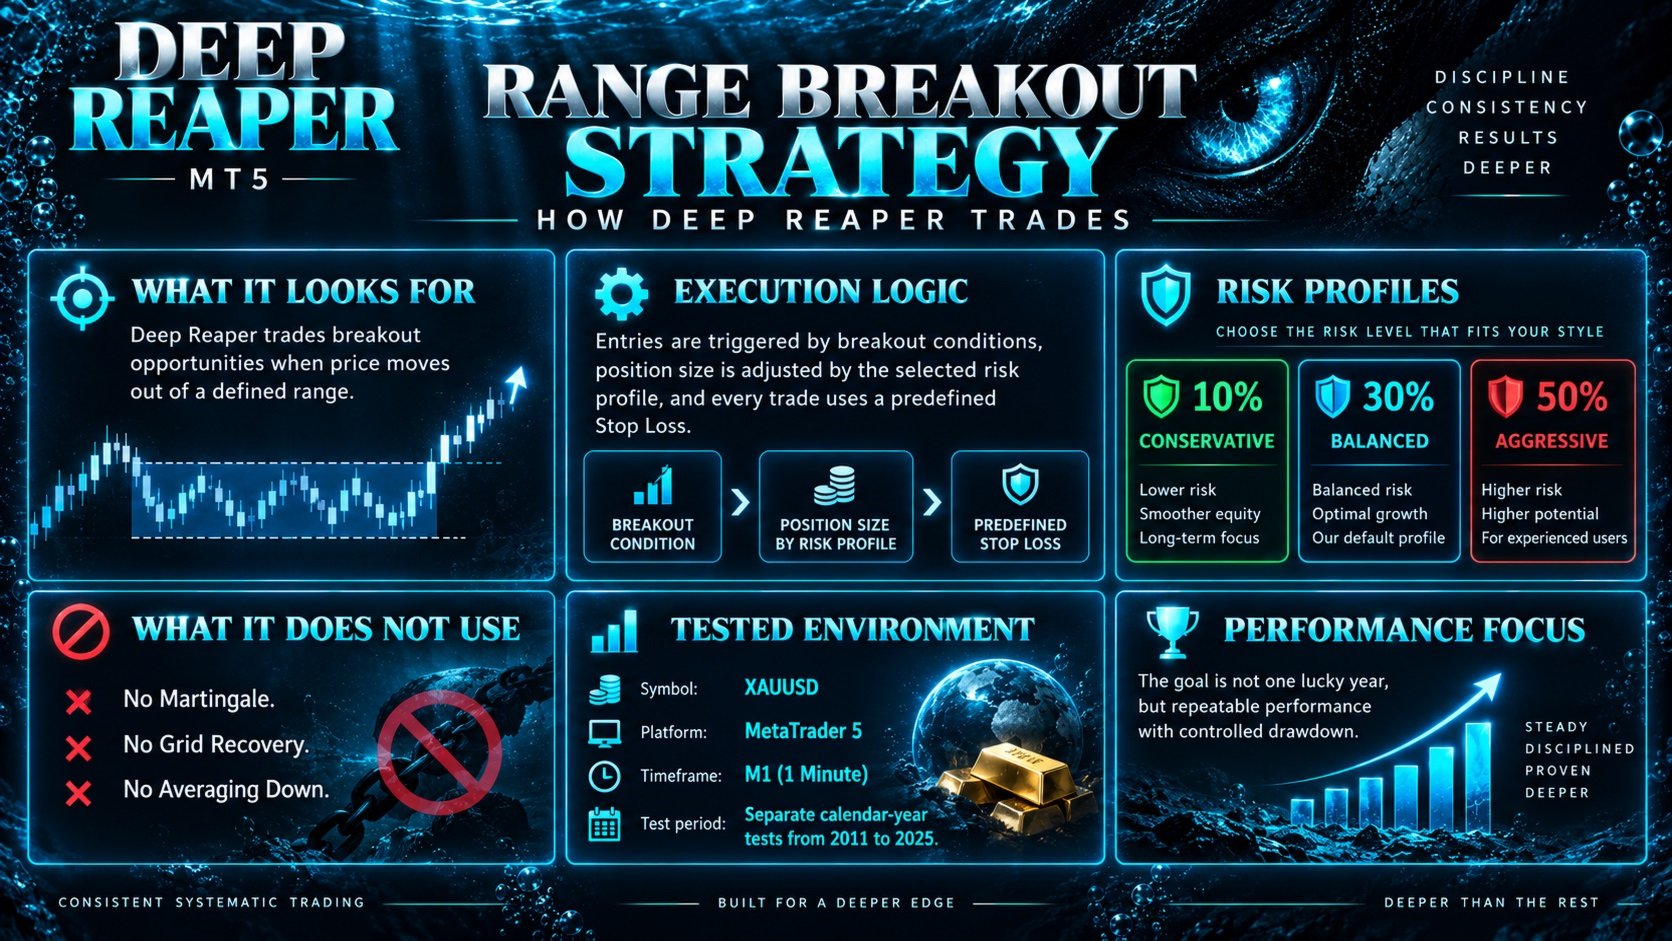
Deep Reaper is an automated Expert Advisor for XAUUSD in MetaTrader 5, built around a price range breakout logic.
The system identifies a formed range, waits for a confirmed price breakout beyond its boundaries, and opens a trade according to the algorithm rules. Position size is scaled by the selected risk level, and every open position is protected by Stop Loss.
To evaluate the system, we use separate calendar-year backtests from 2011 through 2025 rather than one long compounded test. Every year starts with the same $10,000 deposit. This makes it possible to compare return, Profit Factor, and drawdown for each year directly.
Key Features
· Strategy: Range Breakout.
· Symbol: XAUUSD.
· Platform: MetaTrader 5.
· Working timeframe: M1.
· Test period: 2011-2025.
· Test format: separate backtest for each calendar year.
· Initial deposit for every yearly test: $10,000.
· Risk profiles shown: 10%, 30%, and 50%.
· 15 of 15 calendar years ended with positive net profit in all three profiles.
How the Strategy Works
Deep Reaper is based on a range breakout approach. The EA monitors price structure and creates a trading scenario when price exits a predefined area.
The purpose is not to predict market tops or bottoms, but to participate in movement after price leaves the range. When a trading signal appears, the EA calculates position size according to the selected risk level and manages the trade automatically.
The algorithm includes:
· range detection and evaluation;
· breakout-condition control;
· automatic position-size calculation;
· protective Stop Loss;
· open-position management;
· overall EA risk control.
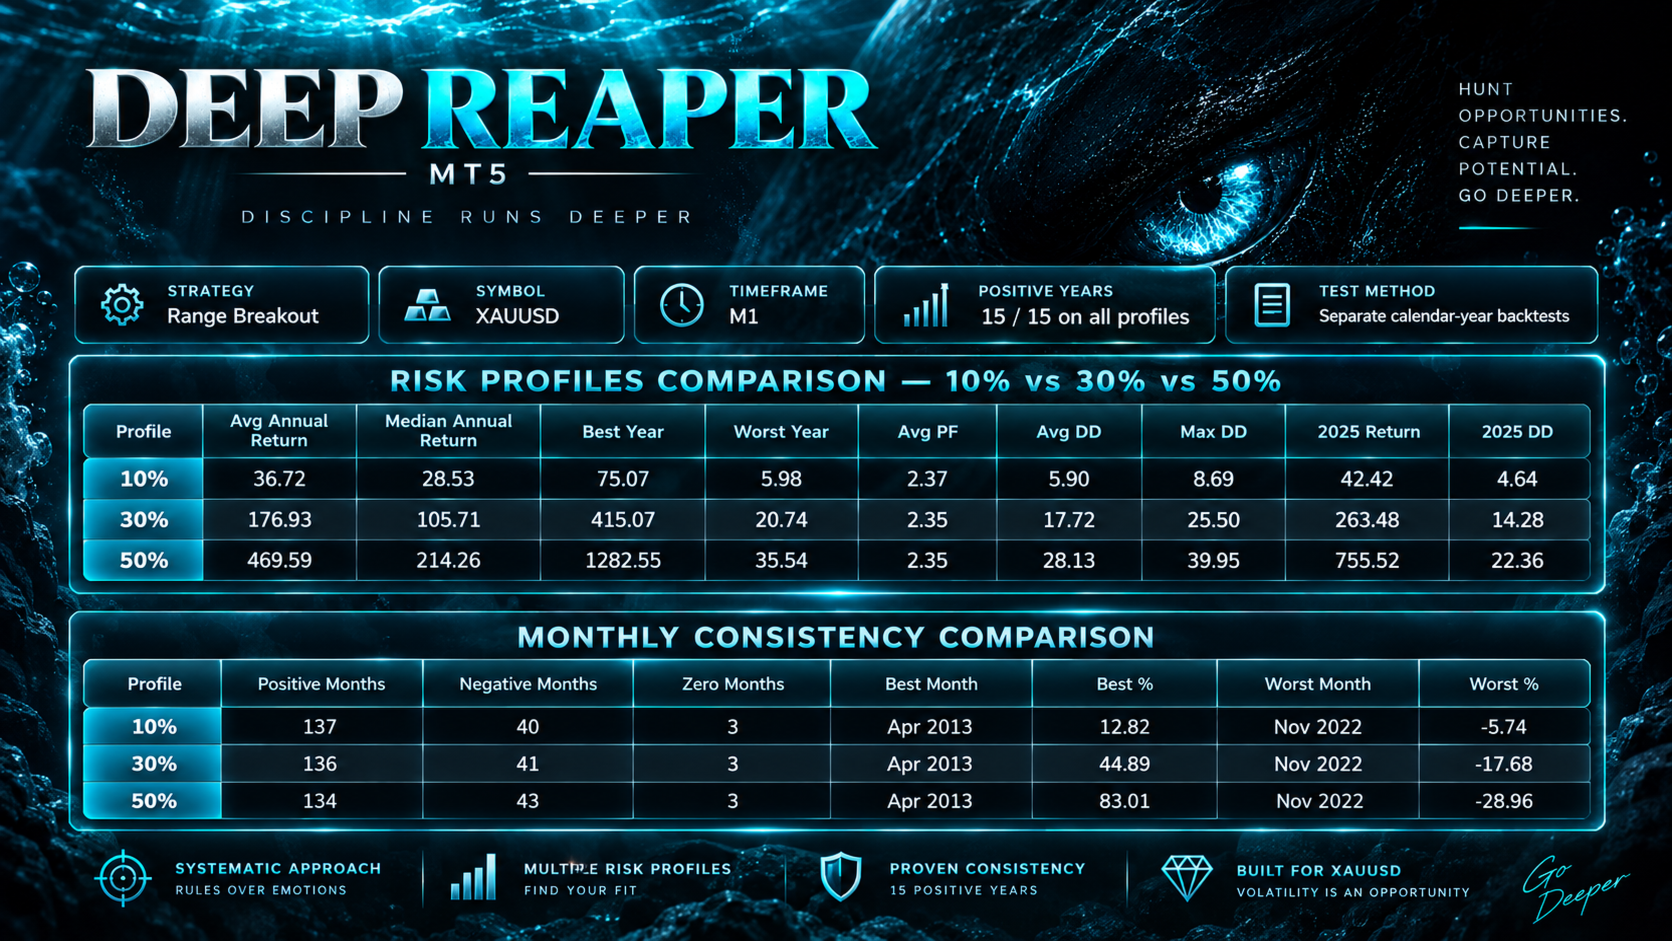
Historical Results by Risk Profile
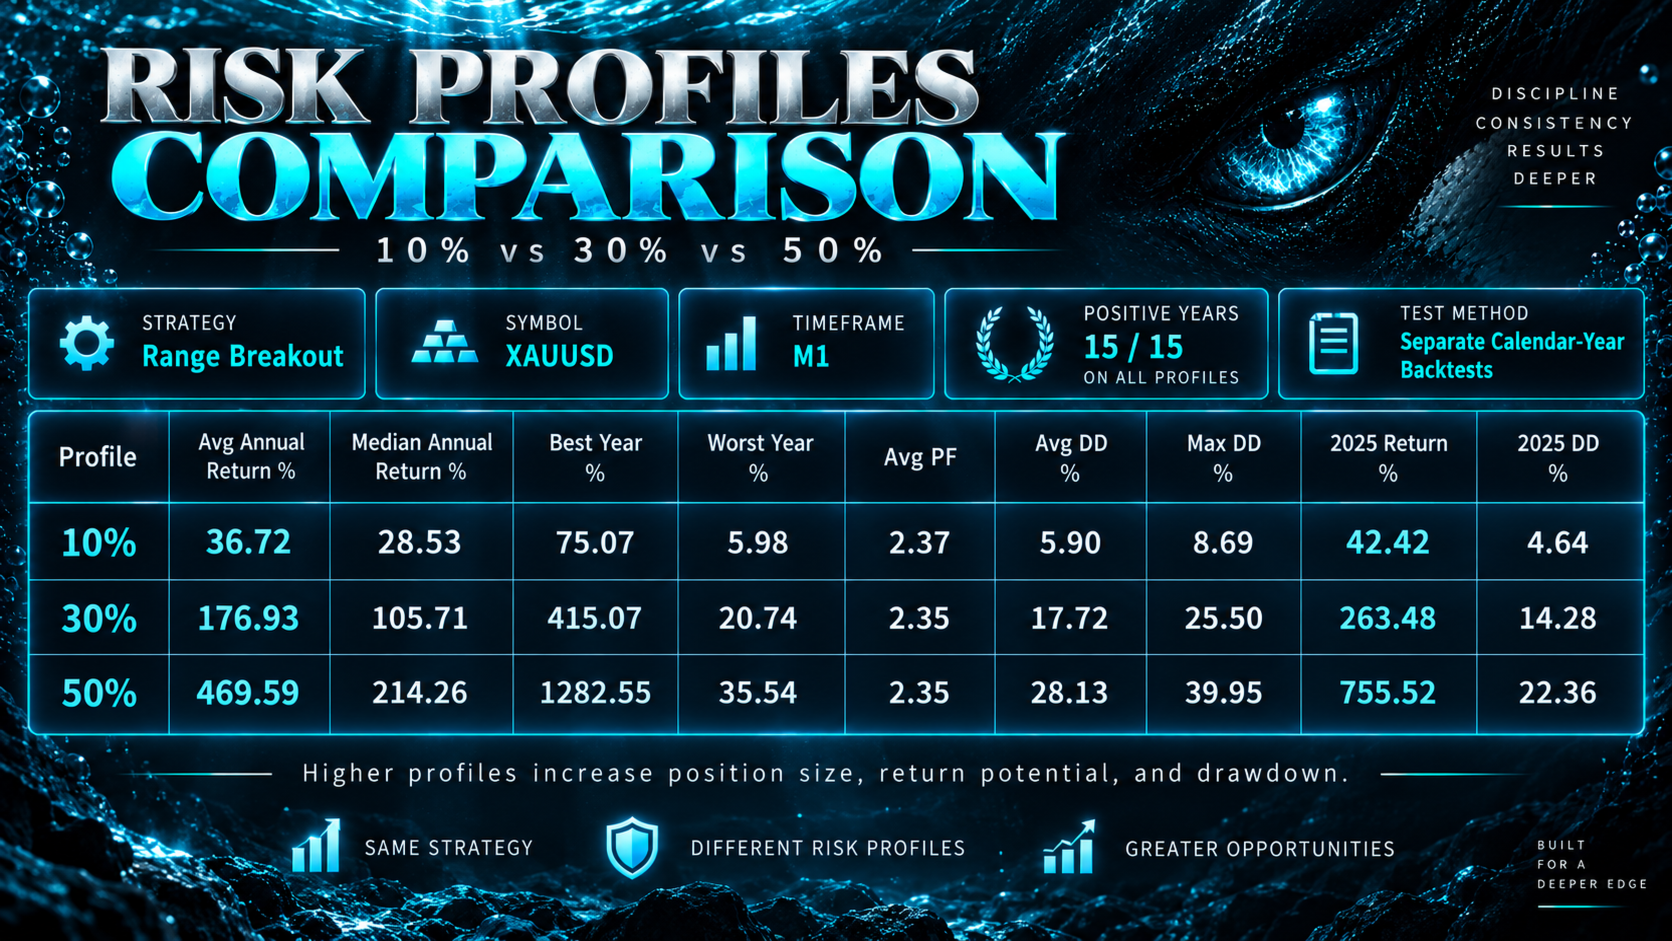
| Metric | 10% Profile | 30% Profile | 50% Profile |
| Profitable years | 15 / 15 | 15 / 15 | 15 / 15 |
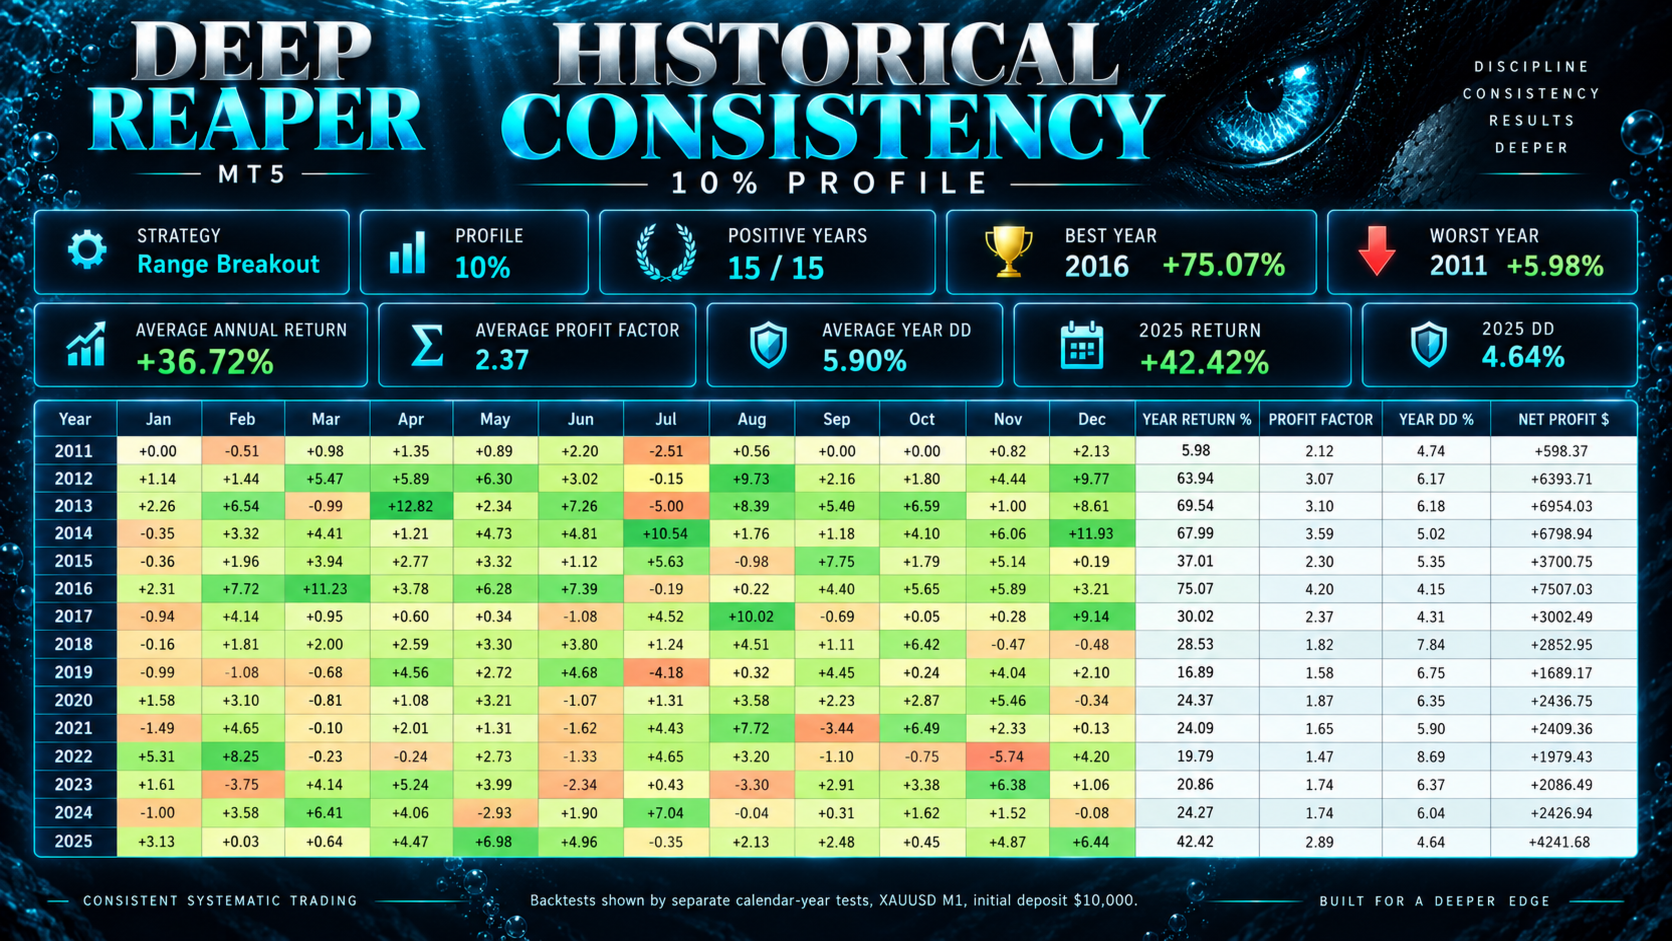
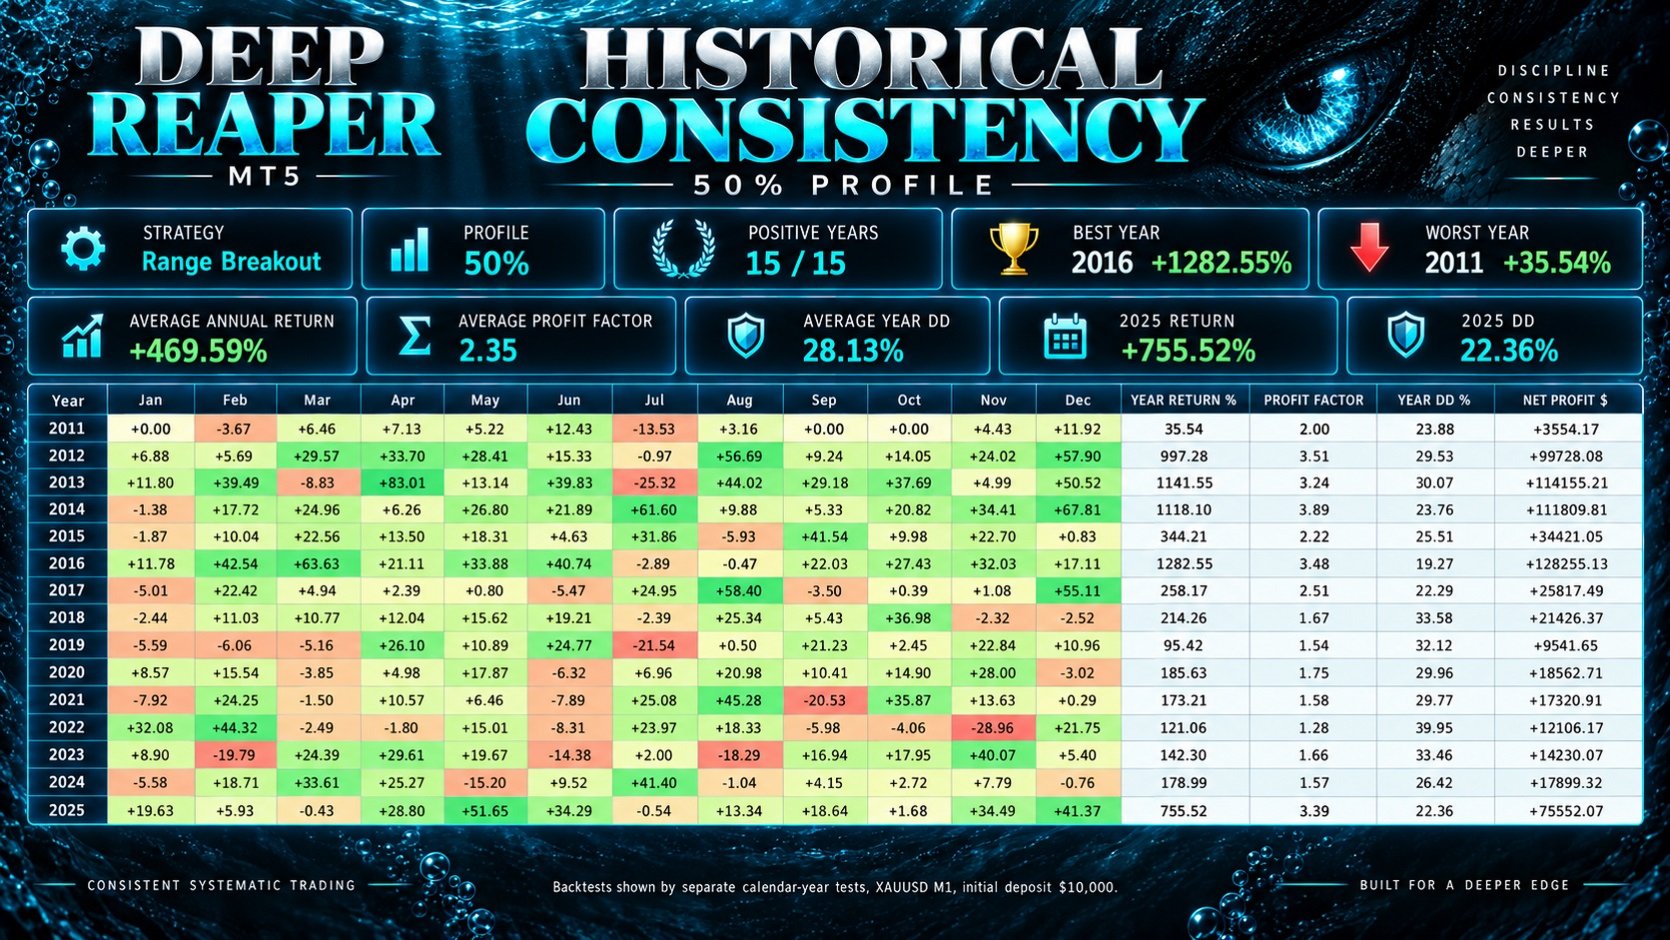
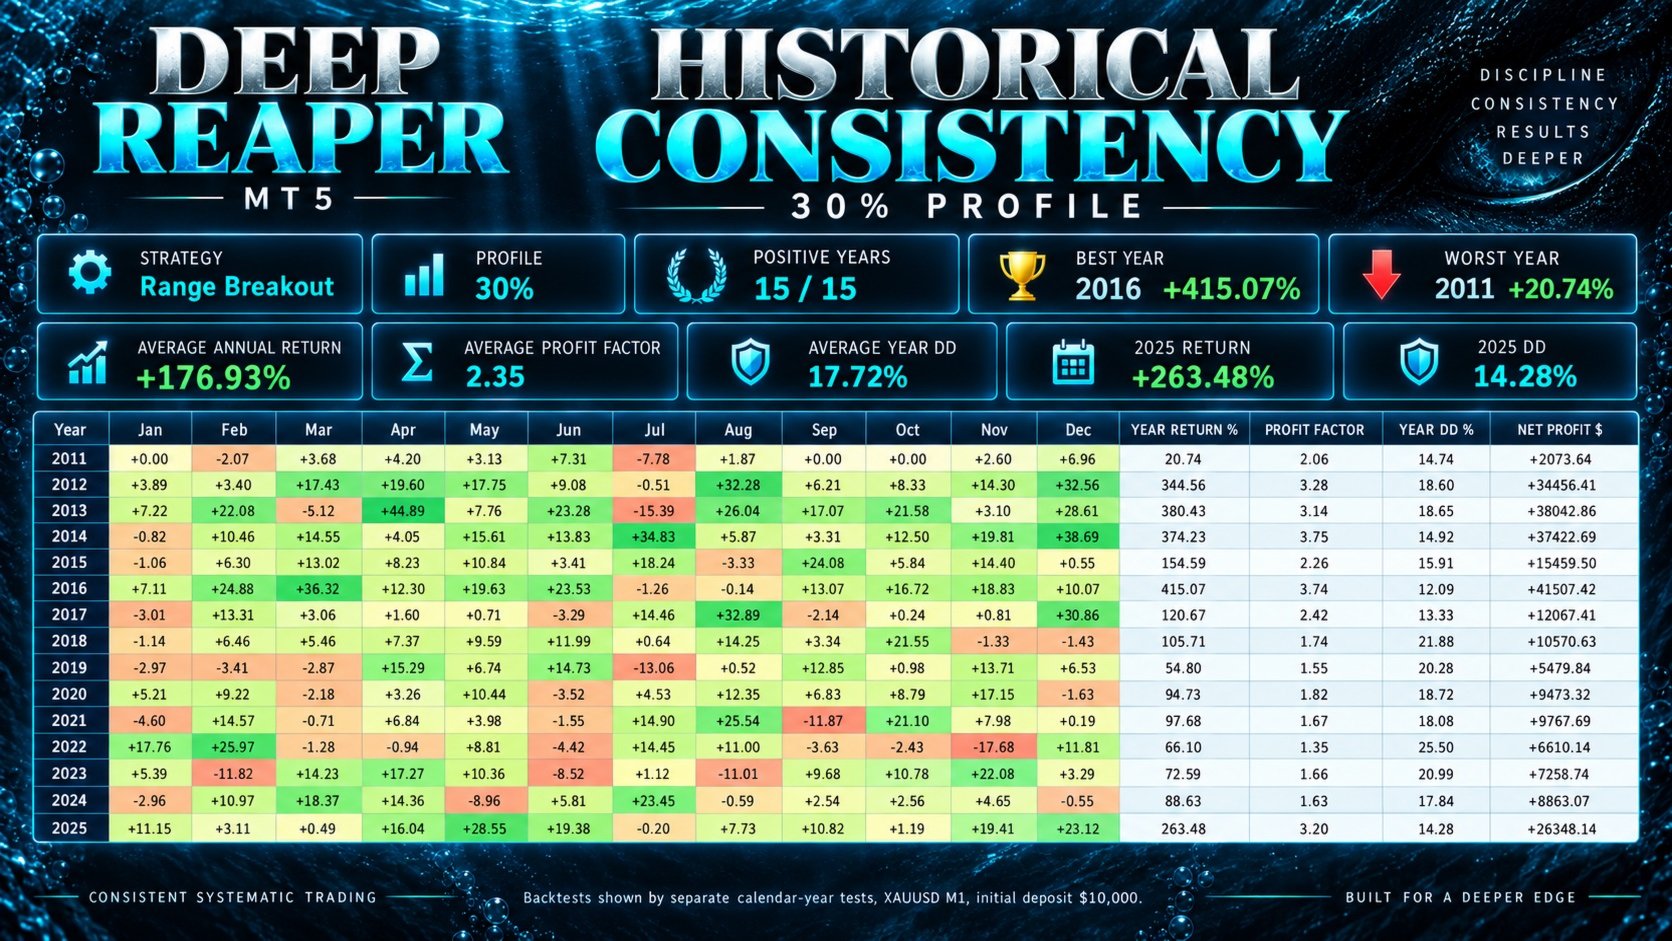
| Average annual return | +36.72% | +176.93% | +469.59% |
| Median annual return | +28.53% | +105.71% | +214.26% |
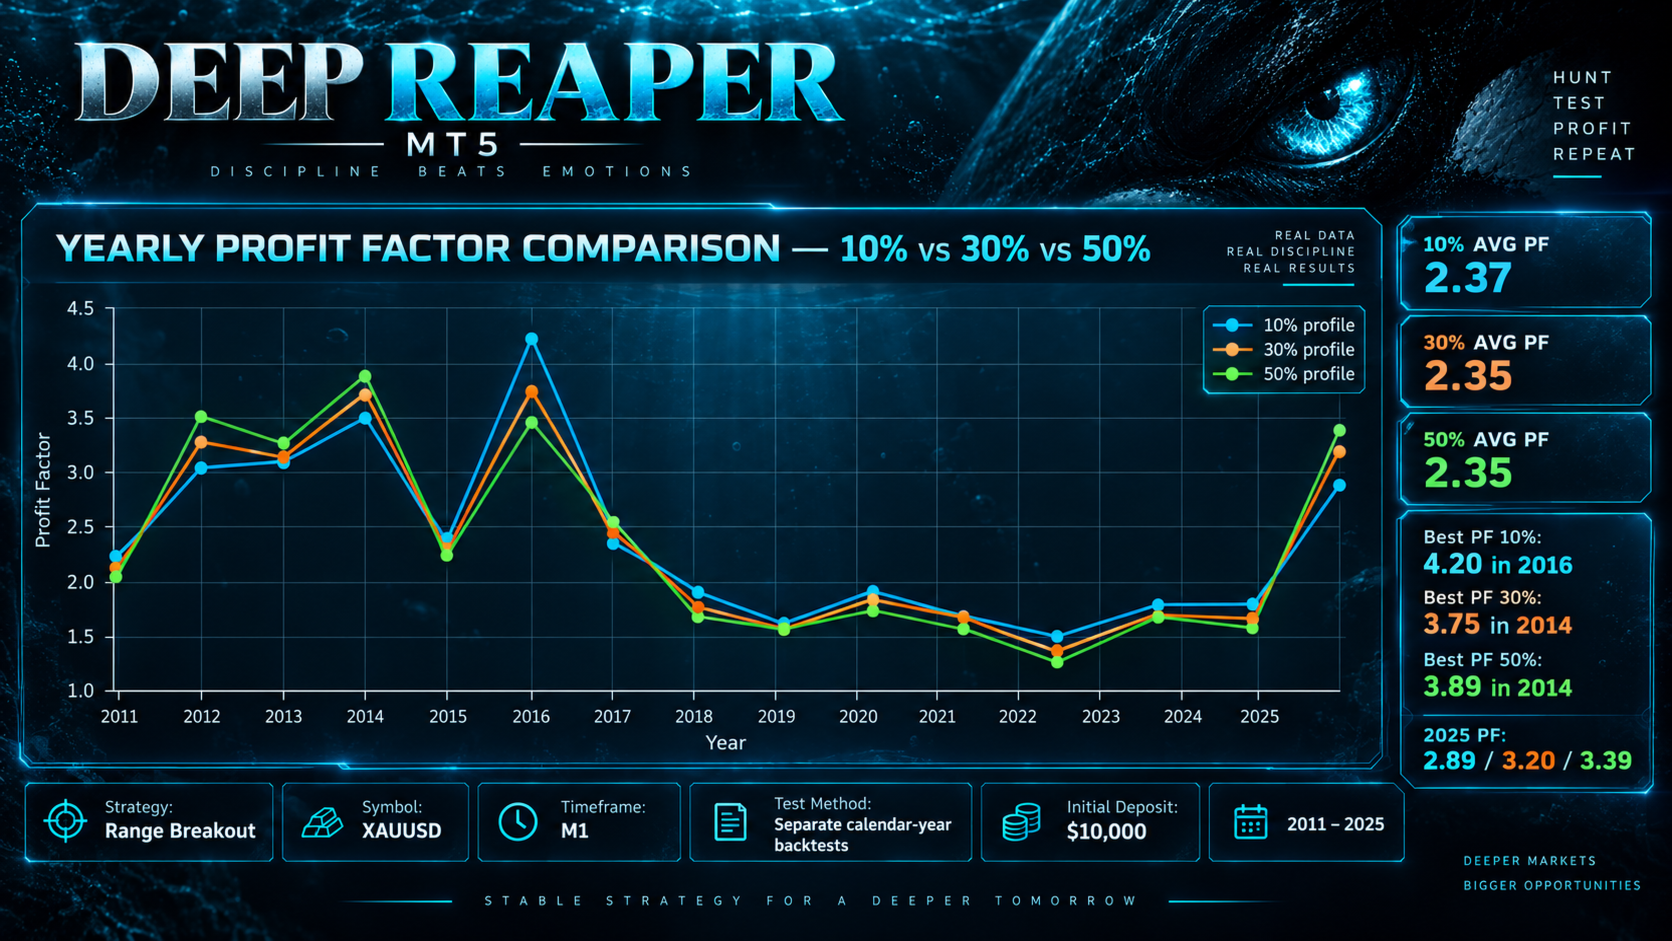
| Average Profit Factor | 2.37 | 2.35 | 2.35 |
| Average yearly Equity DD | 5.90% | 17.72% | 28.13% |
| Maximum yearly Equity DD | 8.69% | 25.50% | 39.95% |
| Best year | 2016: +75.07% | 2016: +415.07% | 2016: +1282.55% |
| Worst year | 2011: +5.98% | 2011: +20.74% | 2011: +35.54% |
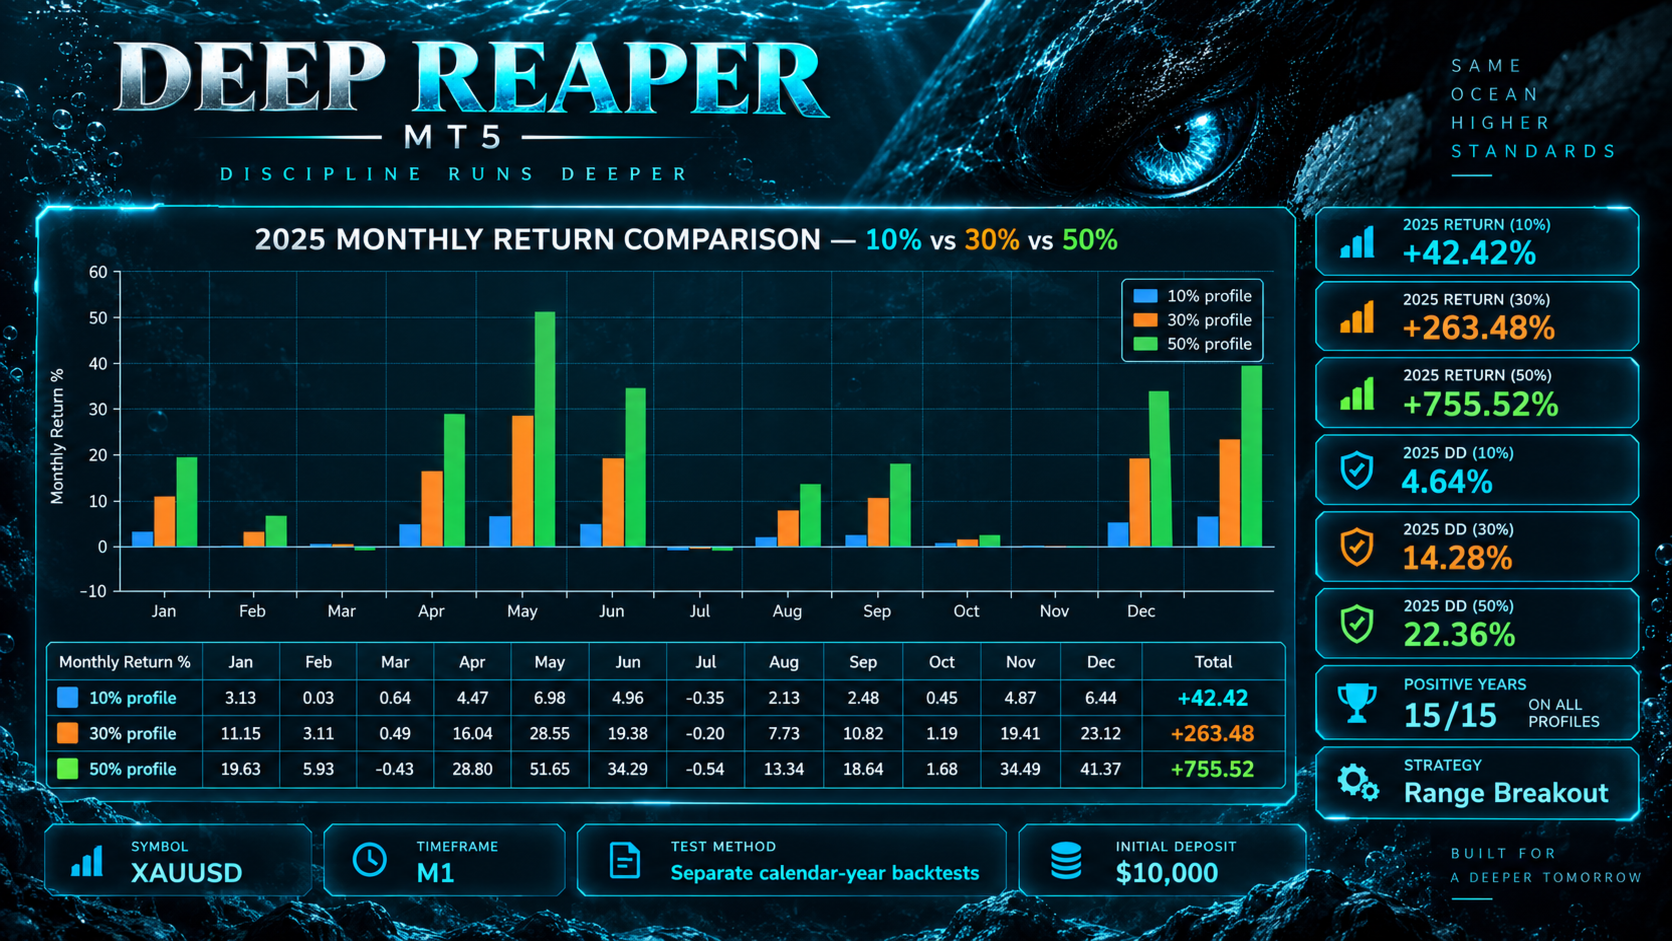
| 2025 return | +42.42% | +263.48% | +755.52% |
| 2025 Equity DD | 4.64% | 14.28% | 22.36% |
| 2025 Profit Factor | 2.89 | 3.20 | 3.39 |
How to Read the Return
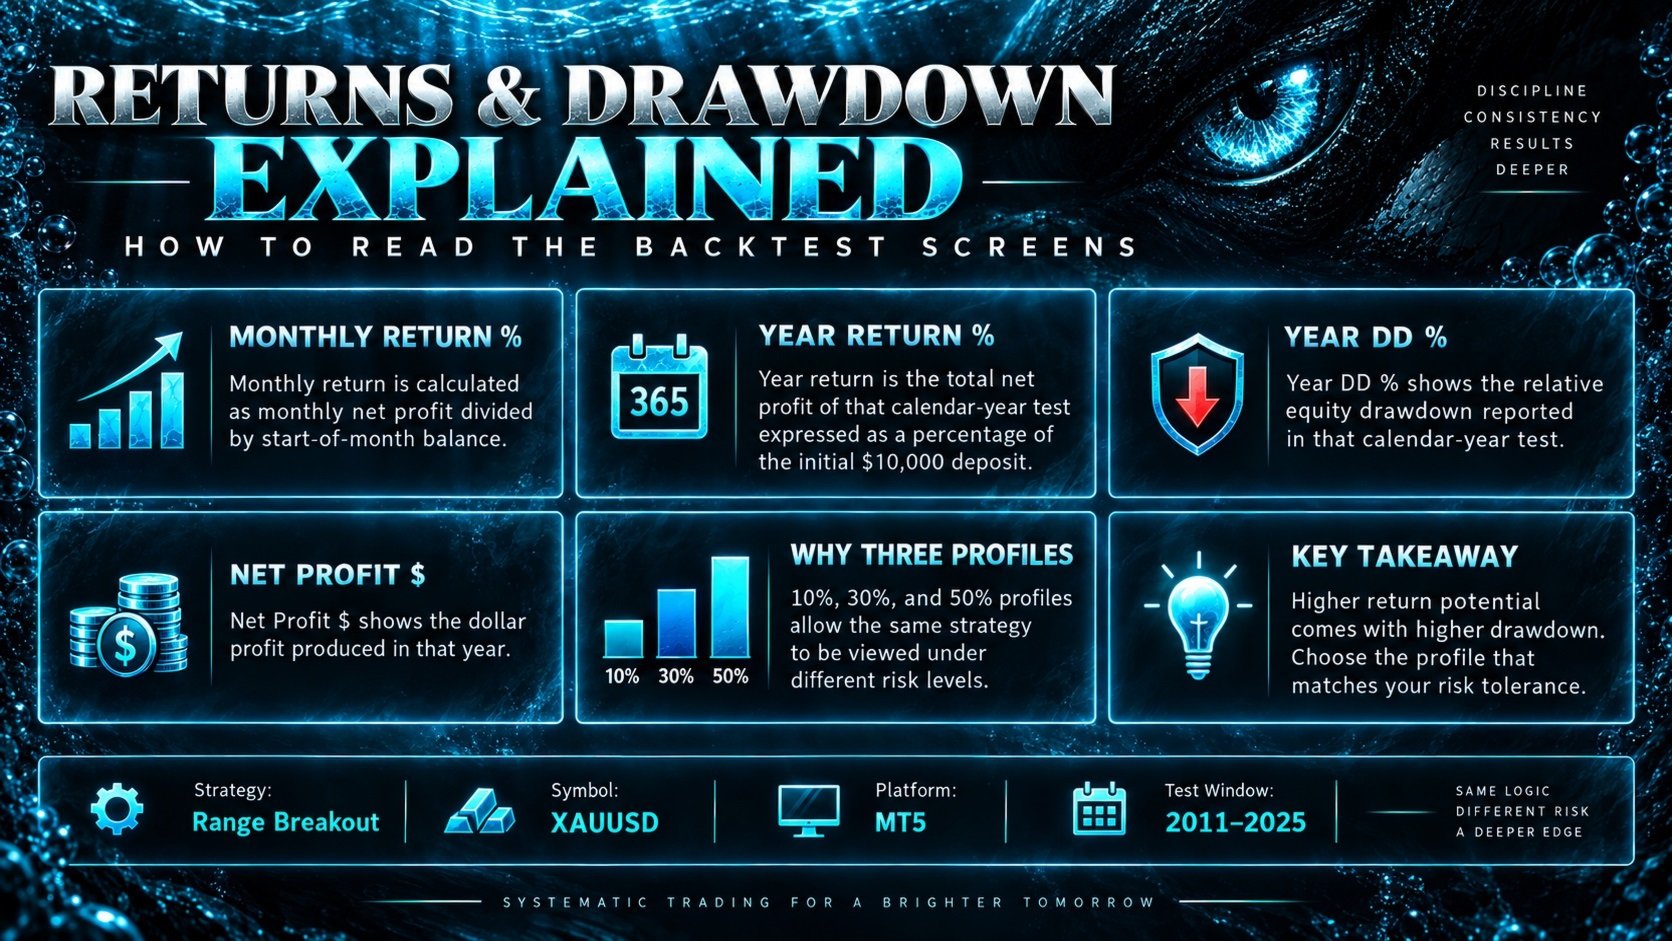
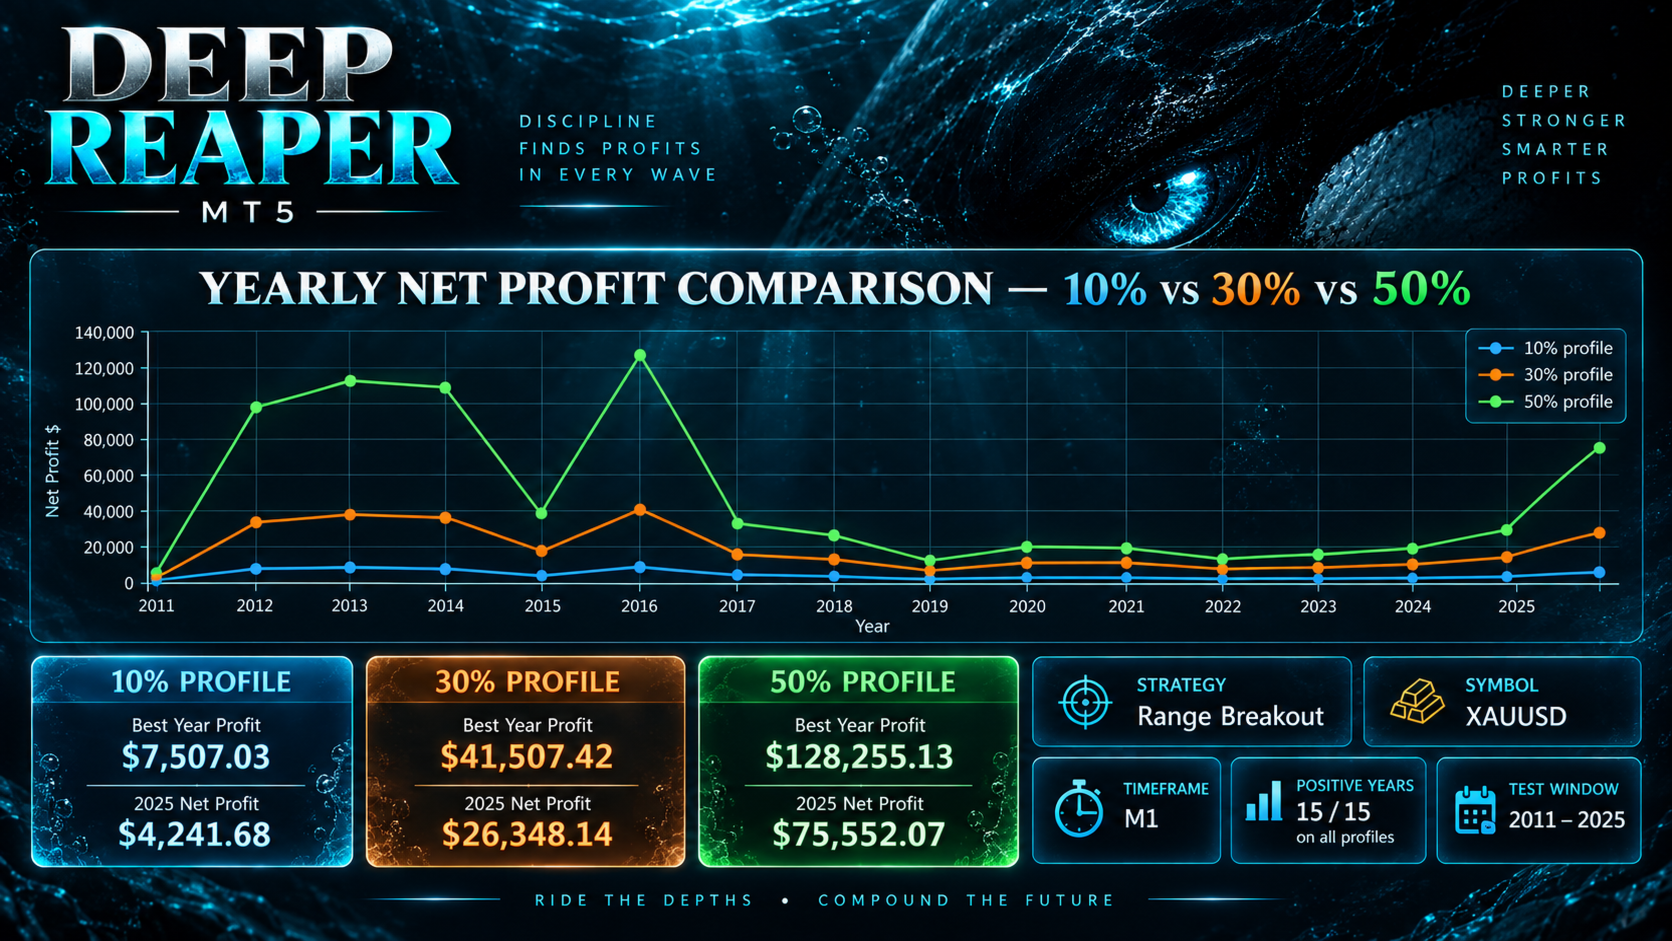
The annual return shown in the screenshots is calculated separately for each calendar year. Because every yearly test starts with $10,000, Year Return % shows the net profit of that specific year relative to the same starting base.
For example, +42.42% in the 10% profile for 2025 means a net profit of $4,241.68 from a $10,000 starting deposit. In the 30% profile the same 2025 period produced +263.48% ($26,348.14), and in the 50% profile +755.52% ($75,552.07).
This format is important for year-to-year comparison: the 2012 result does not increase the starting capital for 2013, so a strong year does not inflate later years through inter-year compounding.
How to Read Drawdown
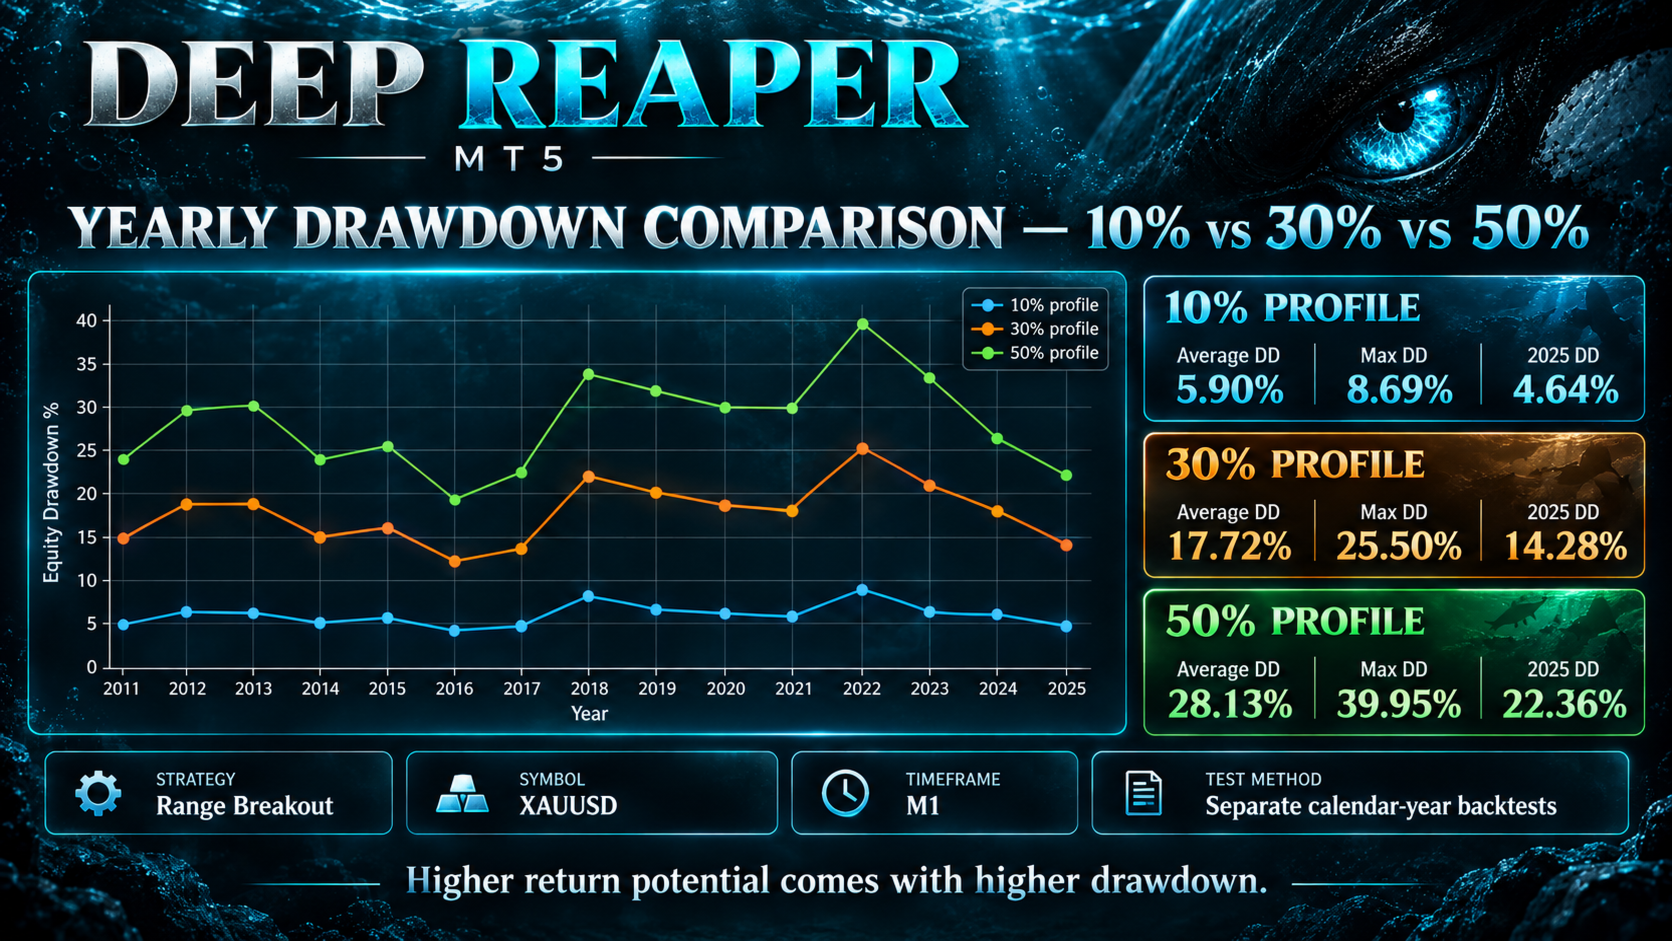
Year DD % is the relative equity drawdown recorded inside a specific calendar-year test. It shows how far equity fell from a previous local peak during that year.
The yearly backtests show the expected relationship: when the risk profile increases, both potential return and drawdown increase.
| Profile | Average yearly DD | Maximum yearly DD | 2025 DD |
| 10% | 5.90% | 8.69% | 4.64% |
| 30% | 17.72% | 25.50% | 14.28% |
| 50% | 28.13% | 39.95% | 22.36% |
In other words, 10%, 30%, and 50% are three different risk scales of the same trading logic. This allows the buyer to compare how the same strategy behaves at different levels of aggressiveness.
Monthly Consistency
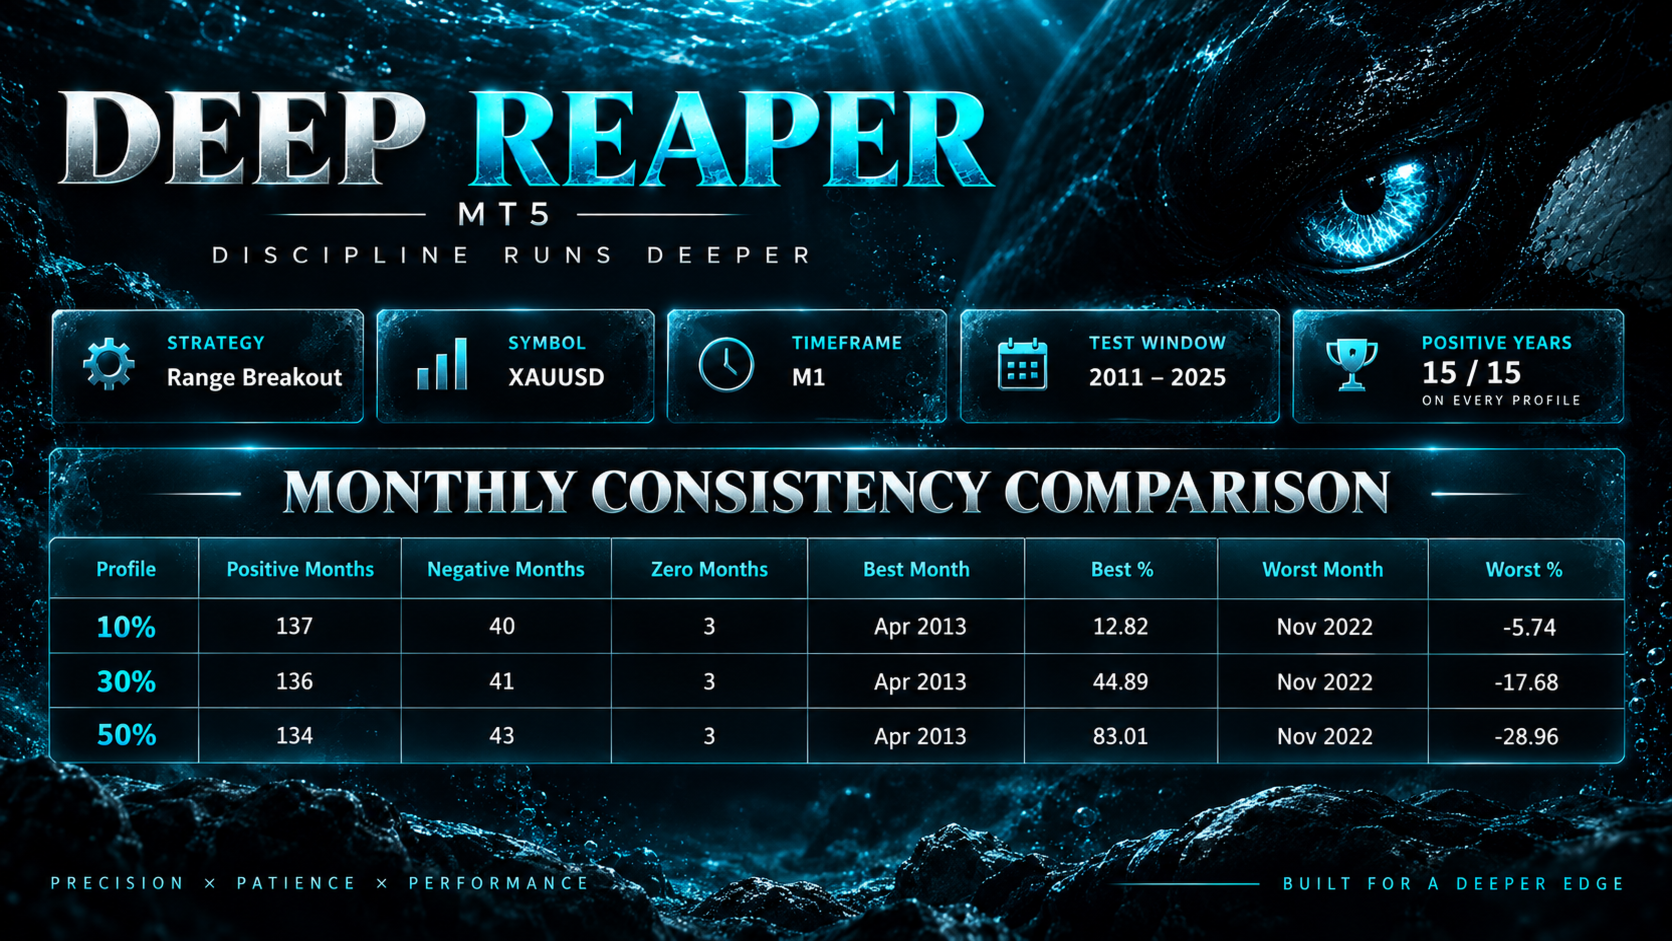
In addition to yearly results, all 180 calendar months from 2011 through 2025 were calculated for every profile.
| Profile | Positive months | Negative months | Zero | Best month | Worst month |
| 10% | 137 / 180 | 40 / 180 | 3 | Apr: +12.82% | Nov: -5.74% |
| 30% | 136 / 180 | 41 / 180 | 3 | Apr: +44.89% | Nov: -17.68% |
| 50% | 134 / 180 | 43 / 180 | 3 | Apr: +83.01% | Nov: -28.96% |
The number of profitable months remains close across all three profiles. As risk increases, the main change is the scale of both positive and negative monthly results.
Profit Factor
Profit Factor is the ratio of total gross profit from winning trades to total gross loss. The average yearly Profit Factor for 2011-2025 was 2.37 for the 10% profile, 2.35 for the 30% profile, and 2.35 for the 50% profile.
The fact that average Profit Factor remains close across the different profiles indicates that scaling risk mainly changes the size of the financial result and drawdown rather than the underlying profit-to-loss relationship of the trading logic.
Choosing a Risk Profile
10% Profile. The lowest of the three presented risk levels. In the yearly tests: average return +36.72%, average Equity DD 5.90%, maximum yearly Equity DD 8.69%.
30% Profile. The middle risk-scaling level. In the yearly tests: average return +176.93%, average Equity DD 17.72%, maximum yearly Equity DD 25.50%.
50% Profile. The most aggressive of the three presented levels. In the yearly tests: average return +469.59%, average Equity DD 28.13%, maximum yearly Equity DD 39.95%.
How Losses Are Handled
Deep Reaper does not build its results on unlimited expansion of a losing position. Every trading position is opened with a protective Stop Loss.
The EA does not use:
· martingale;
· grid orders to rescue a losing position;
· averaging down;
· unlimited recovery chains.
Requirements
| Parameter | Requirement |
| Platform | MetaTrader 5 |
| Symbol | XAUUSD |
| Working timeframe | M1 |
| Account type | Hedging |
Setup
1. Open an XAUUSD M1 chart.
2. Attach Deep Reaper to the chart.
3. Enable algorithmic trading.
4. Select Drawdown, %.
After launch, the EA calculates position size and manages trades automatically according to the algorithm.
What the 2011-2025 Test Series Shows
The purpose of the yearly series is not to show one favorable long backtest, but to let the buyer see Deep Reaper across 15 different calendar periods using the same starting base.
In all three profiles, every one of the 15 calendar years ended with positive net profit. The screenshots also show not only return, but Profit Factor and actual Equity Drawdown for each individual year.