Volume Support Resistance Map
- Indicators
- Version: 1.0
- Activations: 5

# Volume Support Resistance Map - Supports and resistances drawn by volume
*Category: Experimental | Difficulty: intermediate | Window: chart window (overlaid on price) | Markets: Universal (Forex, indices, commodities, crypto, stocks) | Suggested timeframes: M15, M30, H1, H4, D1*
## Short description
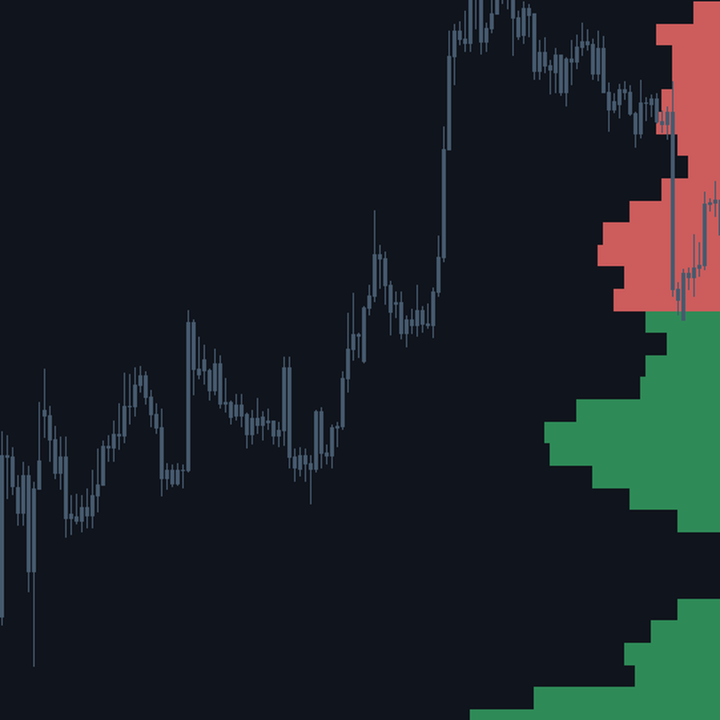
> Horizontal bars drawn on the chart, long in proportion to the volume traded at each level: above price the selling volume marking resistances, below it the buying volume marking supports.
## Full description
### Overview
Supports and resistances are usually drawn by hand by looking at where price stalled in the past. Volume Support Resistance Map derives them instead from volume, which is objective data, and draws them directly on the chart as horizontal bars. The history window is split into price bands and for each band the volume traded there is accumulated: the higher the volume, the longer the bar. The distinction between the two sides is the heart of the indicator. Above the current price only the bars of volume attributed to selling are shown: these are the levels where most selling occurred in the past and where resistance is therefore reasonable to expect. Below the current price only the bars of volume attributed to buying are shown: these are the levels where most buying occurred and where support is expected. Two distinct colours make the reading immediate at a glance, with no need to consult any numeric scale.
### How the calculation works
1. The high and low of the last InpLookback bars are located and that interval is split into InpBins price bands of equal height.
2. Each bar volume is split between buying and selling based on where the close falls within the bar range: a close on the high assigns everything to buying, a close on the low everything to selling, a close in the middle splits it evenly.
3. The split volume is then distributed evenly across all the bands the bar spans, from its low to its high: the standard volume profile convention.
4. For each band the value to show is chosen: above the current price the selling volume is used, below the current price the buying one.
5. The length of the horizontal bar is proportional to the band volume relative to the maximum shown, capped at InpMaxLength chart bars.
6. Bands whose volume stays below InpMinPercent of the maximum are not drawn: they are levels too insignificant and would clutter the chart without adding information.
### How to use it
- Long bars above price indicate the levels with the greatest concentration of past selling: the first obstacles expected on an upward move.
- Long bars below price indicate where buying concentrated: the levels where an attempt at support is reasonable to expect.
- Areas where no bar appears are low volume zones: price tends to cross them quickly because it meets nothing to hold it back.
- The single longest bar is the highest traded level of the window and is the natural reference for placing targets and stops.
- Raising InpBins produces thinner bands and more precise levels, but also a more jagged profile: lowering it gives a more synthetic and stable reading.
### Who it is for and on which timeframes
It suits anyone working with supports and resistances who wants to derive them from objective data instead of drawing them by hand. Difficulty is intermediate: the reading is visual and immediate, with no scale to interpret, but you need to understand where the buy versus sell distinction comes from. It works from M15 to D1 and on any instrument. In Forex the terminal normally provides tick volume only, which counts price changes rather than lots traded: it remains a good activity measure nonetheless. On futures and stocks, where real volume is available, the indicator should be set to that volume type and the result is more meaningful.
### Practical example of reading a signal
On EURUSD H1 price sits at 1.0860. Above, two red bars stand out clearly: one at 1.0895 and a much longer one at 1.0930. Below, a marked green bar sits at 1.0820 and a shorter one at 1.0785. Between 1.0865 and 1.0890 nothing appears: a low volume area. The reading is direct. An upward move should cross the empty zone quickly to 1.0895, where it meets the first resistance, and find the main obstacle at 1.0930. A target at 1.0925 makes more sense than one at 1.0940, which would require crossing the heaviest selling level of the window. On the other side, a stop placed just below 1.0820 would be protected by the strongest available support. Over the next eighteen bars price rises, crosses the empty area in three bars and stalls at 1.0928, just below the longest red bar.
## Input parameters
| Parameter | Default | Description |
|---|---|---|
| `InpLookback` | 500 | Bars of history to analyse. It is the main parameter: it defines which period the profile is showing. Wide windows give more stable levels, short ones more current levels. The safety limit is five thousand bars. |
| `InpBins` | 60 | Number of bands the price range is split into. More bands mean more precise levels but a more jagged profile. The value is kept between ten and two hundred. |
| `InpMaxLength` | 60 | Maximum length of the horizontal bars, in chart bars. The band with the highest volume reaches this length; all others are proportionally shorter. |
| `InpMinPercent` | 5.0 | Minimum volume to draw a band, as a percentage of the maximum shown. Raising it leaves only genuinely relevant levels on the chart and reduces clutter. |
| `InpVolumeType` | VOLUME_TICK | Volume type used. In Forex usually only tick volume is available; on futures and stocks it is better to set real volume, which makes the profile more meaningful. |
| `InpBuyColor` | clrSeaGreen | Colour of the bars below price, that is the supports built on buying volume. |
| `InpSellColor` | clrIndianRed | Colour of the bars above price, that is the resistances built on selling volume. |
| `InpFilled` | true | Draws the bars filled instead of outlined. Filled bars are more readable, outlines leave the chart cleaner. |
| `InpPrefix` | VSRMap | Prefix for the graphical object names. It must be changed if two instances of the indicator are applied to the same chart, otherwise the second deletes the objects of the first. |
## Advantages / strengths
- The levels derive from objective data instead of manual drawing, so two people looking at the same chart see the same levels.
- The two sided distinction, selling volume above and buying below, makes it immediate to read where obstacle and where support are expected.
- Areas with no bars are as informative as long bars: they flag the zones price tends to cross quickly.
- The objects are drawn behind the candles and are not selectable, so they do not interfere with chart work and remove themselves on shutdown.
## Limitations and warnings
- The separation between buying and selling is not observable: no terminal data says who bought and who sold. Splitting by close position is a widespread and defensible convention, but it remains an estimate.
- In Forex the available volume is tick volume, which counts price changes and not lots traded: a measure of activity, not of money moved.
- The profile refers to the current window and is recomputed on every new bar: the horizontal bars change over time and are not fixed levels.
- A high volume level is no guarantee of holding: it describes where a lot was traded in the past, not where price will stop.
- With many bands and wide windows the number of graphical objects grows and can slow the chart on less powerful computers.
**Repaint notice:** this indicator redraws part of its values on already formed bars. The profile is a snapshot of the current window, not a historical series of signals: when a new bar arrives the window advances, the horizontal bars are recomputed and may change length or disappear. No past trading signal is altered, because the indicator produces none, but you should know the drawing is not fixed over time. Recomputation happens once per closed bar, never on every tick.
**Disclaimer.** This product is a technical analysis tool, not an automated trading system, and it offers no profit guarantee whatsoever. Financial markets carry the risk of total loss of the invested capital. Past performance is not indicative of future results. Every signal must be confirmed with your own analysis, a money management plan and prior testing on a demo account. The author is not responsible for trading decisions taken on the basis of this indicator.
## Suggested tags / keywords for MQL5
`volume profile`, `support resistance`, `volume`, `levels`, `horizontal bars`, `market profile`, `chart objects`, `experimental`