FiboTrend Compass Pro
- Indicators
-
Jeffrey Quiatchon
 A developer and side-hustle trader :)
 - Version: 1.0
- Activations: 5
Stop guessing where a pullback ends.
Most traders can spot a trend. The hard part is the entry — buying too early into a falling knife, or chasing after the move has already gone. Fibonacci Trend Compass solves exactly that one problem, and it does it on autopilot.
Three steps, fully automatic:
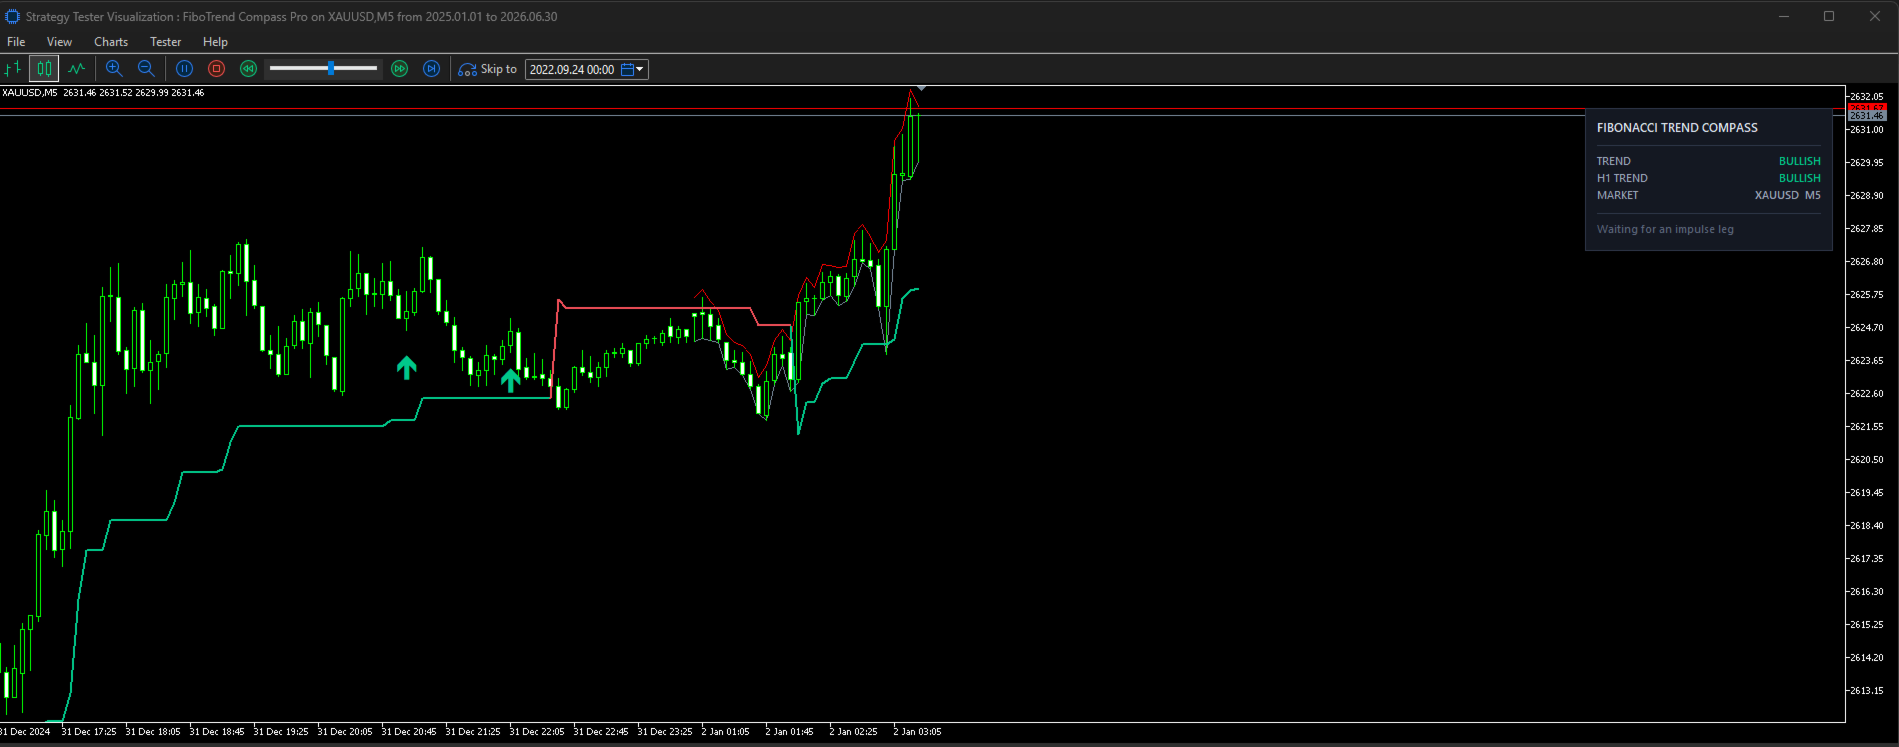
- It reads the trend. An adaptive ATR trend engine paints the chart green or red and tells you which side of the market you are allowed to trade.
- It maps the impulse leg. Confirmed swing highs and lows — not guesswork — define the move that just happened.
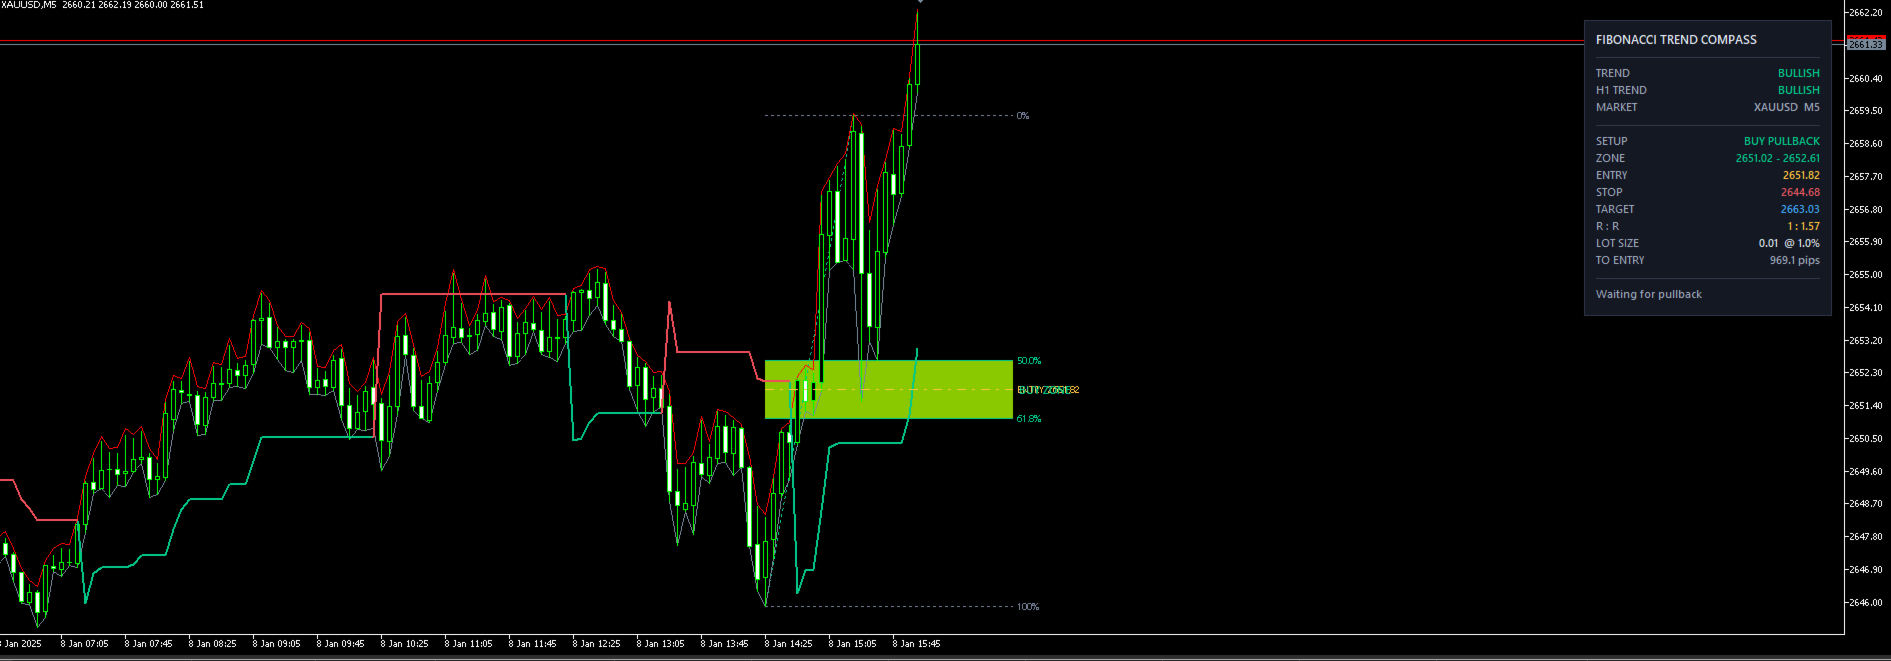
- It draws your trade. The Fibonacci retracement zone is projected forward with a precise Entry, Stop Loss, Take Profit, live risk-to-reward ratio, and the exact lot size for your chosen risk percentage.
When price pulls back into the zone, you get an arrow and an alert. That is the whole system. Nothing to interpret.
The strict trend rule
Most Fibonacci tools draw a retracement on every swing they find, leaving you to decide which ones are worth taking. This one refuses to.
A zone is drawn only while it agrees with the trend. If the last impulse leg points against the trend — or against the higher timeframe — it is not treated as a weak setup or a low-probability setup. It is not a setup at all. Nothing is drawn, nothing is exported to your EA, and no alert can fire. The dashboard tells you plainly that a leg was found and filtered out.
The moment the trend turns to agree, the zone appears. The moment it stops agreeing, the zone is gone. Your chart only ever shows trades you are allowed to take.
What you get
- The strict trend rule, enforced everywhere. On the chart, in the dashboard, in the alerts and in the buffers your EA reads. There is no setting to weaken it.
- Higher-timeframe confirmation. The same trend engine runs one timeframe up and vetoes anything fighting the bigger picture. Set it to Auto and forget it.
- A complete trade plan on the chart. Entry, Stop, Target and R:R are printed as price levels, not vague zones.
- Automatic position sizing. Enter your risk percentage once. The dashboard shows the lot size for the current setup, recalculated from your live account balance and the broker's contract specification.
- Truly non-repainting. Signals are evaluated on closed bars only, using swing points whose confirmation window is fully closed. An arrow that printed yesterday is still there today. So is the higher-timeframe filter — it reads the last closed higher-timeframe bar, so history is honest.
- Four trading styles in one click. Scalping, Intraday, Swing, Position. Each preset retunes the swing size, the ATR period and the trend multiplier together, so you never have to balance three numbers by hand.
- A dashboard that fits any chart. Dark and light themes, auto-detected from your chart background, and four corner positions.
- Alerts that actually tell you something. Popup, sound and mobile push carry the symbol, the direction, the entry, the stop, the target and the R:R.
- Works everywhere. Every symbol, every timeframe — Forex, metals, indices, crypto, stocks. No external files, no DLLs, no dependencies on other indicators.
- Built for automation. Eight documented buffers let your own Expert Advisor read the trend, the setup state and the zone boundaries through iCustom .
Inputs — professional and minimal
Eleven settings run the whole indicator. Everything else is optional.
| Input | What it does |
|---|---|
| Trading style | Scalping / Intraday / Swing / Position. Retunes the engine as a set. |
| Higher-timeframe filter | Auto (one step up), Off, or a fixed timeframe. |
| Entry zone | Golden 50–61.8, Deep 61.8–79.0 (the OTE sweet spot), or Wide 38.2–61.8. |
| Take-profit target | Prior swing (100%), or the 127.2% / 161.8% extension. |
| Stop buffer (x ATR) | How far beyond the swing the stop sits. |
| Risk per trade (%) | Drives the lot-size calculator. |
| Colour theme | Auto, Dark or Light. |
| Dashboard position | Any of the four corners. |
| Show dashboard / trend line / past signals | Three independent switches. |
| Alert mode | Off, entry signals only, or entries plus trend changes. |
| Fine-tune (optional) | Swing size, ATR period, ATR multiplier — leave at 0 for auto. |
How to trade it
- Attach the indicator and pick your trading style.
- Wait for the shaded zone to appear. The dashboard tells you the direction, the entry, the stop, the target, the R:R and the lot size.
- When the arrow prints and the dashboard reads PRICE IN ZONE — ARMED, take the trade with the levels shown.
- If the trend or the higher timeframe disagrees, no zone is drawn at all and the dashboard reads filtered — counter-trend. That is the indicator doing its job. An empty chart is an answer.
Recommended starting settings
| Chart | Style | Higher-timeframe filter | Zone | Target |
|---|---|---|---|---|
| M5 – M15 | Scalping | Auto | Golden | 127.2% |
| M15 – H1 | Intraday | Auto | Golden | 127.2% |
| H1 – H4 | Swing | Auto | Deep | 161.8% |
| H4 – D1 | Position | Auto | Deep | 161.8% |
For EA developers
iCustom buffer map:
| # | Buffer | Meaning |
|---|---|---|
| 0 | Trend Up | Trend line value while bullish, EMPTY_VALUE otherwise |
| 1 | Trend Down | Trend line value while bearish, EMPTY_VALUE otherwise |
| 2 | Buy | Arrow price on a buy signal bar, EMPTY_VALUE otherwise |
| 3 | Sell | Arrow price on a sell signal bar, EMPTY_VALUE otherwise |
| 4 | Trend direction | +1 bullish, -1 bearish |
| 5 | Setup state | +1 buy setup live, -1 sell setup live, 0 none or filtered |
| 6 | Zone upper | Upper boundary of the active entry zone, 0 when there is none |
| 7 | Zone lower | Lower boundary of the active entry zone, 0 when there is none |
Read buffer 2 or 3 at shift 1 for a confirmed, closed-bar signal.
Buffer 5 obeys the strict trend rule, so it is never +1 while buffer 4 is -1 . A counter-trend leg reads as 0 — your EA does not need to re-check the trend itself.
Honest notes
- The indicator marks setups; it does not place trades and does not predict the future. Test it on your broker's data and on demo before risking real money.
- Signals confirm on bar close. A swing point is confirmed once the bars on both sides of it have closed, which is what makes the history you see on the chart real.
- Past performance does not guarantee future results.