AQUA ind
- Indicators
- Version: 1.0
- Activations: 5

AQUA — analytical indicator that shows the statistics of price behaviour after three-candle patterns across six timeframes.
Purpose
AQUA studies how often short candle configurations repeat and shows how similar situations statistically ended in the past. Its job is to give the trader an objective statistical picture of how the instrument reacts to a particular three-candle figure; the trading decision stays with the user.
On every new candle the indicator encodes the last three closed candles into one of 48 patterns in parallel across six timeframes, scans up to several thousand historical bars on each scale, finds all identical configurations, computes the distribution of their outcomes, evaluates statistical significance and redraws the visualisation. The same work by hand — scrolling the history, marking similar figures, counting the shares of outcomes and judging their significance on every timeframe — would take hours and would be prone to counting errors. AQUA does it in a fraction of a second and repeats it on every candle.
The current pattern is outlined on the chart, and the historical matches are framed throughout the history. This lets the trader jump to any match and examine the context in which it appeared.
Method
A pattern is built from two independent traits. The first is the direction of the three candles, which gives eight combinations. The second is the order of their high-low ranges, which gives six more. Together that makes 48 patterns, and each carries its own name, so a configuration can be called by a word instead of being described.
For every historical match the outcome of the next candle is recorded. The distribution of up and down outcomes is computed on that sample. The significance of the edge is measured by a z-score — the normal approximation of the binomial test against the null hypothesis of an equally likely outcome.
Correction for multiple comparisons
The indicator shows six timeframes at once and recomputes them on every bar. The more rows in front of you, the more often a striking coincidence appears among them: with the usual thresholds at least one row out of six would light up on almost every bar simply because of how the scale is built.
That is why the significance thresholds in AQUA are raised with the Bonferroni correction and refer to the whole table, not to a single row. The practical consequence is worth knowing in advance: most of the time the indicator will report random spread. That is not idleness, it is the correct answer. The same result under loose thresholds would look like a stream of findings that are not there.
Match selection
Besides matching the shape, two additional filters are available.
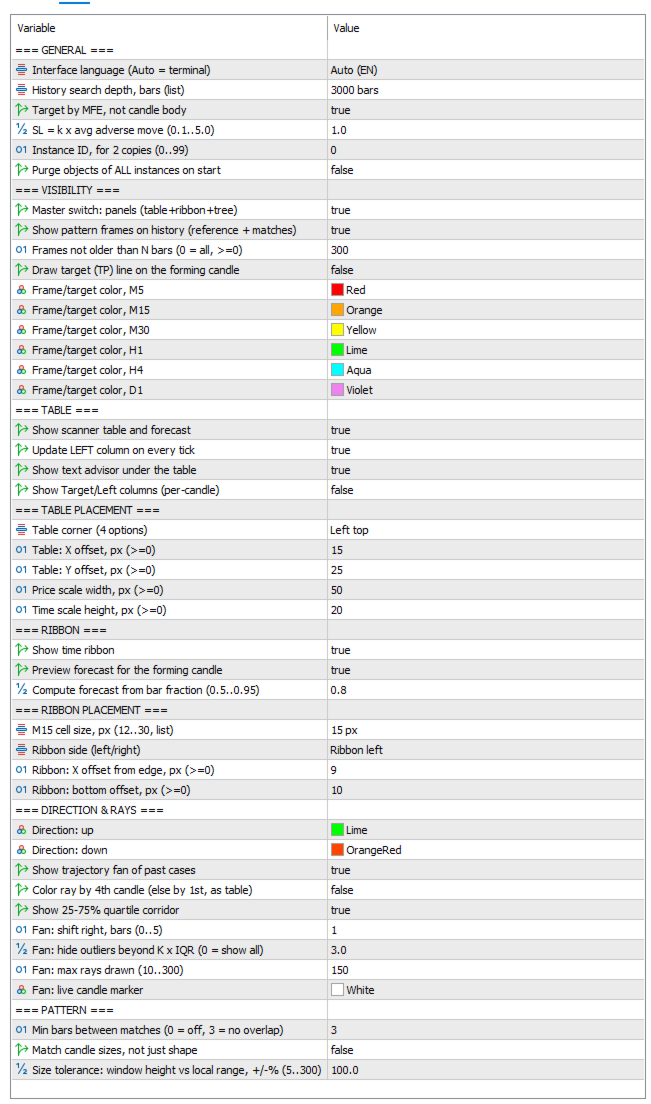
The minimum gap excludes overlapping windows: neighbouring matches share two candles out of three, their outcomes are related, and without this filter the sample looks larger than it is.
The scale filter keeps only cases comparable in size to the current one. The measure is normalised by the average range of the previous hundred bars, so it depends neither on the price level nor on the volatility regime — the comparison stays valid even on an instrument that doubled over the period. The filter is off by default and is meant for robustness testing: switching it on shows whether the observed edge survives on a homogeneous subsample.
The interpretation table
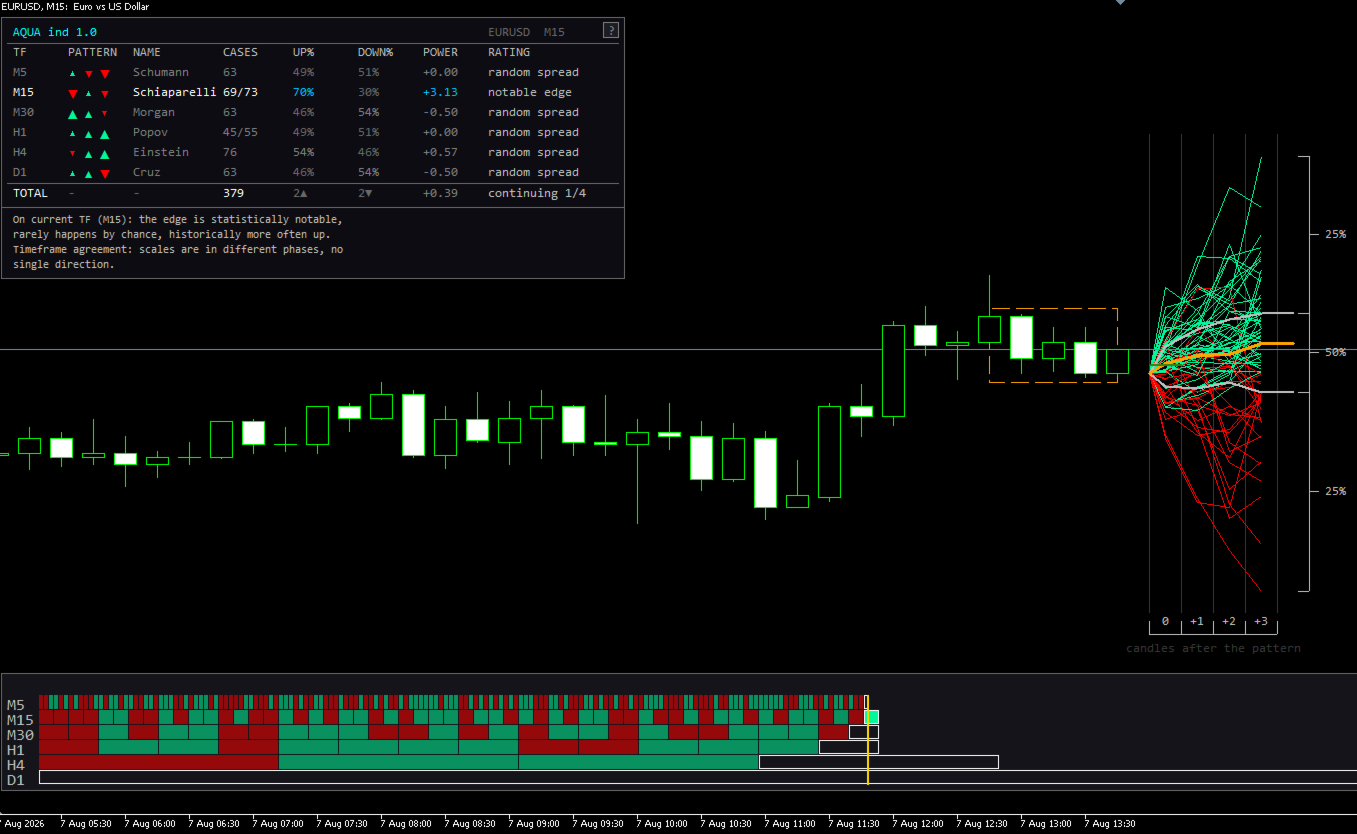
The main block is a table where each row is one timeframe. The pattern is drawn as three triangles: the direction of each candle is given by shape and colour, the range by the size of the mark, so the configuration reads at a glance. Next to it stand the pattern name, the number of matches found, the shares of up and down outcomes, the z-score of the edge and a plain-word rating. If the filters cut a noticeable part of the matches, a second figure appears in the column — how many were found by shape — so the cost of selection stays visible.
The summary row combines the data across timeframes. The text block below the table explains the situation in words and accompanies timeframe agreement with the probability of a random coincidence: a four-to-two lean happens by itself in almost seven cases out of ten, and that is stated openly.
The trajectory fan
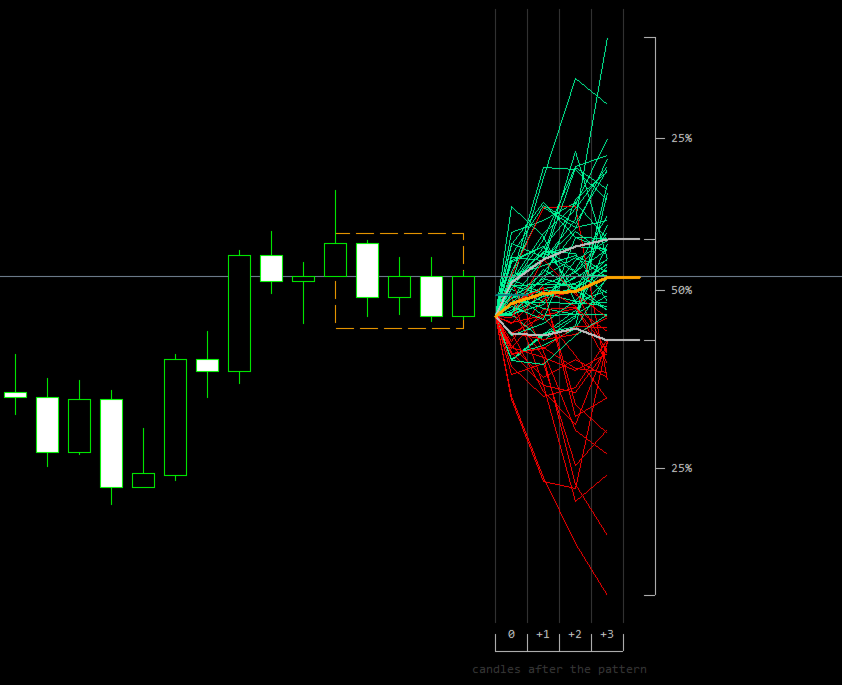
A separate visual block shows how price behaved after every identical pattern in the past. Each historical case is drawn as its own ray four candles ahead, so you see not an averaged expectation but the whole set of outcomes with their spread.
A median and a corridor holding half of the cases are drawn over the bundle, with the shares labelled explicitly. A grid divides the fan by candles, so it is clear at which step the move happened. A mark on the current candle shows where it stands relative to the historical distribution; that reading appears closer to the bar close, when the comparison becomes fair.
The time ribbon and the forward estimate
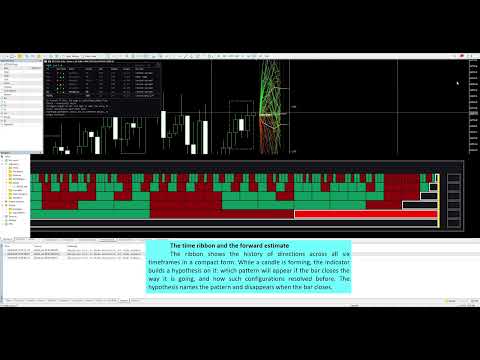
The ribbon shows the history of directions across all six timeframes in a compact form. While a candle is forming, the indicator builds a hypothesis on it: which pattern will appear if the bar closes the way it is going, and how such configurations resolved before. The hypothesis names the pattern and disappears when the bar closes.
Notes on use
The indicator runs on any instrument available in the terminal. The only requirement is enough quote history on the timeframes used. While the history is loading, the indicator states plainly which timeframes are affected and shows neither statistics nor an estimate for them.
Additional
Eleven interface languages are supported with automatic detection of the terminal language. Block placement, direction colours, history depth and the match selection parameters are configurable. A built-in multi-page help explains how to read the table, the fan and the ribbon directly on the chart.
Important
AQUA provides statistics of past market behaviour and is not a guarantee of future results. The indicator gives no trading signals and does not claim that the edge it finds covers trading costs. It is intended solely as analytical support for the user's own decisions.