LIME ind
- Indicators
- Version: 1.4
- Updated: 7 August 2026
- Activations: 5

LIME is an analytical indicator that presents reliable statistics of price behavior during the formation of price cycles across six timeframes.
Purpose
Lime studies the repeatability of candle series (single-direction cycles) and shows how similar situations historically resolved. Its task is to give the trader an objective statistical picture of how an instrument reacted to cycles of different lengths, while the trading decision remains with the user.
On every new candle, the indicator simultaneously identifies the current series across six timeframes, scans up to several thousand historical bars on each scale, finds all analogous cycles, computes the distribution of their outcomes, evaluates statistical significance, and rebuilds the visualization. The same work done by hand — scrolling through history, marking similar series, counting outcome shares, and assessing their significance on each timeframe — would take hours of painstaking effort and be prone to counting errors. Lime performs it in a fraction of a second and repeats it on every candle.
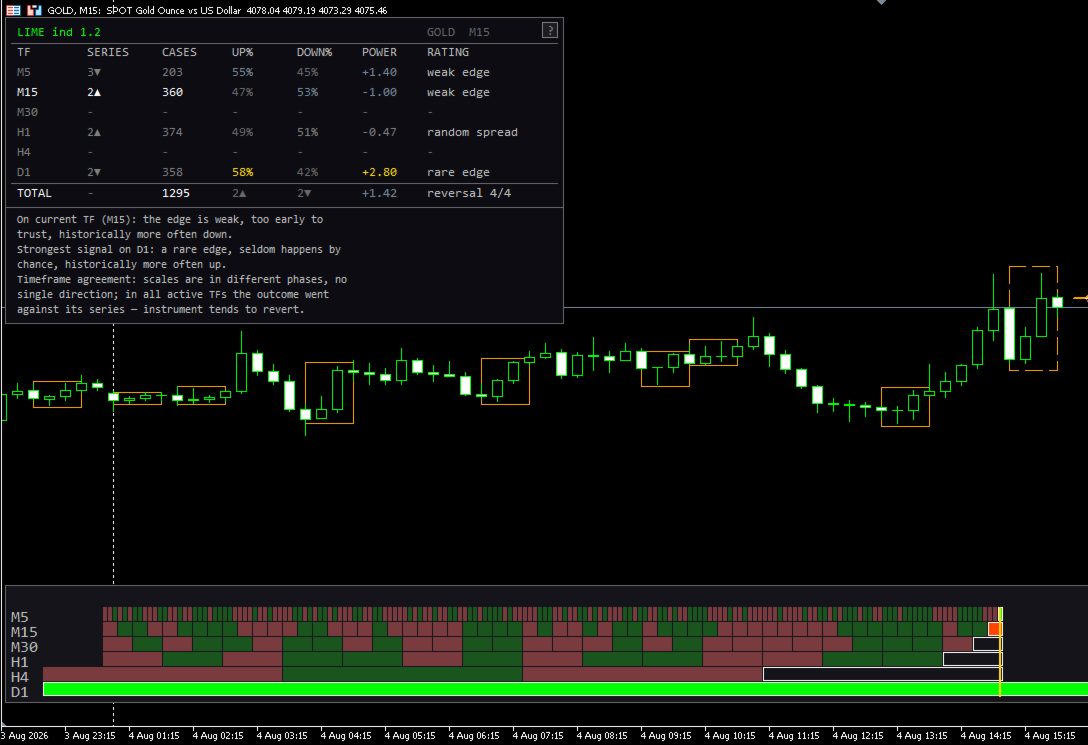
The current cycle is highlighted on the chart with a prominent frame, while every historical analogue found is outlined with separate frames throughout history. This lets the trader quickly jump to any match during analysis and examine the context in which it occurred.
Method
The indicator identifies the current series of same-direction candles and finds all series of the same length in history. For each match, the outcome of the next candle is recorded. From this sample, the distribution of up and down outcomes is calculated.
The statistical significance of the bias is assessed by a z-score — the normal approximation of the binomial test against the null hypothesis of an equally likely outcome (50/50). In essence this is a standard statistical test: the z value shows how many standard deviations the observed distribution departs from random. The five significance grades are tied to conventional thresholds of the normal distribution (confidence levels of about 90, 95, and 99 percent), so a rating of confident bias denotes a deviation that would occur only rarely by chance. The larger the sample and the stronger the deviation from 50/50, the more weight the conclusion carries.
The analysis runs in parallel on six timeframes: M5, M15, M30, H1, H4, D1 — which reveals whether cycle behavior agrees across scales or diverges.
Interpretation table
The main block is a table where each row corresponds to a timeframe. It shows the current series and its direction, the number of historical analogues found, the shares of up and down outcomes in percent, the z-score of the bias strength, and a plain-language rating of the situation. The summary row consolidates data across all timeframes and shows the agreement of reversal outcomes between them.
This presentation turns statistics into a readable form: the user immediately sees how pronounced the pattern is on each scale and whether the scales agree with one another.
Preview forecast panel
A few minutes before the current candle closes, Lime computes a preliminary forecast for the forming candle, based on its current state and on historical statistics. This makes it possible to assess the likely character of the close before it happens, without waiting for the bar to finalize.
Price movement tree
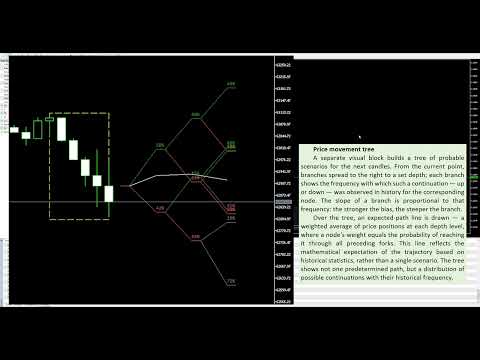
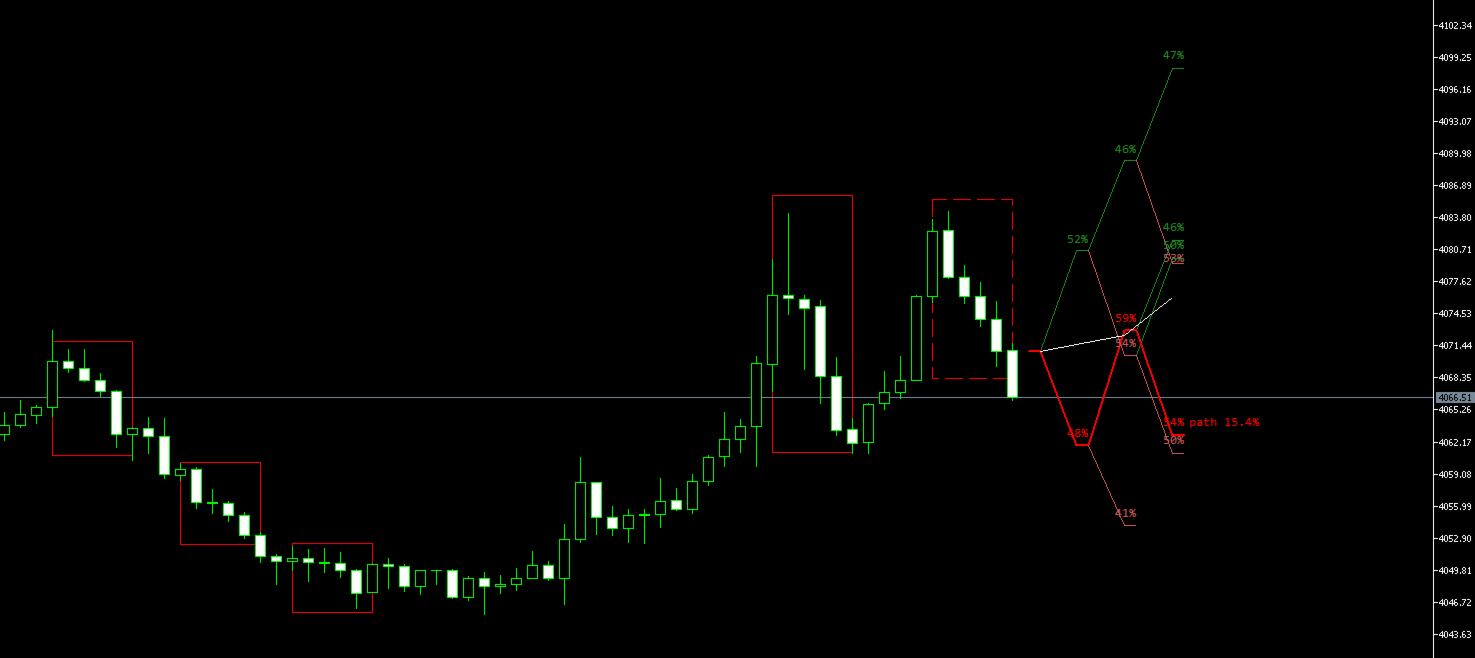
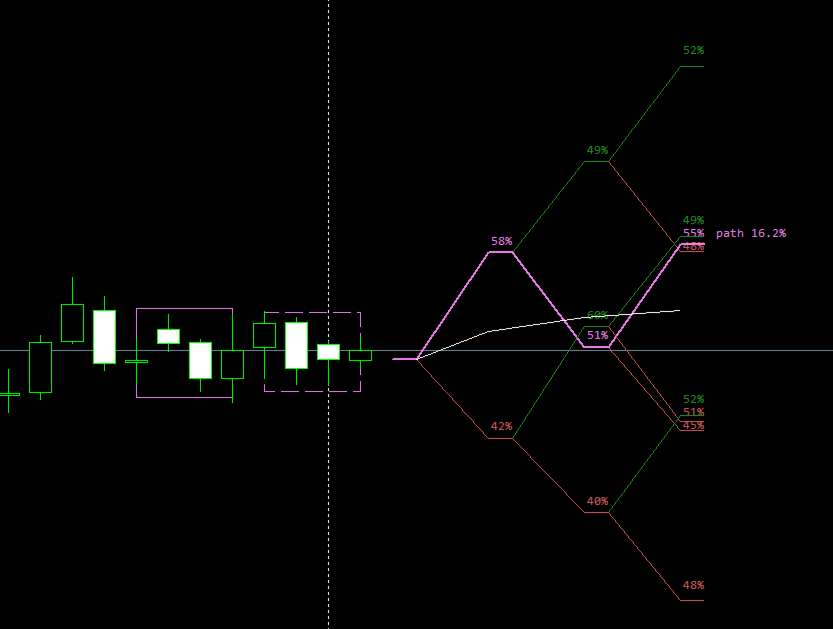
A separate visual block builds a tree of probable scenarios for the next candles. From the current point, branches spread to the right to a set depth; each branch shows the frequency with which such a continuation — up or down — was observed in history for the corresponding node. The slope of a branch is proportional to that frequency: the stronger the bias, the steeper the branch.
Over the tree, an expected-path line is drawn — a weighted average of price positions at each depth level, where a node's weight equals the probability of reaching it through all preceding forks. This line reflects the mathematical expectation of the trajectory based on historical statistics, rather than a single scenario. The tree shows not one predetermined path, but a distribution of possible continuations with their historical frequency.
Usage recommendations
The indicator can be run on any instrument available in the terminal. The only condition is sufficient quote history on the timeframes used: before the first launch it is advisable to scroll the chart into the past or wait for history to load, so that statistics are computed on a full sample.
Additional
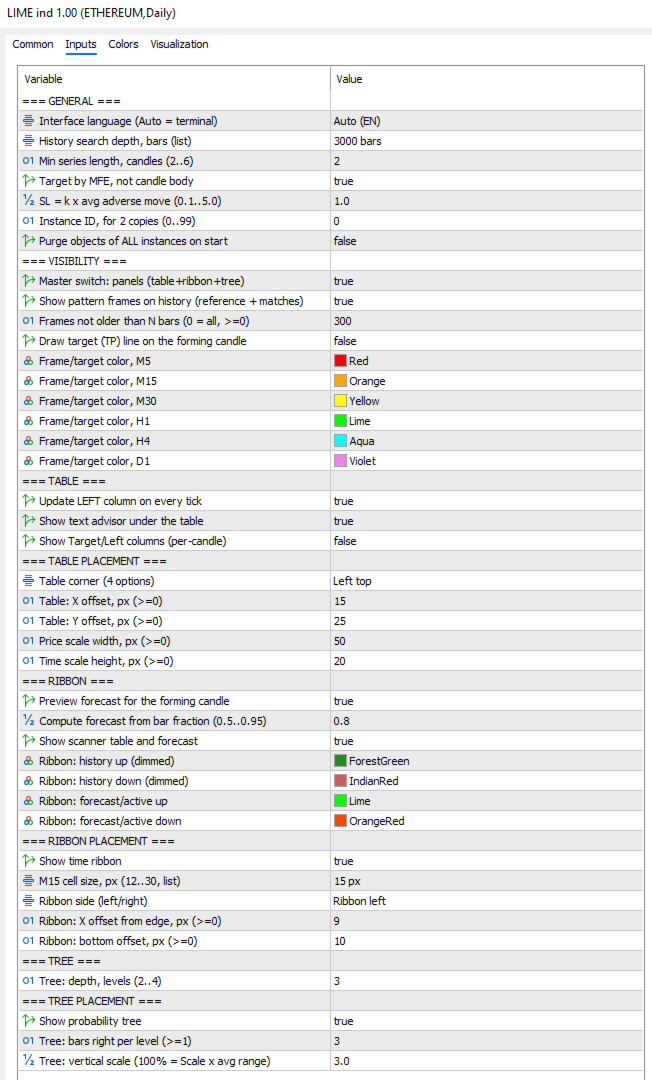
The indicator supports eleven interface languages with automatic detection of the terminal language. All visual elements are configurable: placement, colors, the history depth for analysis, and the minimum series length taken into account. A built-in multi-page help explains how to read the table and the purpose of the parameters directly on the chart.
Important
Lime provides statistics of past market behavior and is not a guarantee of future results. The indicator does not issue trading signals and is intended solely for analytical support of the user's own trading decisions.
Purpose
Lime studies the repeatability of candle series (single-direction cycles) and shows how similar situations historically resolved. Its task is to give the trader an objective statistical picture of how an instrument reacted to cycles of different lengths, while the trading decision remains with the user.
On every new candle, the indicator simultaneously identifies the current series across six timeframes, scans up to several thousand historical bars on each scale, finds all analogous cycles, computes the distribution of their outcomes, evaluates statistical significance, and rebuilds the visualization. The same work done by hand — scrolling through history, marking similar series, counting outcome shares, and assessing their significance on each timeframe — would take hours of painstaking effort and be prone to counting errors. Lime performs it in a fraction of a second and repeats it on every candle.
The current cycle is highlighted on the chart with a prominent frame, while every historical analogue found is outlined with separate frames throughout history. This lets the trader quickly jump to any match during analysis and examine the context in which it occurred.
Method
The indicator identifies the current series of same-direction candles and finds all series of the same length in history. For each match, the outcome of the next candle is recorded. From this sample, the distribution of up and down outcomes is calculated.
The statistical significance of the bias is assessed by a z-score — the normal approximation of the binomial test against the null hypothesis of an equally likely outcome (50/50). In essence this is a standard statistical test: the z value shows how many standard deviations the observed distribution departs from random. The five significance grades are tied to conventional thresholds of the normal distribution (confidence levels of about 90, 95, and 99 percent), so a rating of confident bias denotes a deviation that would occur only rarely by chance. The larger the sample and the stronger the deviation from 50/50, the more weight the conclusion carries.
The analysis runs in parallel on six timeframes: M5, M15, M30, H1, H4, D1 — which reveals whether cycle behavior agrees across scales or diverges.
Interpretation table
The main block is a table where each row corresponds to a timeframe. It shows the current series and its direction, the number of historical analogues found, the shares of up and down outcomes in percent, the z-score of the bias strength, and a plain-language rating of the situation. The summary row consolidates data across all timeframes and shows the agreement of reversal outcomes between them.
This presentation turns statistics into a readable form: the user immediately sees how pronounced the pattern is on each scale and whether the scales agree with one another.
Preview forecast panel
A few minutes before the current candle closes, Lime computes a preliminary forecast for the forming candle, based on its current state and on historical statistics. This makes it possible to assess the likely character of the close before it happens, without waiting for the bar to finalize.
Price movement tree
A separate visual block builds a tree of probable scenarios for the next candles. From the current point, branches spread to the right to a set depth; each branch shows the frequency with which such a continuation — up or down — was observed in history for the corresponding node. The slope of a branch is proportional to that frequency: the stronger the bias, the steeper the branch.
Over the tree, an expected-path line is drawn — a weighted average of price positions at each depth level, where a node's weight equals the probability of reaching it through all preceding forks. This line reflects the mathematical expectation of the trajectory based on historical statistics, rather than a single scenario. The tree shows not one predetermined path, but a distribution of possible continuations with their historical frequency.
Usage recommendations
The indicator can be run on any instrument available in the terminal. The only condition is sufficient quote history on the timeframes used: before the first launch it is advisable to scroll the chart into the past or wait for history to load, so that statistics are computed on a full sample.
Additional
The indicator supports eleven interface languages with automatic detection of the terminal language. All visual elements are configurable: placement, colors, the history depth for analysis, and the minimum series length taken into account. A built-in multi-page help explains how to read the table and the purpose of the parameters directly on the chart.
Important
Lime provides statistics of past market behavior and is not a guarantee of future results. The indicator does not issue trading signals and is intended solely for analytical support of the user's own trading decisions.