Faultline H4
- Experts
-
Tigran Papyan
 MQL5.community member since 2015. I build rule-based Expert Advisors with the strategy parameters compiled in, so the version you run is the version that was tested. Fixed stop and target set at entry and never moved, one position per chart, no martingale, no grid, no averaging, no recovery mode.
 - Version: 1.13
- Updated: 2 August 2026
- Activations: 10
WHAT IT DOES
Faultline H4 trades the break of a recent support or resistance level on 28 forex pairs from a single file. Each pair carries its own validated settings. Every trade is opened with a fixed stop loss and take profit that are never moved afterwards.
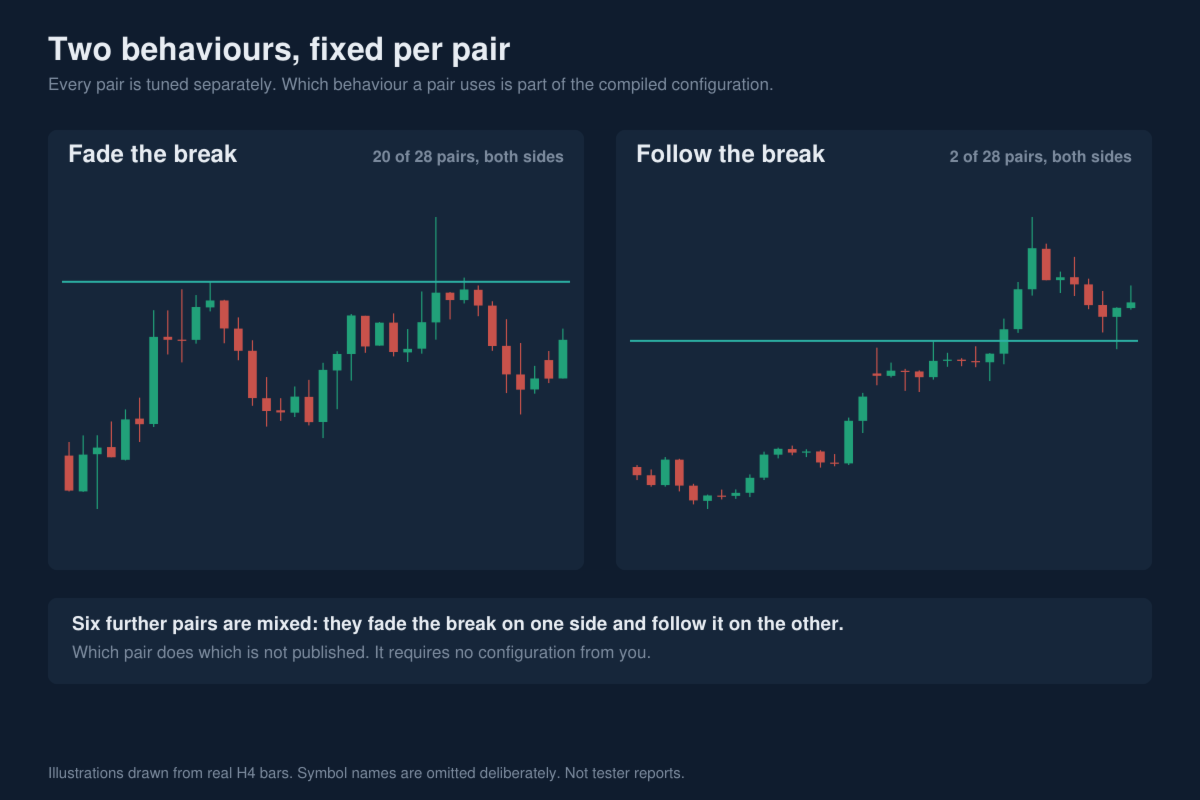
The Expert Advisor reads the chart symbol when it starts and loads that pair's own configuration: its own lookback for levels, its own stop multiple and target ratio, its own filters, its own trading hours and its own magic number. It is not one parameter set copied 28 times. Twenty of the 28 pairs fade the break, two follow it, and six fade it on one side and follow it on the other, because that is what each pair's own validation supported. Recommended timeframe is H4.
THE RISK PROFILE, STATED FIRST
This is a stop-loss-per-trade system with real equity swings. Across the 28 single-symbol tests described further down, maximum drawdown ranged from 9.1 percent to 35.1 percent, averaging 21.3 percent, and nine of the 28 pairs drew down more than 24 percent. Those tests used the shipped default of 3 percent risk per trade.
Nothing about this product is designed to produce a smooth equity curve, and no part of this page should be read as suggesting one. What it offers is mechanical discipline you can verify yourself, and breadth across 28 markets. If a drawdown of that size is not acceptable to you, either reduce the RiskPercent input or do not buy this product.
YOU CAN CHECK ALL OF THIS BEFORE YOU SPEND ANYTHING
The Free Demo button on this page costs nothing and does not need an account. It runs the same file in the MetaTrader 5 Strategy Tester, on your own broker's history, on any of the 28 pairs, over the same 2022 to 2026 window, at any risk setting, as many times as you want. It runs in the Strategy Tester only and does not trade a live or a demo account. The button opens your terminal.
The exact tester settings behind every row of the table further down are listed under HOW TO REPRODUCE THESE RESULTS, so you can run the same test and compare.
Three things the demo settles in a few minutes that no screenshot can prove. That the stop loss and take profit on every closed trade are the same values the trade opened with, because nothing is ever moved. That only one position is open per chart at a time. That there is no averaging, no second entry into a losing trade and no recovery sequence anywhere in the trade list.
HOW A TRADE IS OPENED
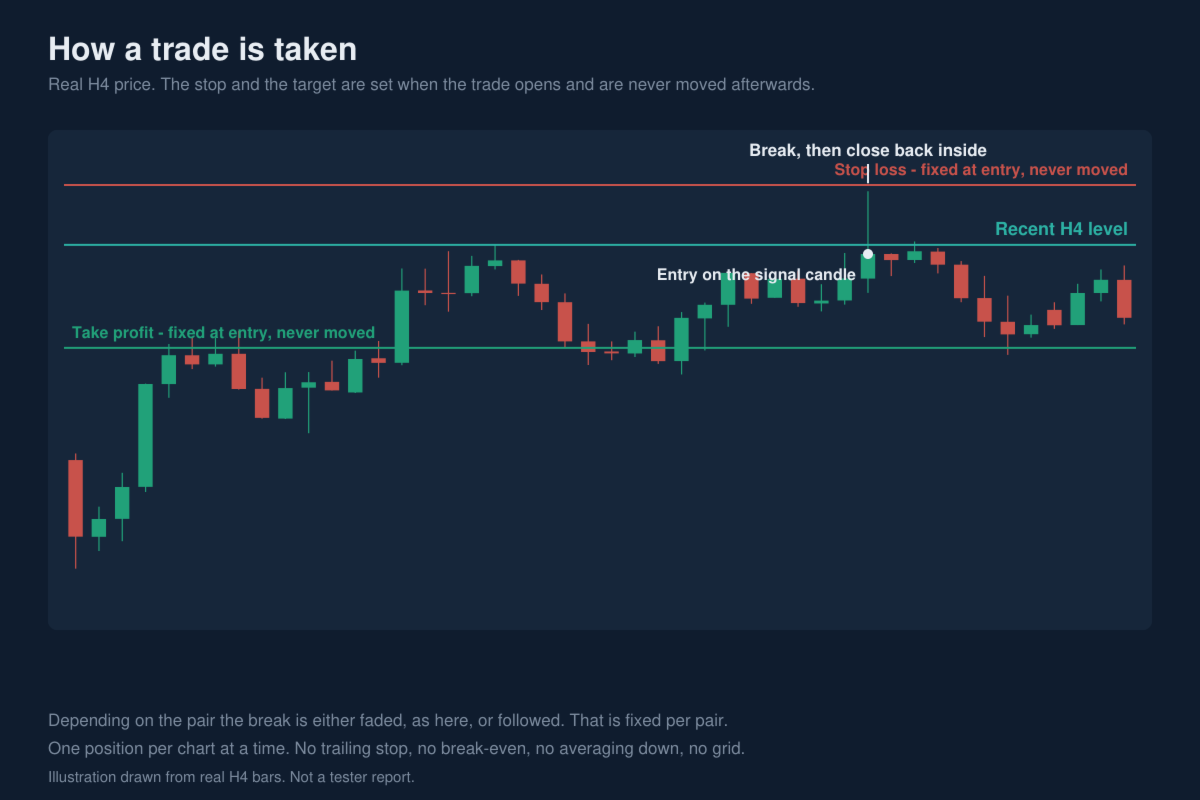
The Expert Advisor works on completed bars only. Once per new H4 bar it locates a recent swing high and swing low over that pair's own lookback period, and checks whether the previous bar broke one of those levels.
From there the pair's own configuration decides what happens. On a pair configured to fade the break, a bar that pierces the level and closes back inside it is a reversal signal, and the entry is against the break. On a pair configured to follow the break, a bar that closes beyond the level is a continuation signal, and the entry is with the break. Six pairs use one behaviour for long trades and the other for short trades.
Whichever applies, the candidate signal then has to pass that pair's own entry filters before an order is sent. The filters are selected and tuned per pair, compiled into the product, and not adjustable. Not every pair uses every filter.
Signals that occur on the 00:00 bar are held and entered one hour later, to step around the wider spreads that many brokers show at the daily rollover.
Only one position is held per chart at a time. While a position is open on that chart, no new signal on that chart is acted on.
HOW A TRADE IS CLOSED
A stop loss and a take profit are attached to the order when it is opened. The stop is placed at a multiple of Average True Range for that pair, and the target is placed at a fixed reward-to-risk ratio from the entry.
Neither is modified for the life of the trade. There is no trailing stop, no move to break even, no partial close, no averaging in, and no time-based exit. There is no position-modify call anywhere in the program, and this is easy to confirm yourself in the free Strategy Tester demo. A trade ends at its stop or at its target.
Position size is calculated from the account balance and the distance to that trade's stop, so the money risked is intended to be the same percentage on every trade regardless of pair or stop width.
WHAT THIS EXPERT ADVISOR DOES NOT DO
No martingale. A losing trade does not increase the size of the next one.
No grid, no basket, no averaging down, no recovery mode. There is a single order path in the code.
No trailing stop, no break even, no partial closes. The stop and the target set at entry are the stop and the target the trade ends on.
No hedging within a chart. One position per chart at a time, in one direction.
No DLL calls, no internet requests, no external licensing, no file writing. The only include is the standard MetaTrader trade library.
No arbitrage, no tick scalping, no dependence on unusually low latency. Entries are evaluated once per completed H4 bar.
THE 28 PAIRS
AUDCAD, AUDCHF, AUDJPY, AUDNZD, AUDUSD, CADCHF, CADJPY, CHFJPY, EURAUD, EURCAD, EURCHF, EURGBP, EURJPY, EURNZD, EURUSD, GBPAUD, GBPCAD, GBPCHF, GBPJPY, GBPNZD, GBPUSD, NZDCAD, NZDCHF, NZDJPY, NZDUSD, USDCAD, USDCHF, USDJPY.
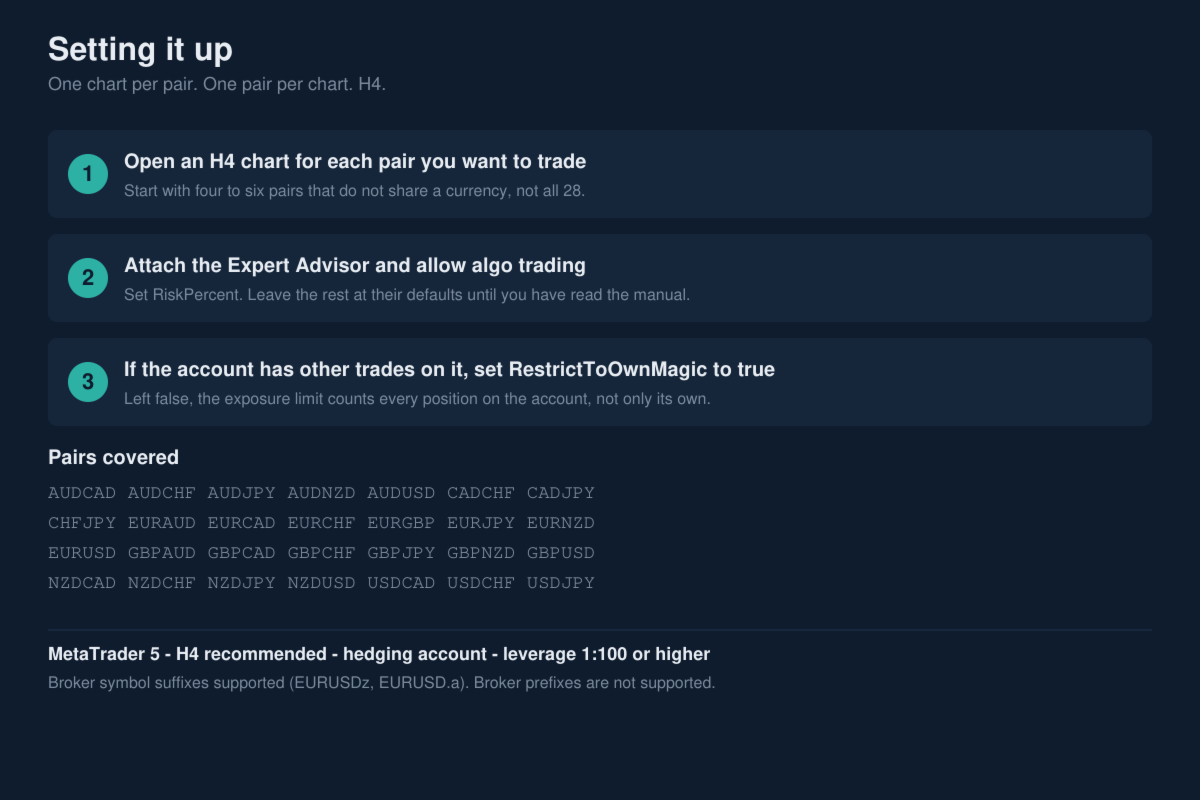
Attach the same file to an H4 chart of each pair you want to trade. You do not have to run all 28.
Twenty pairs fade the break on both sides. Two follow the break on both sides. Six are mixed, fading on one side and following on the other.
Which of the three applies to a given pair is part of the compiled configuration and is not published per pair.
If you attach the Expert Advisor to any other symbol it will still run, using a median parameter set built from the 28 tuned pairs with all optional filters switched off. It prints a notice in the journal when it does this. Those median settings have not been tested on any specific symbol and are not a recommendation to trade it.
ACCOUNT LEVEL EXPOSURE CONTROL
When several charts run this Expert Advisor at once, they coordinate through a shared gate. A new entry is refused if the account already holds MaxOpenPositions positions, default 8, or if the total risk on open positions would exceed MaxHeatPct of balance, default 21 percent. Risk is measured from each open position's actual stop distance, not from a nominal figure, so it stays correct if balance has changed since the position opened.
Two things about this gate must be said plainly.
First, with the shipped default of RestrictToOwnMagic set to false, the gate counts every position open on the account, including your own manual trades and positions opened by any other Expert Advisor you run. If you trade the account yourself as well, set RestrictToOwnMagic to true so that the gate only counts this Expert Advisor's own positions. This is explained again in the settings section.
Second, this gate is inactive in a single-symbol backtest. A single-symbol test never holds more than one position, so the position count and the heat limit can never be reached. The results below therefore do not reflect it in any way.
BACKTEST RESULTS
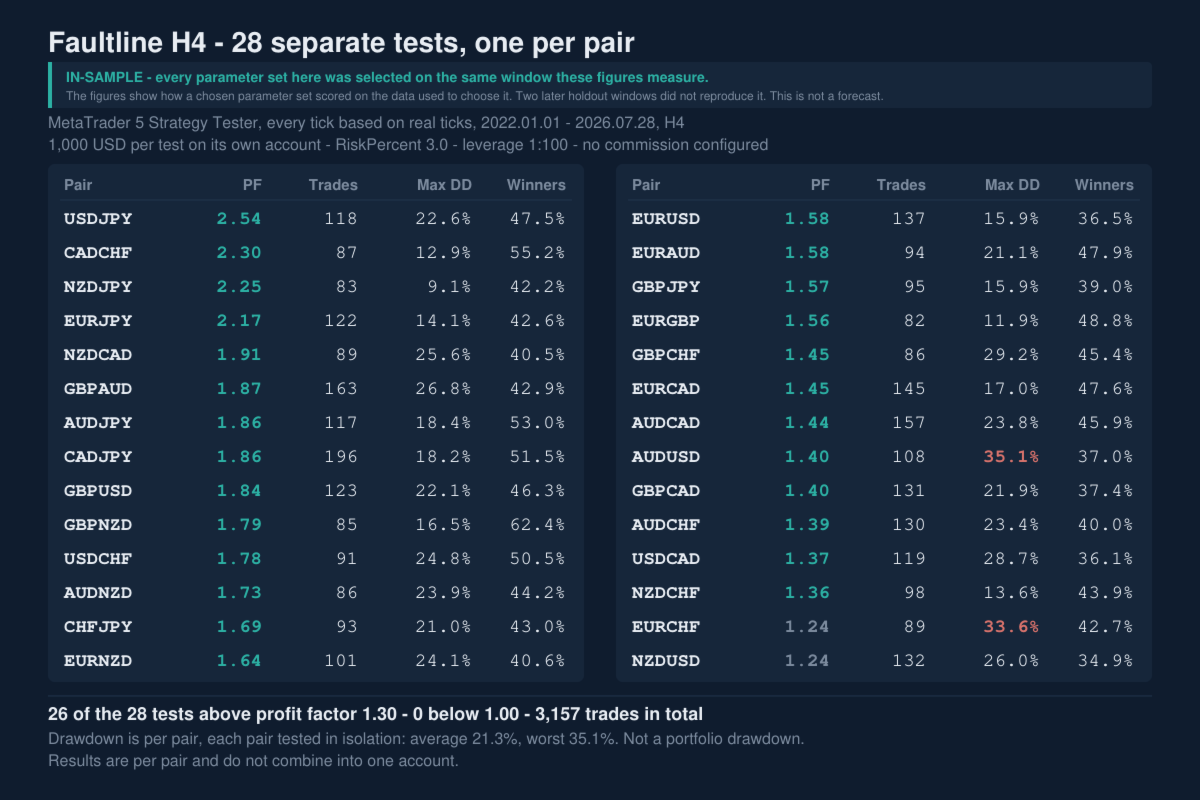
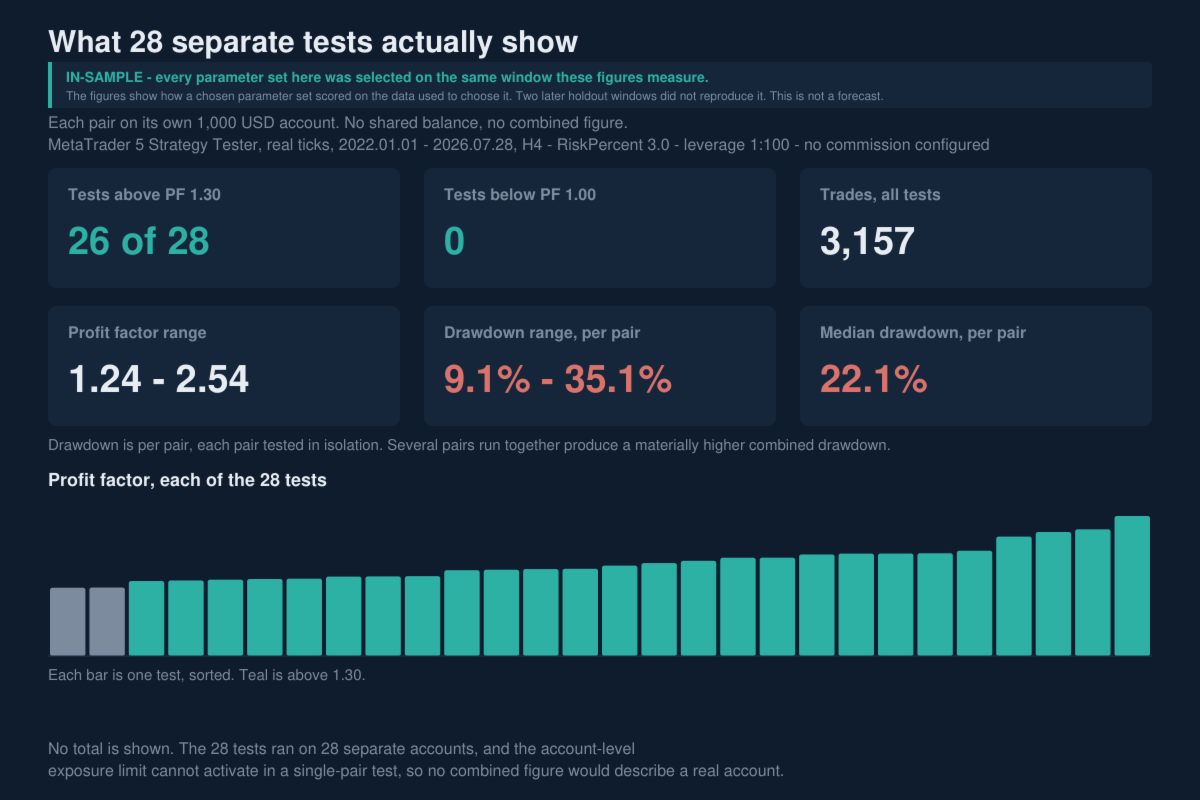
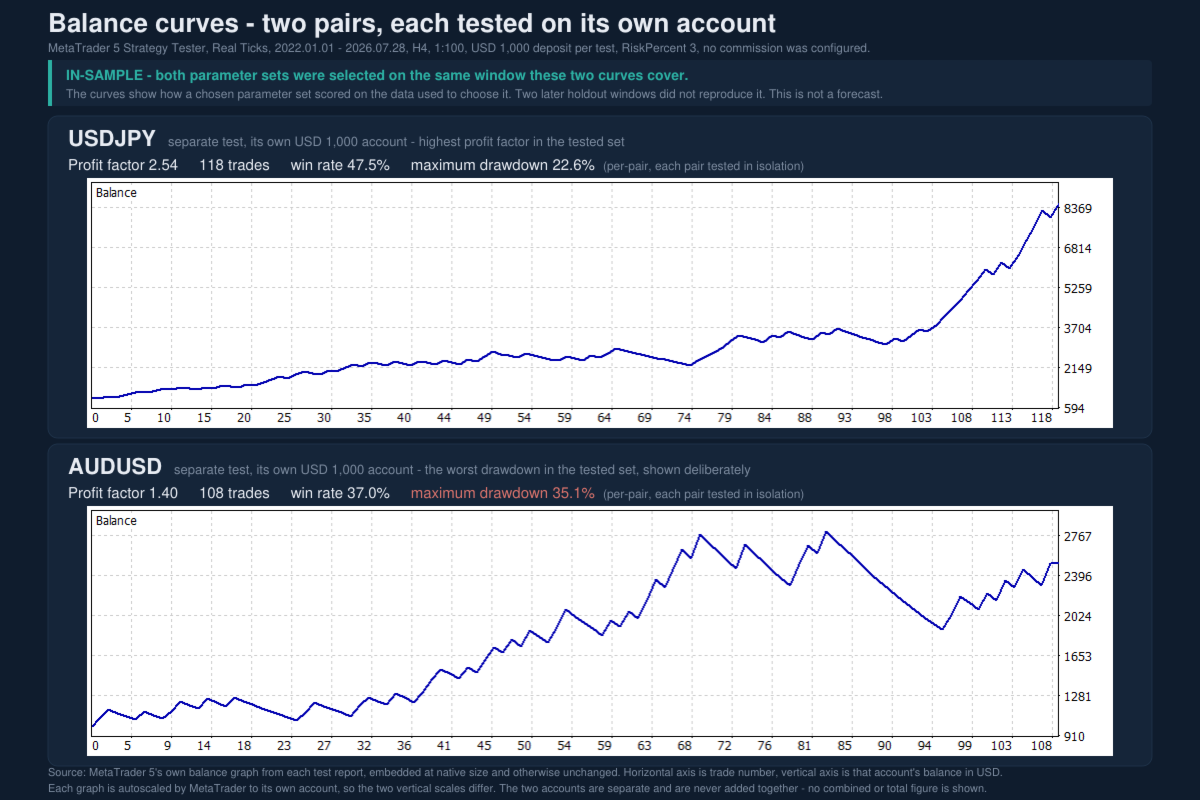
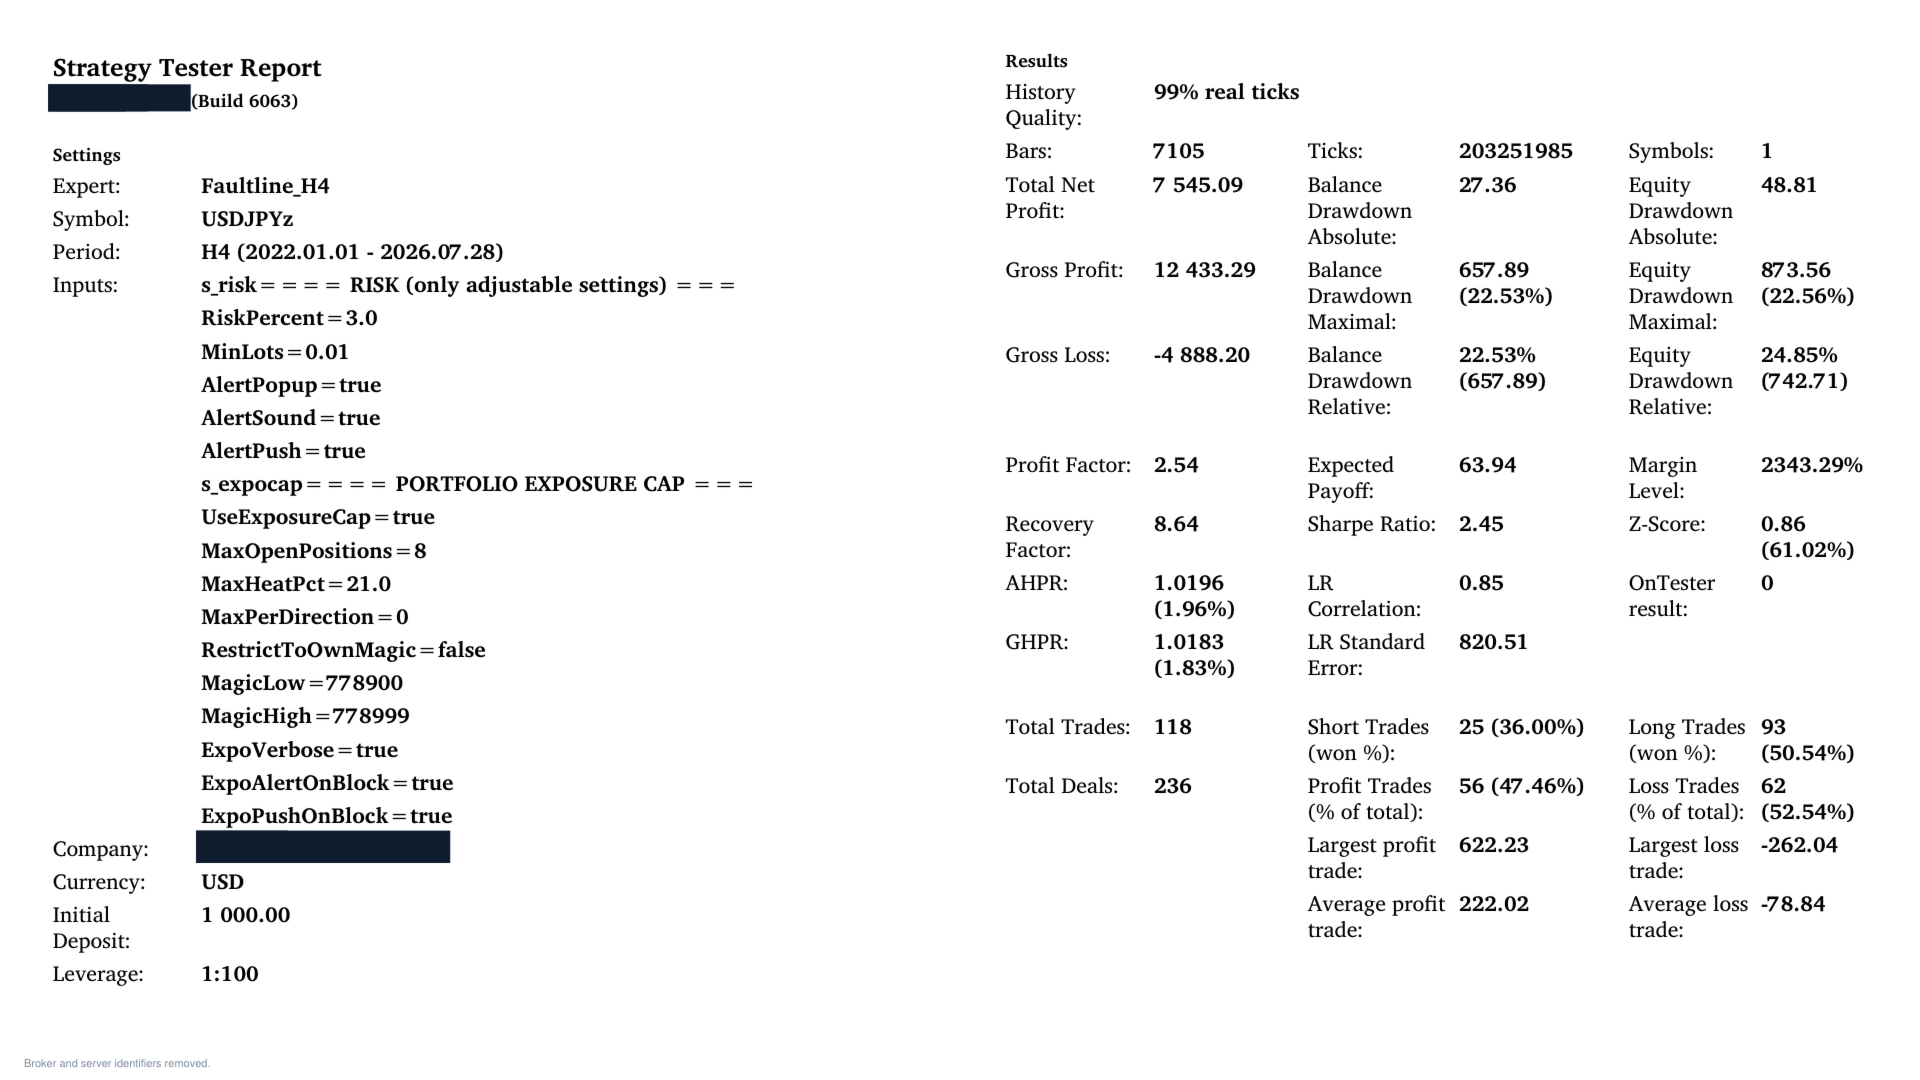
Conditions. MetaTrader 5 Strategy Tester, every tick based on real ticks, 2022-01-01 to 2026-07-28, which is 4.6 years. Each pair was tested separately on its own 1,000 USD account at 1:100 leverage, with RiskPercent at the shipped default of 3 percent and all other settings at their defaults. The history and the spreads are one broker's. No commission was configured in the tester, so these results reflect spread and swap only. On a commission-based account, subtract your own commission. Maximum drawdown is the equity drawdown reported by the tester.
These results are in-sample. The settings for each pair were chosen using this same 2022 to 2026 history, so the table below measures those settings on the data that was used to select them. Read it as a description of that period and not as evidence of future performance.
Across those 28 single-symbol tests, 26 of the 28 pairs finished with a profit factor above 1.30, and none finished below 1.00. Maximum drawdown ranged from 9.1 percent to 35.1 percent, averaging 21.3 percent. The average profit factor across the 28 tests was 1.69 and the total number of trades was 3,157, an average of 113 per pair over the 4.6 years. Average win rate was 44.5 percent. These are 28 separate tests and their results do not combine into a single account outcome.
Per pair, sorted by profit factor. PF is profit factor, DD is maximum equity drawdown.
USDJPY - PF 2.54 - 118 trades - max DD 22.6% - 47.5% winners
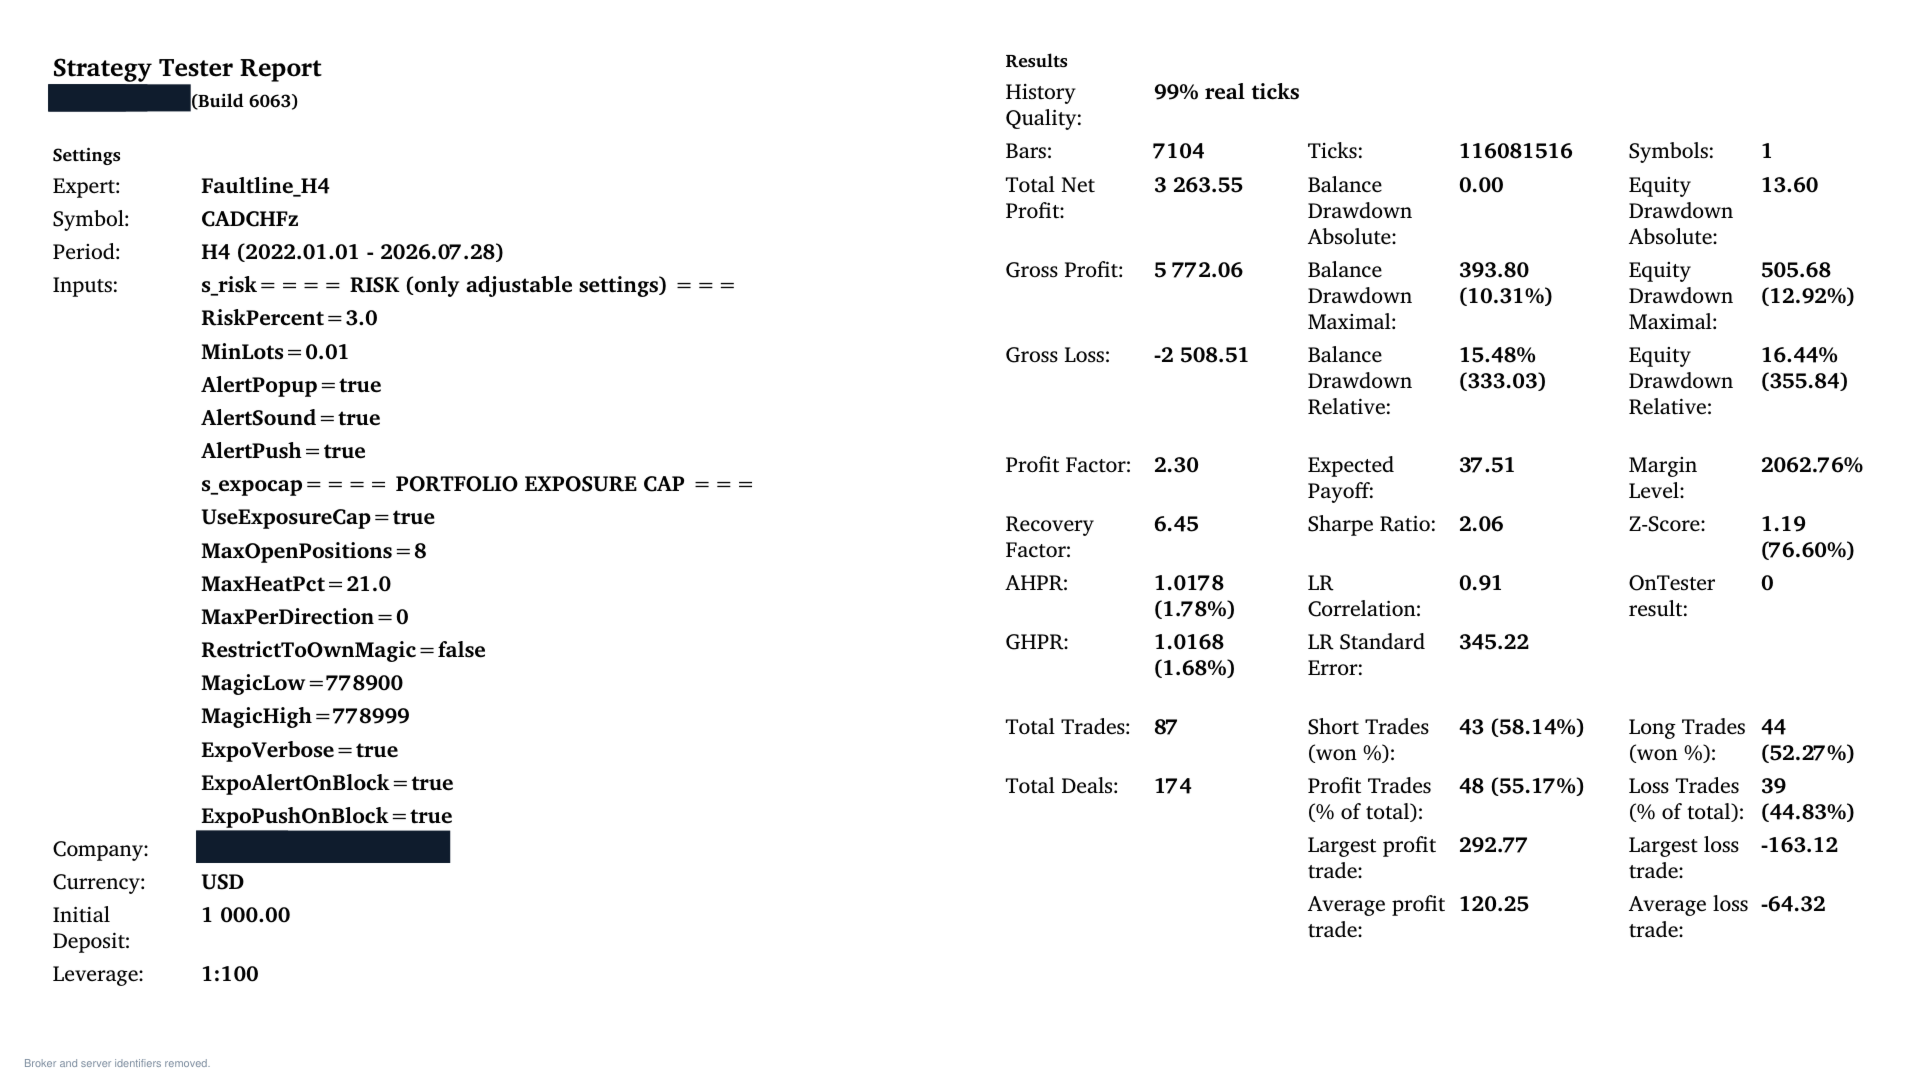
CADCHF - PF 2.30 - 87 trades - max DD 12.9% - 55.2% winners
NZDJPY - PF 2.25 - 83 trades - max DD 9.1% - 42.2% winners
EURJPY - PF 2.17 - 122 trades - max DD 14.1% - 42.6% winners
NZDCAD - PF 1.91 - 89 trades - max DD 25.6% - 40.5% winners
GBPAUD - PF 1.87 - 163 trades - max DD 26.8% - 42.9% winners
AUDJPY - PF 1.86 - 117 trades - max DD 18.4% - 53.0% winners
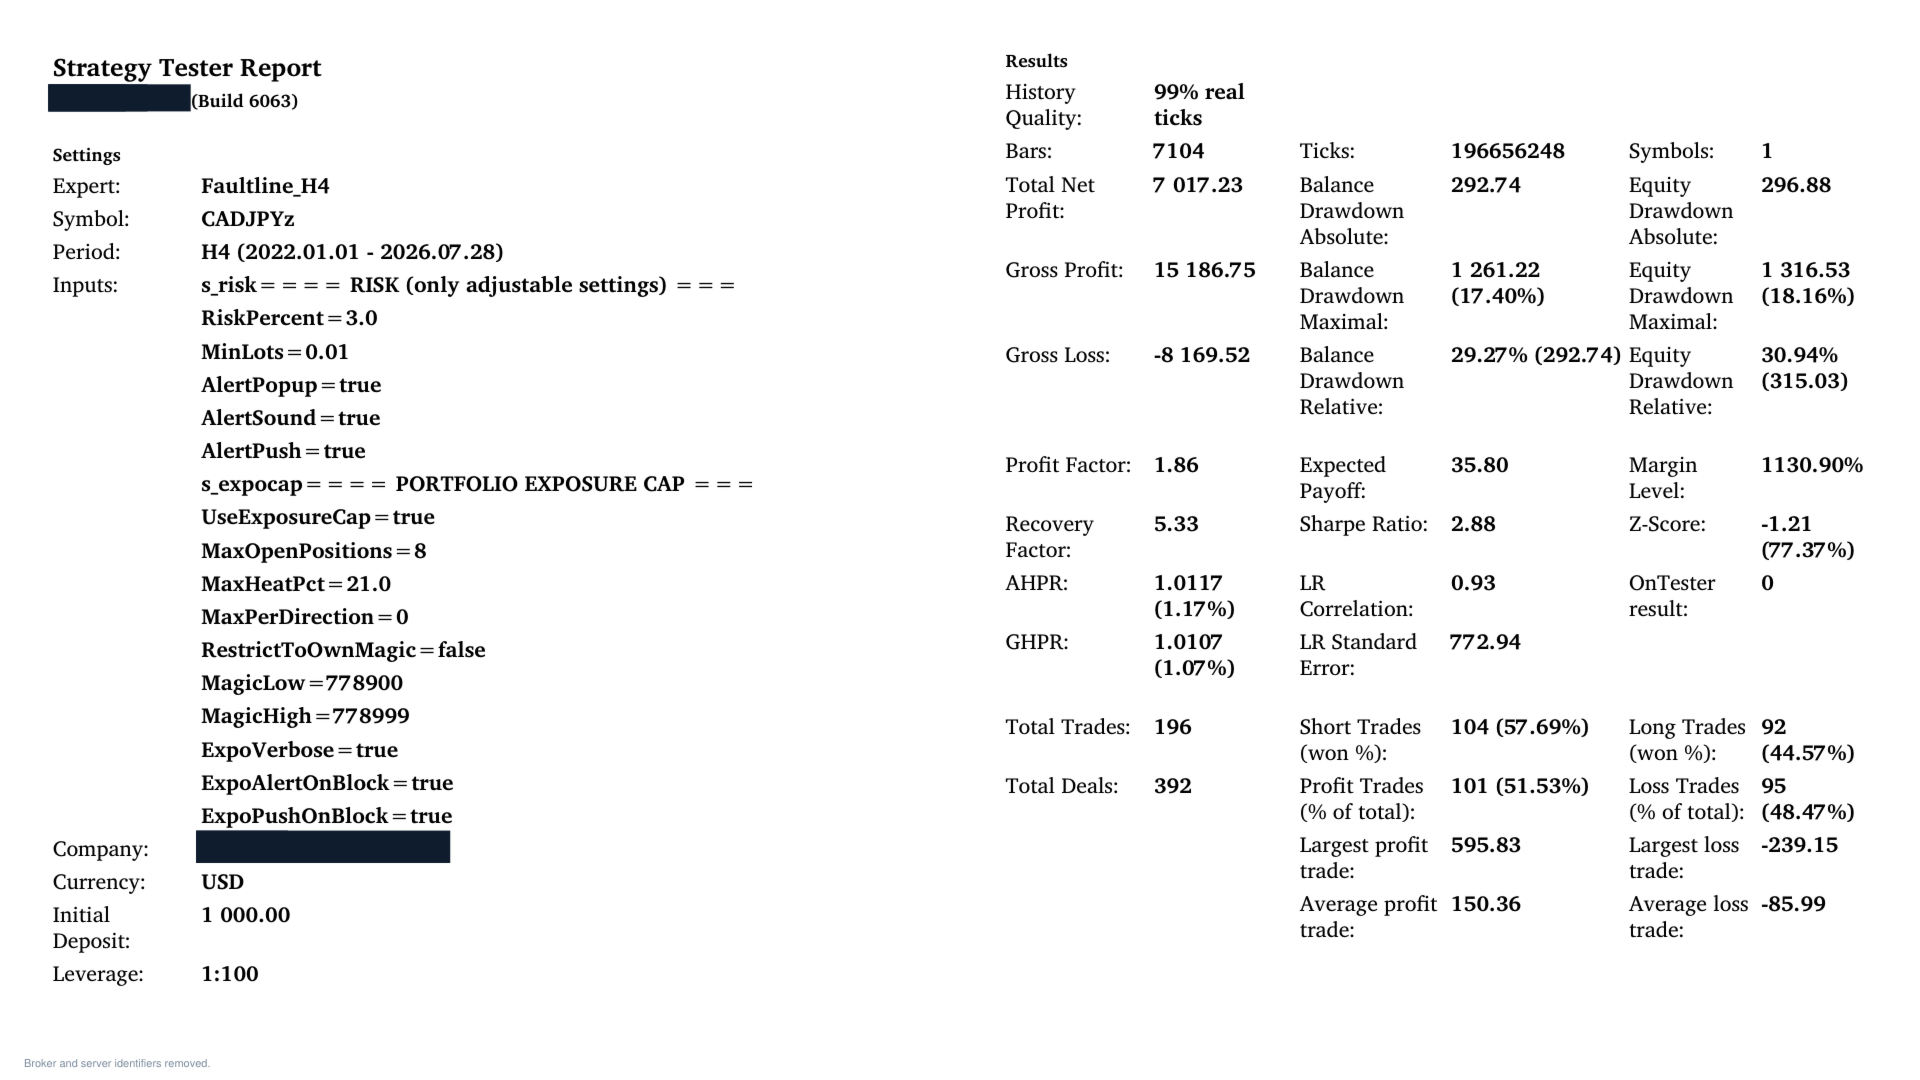
CADJPY - PF 1.86 - 196 trades - max DD 18.2% - 51.5% winners
GBPUSD - PF 1.84 - 123 trades - max DD 22.1% - 46.3% winners
GBPNZD - PF 1.79 - 85 trades - max DD 16.5% - 62.4% winners
USDCHF - PF 1.78 - 91 trades - max DD 24.8% - 50.5% winners
AUDNZD - PF 1.73 - 86 trades - max DD 23.9% - 44.2% winners
CHFJPY - PF 1.69 - 93 trades - max DD 21.0% - 43.0% winners
EURNZD - PF 1.64 - 101 trades - max DD 24.1% - 40.6% winners
EURAUD - PF 1.58 - 94 trades - max DD 21.1% - 47.9% winners
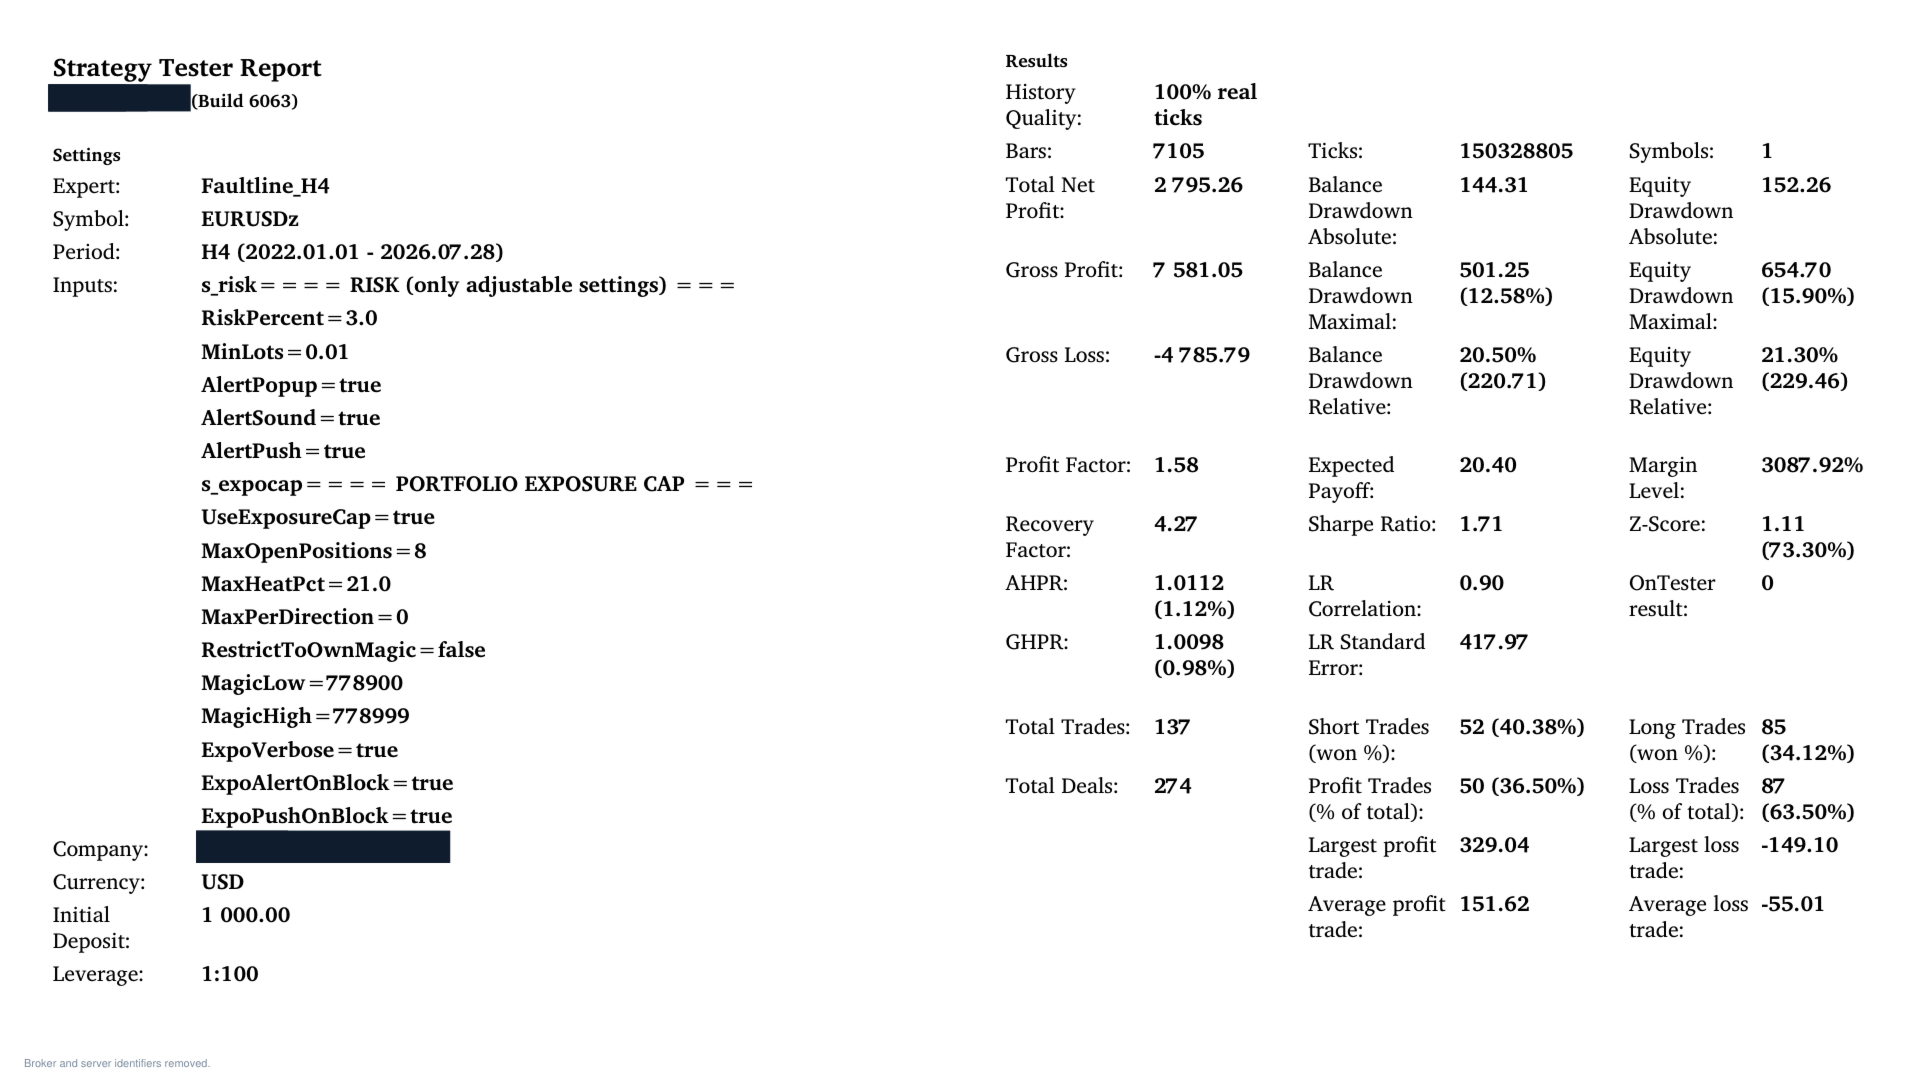
EURUSD - PF 1.58 - 137 trades - max DD 15.9% - 36.5% winners
GBPJPY - PF 1.57 - 95 trades - max DD 15.9% - 39.0% winners
EURGBP - PF 1.56 - 82 trades - max DD 11.9% - 48.8% winners
EURCAD - PF 1.45 - 145 trades - max DD 17.0% - 47.6% winners
GBPCHF - PF 1.45 - 86 trades - max DD 29.2% - 45.4% winners
AUDCAD - PF 1.44 - 157 trades - max DD 23.8% - 45.9% winners
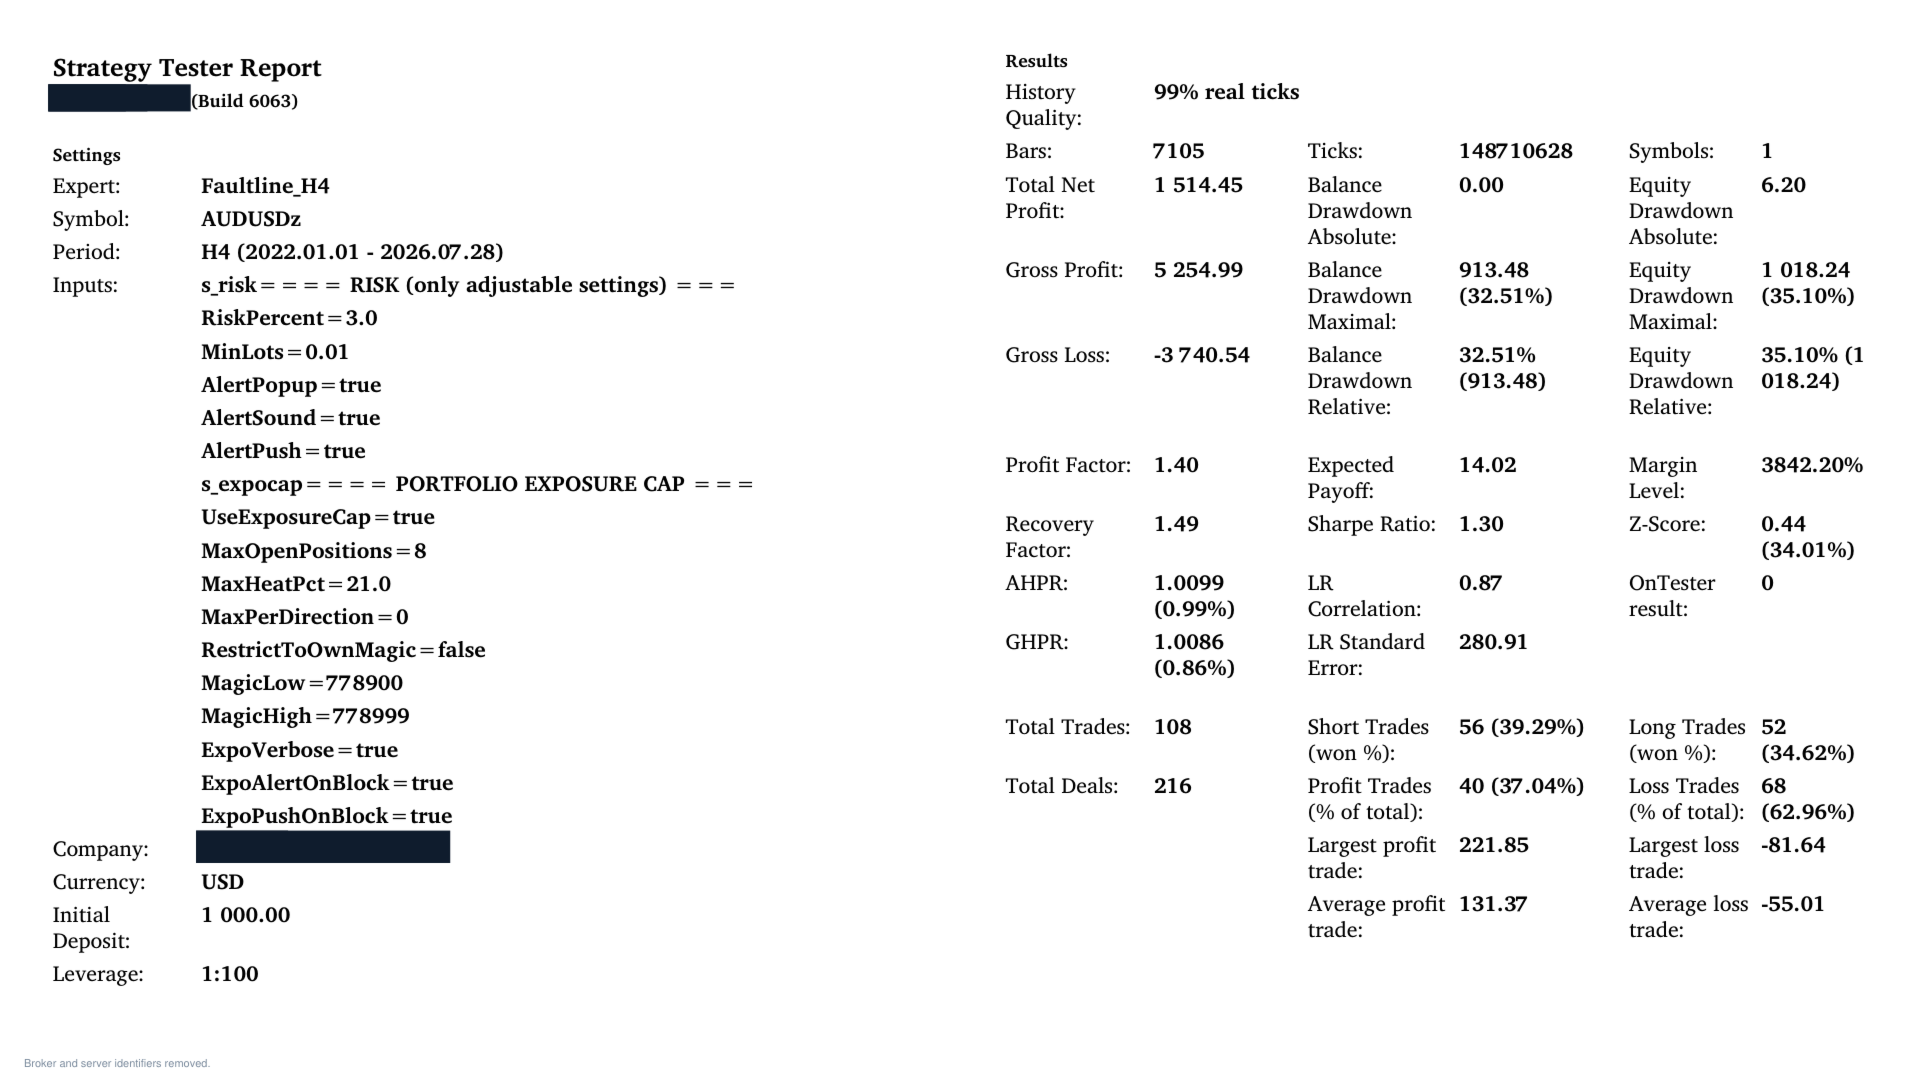
AUDUSD - PF 1.40 - 108 trades - max DD 35.1% - 37.0% winners
GBPCAD - PF 1.40 - 131 trades - max DD 21.9% - 37.4% winners
AUDCHF - PF 1.39 - 130 trades - max DD 23.4% - 40.0% winners
USDCAD - PF 1.37 - 119 trades - max DD 28.7% - 36.1% winners
NZDCHF - PF 1.36 - 98 trades - max DD 13.6% - 43.9% winners
EURCHF - PF 1.24 - 89 trades - max DD 33.6% - 42.7% winners
NZDUSD - PF 1.24 - 132 trades - max DD 26.0% - 34.9% winners
The two weakest pairs and the largest drawdown are in that list on purpose. AUDUSD produced the 35.1 percent drawdown. EURCHF and NZDUSD are the two pairs that did not clear 1.30.
HOW TO REPRODUCE THESE RESULTS
Every row in the table above came from these tester settings and no others. The Free Demo runs the same file, so you can repeat any row yourself at no cost.
Symbol: any of the 28 pairs listed above. Timeframe H4.
Date range: 2022.01.01 to 2026.07.28.
Modelling: Every tick based on real ticks.
Deposit: 1000 USD. Leverage: 1:100.
Inputs: every input left at its shipped default, with RiskPercent at 3.
Start with CADJPY. It is suggested because it produced the largest number of trades in the set, not because it produced the best result, and more trades is more to look at.
Your numbers will not match the table exactly, and that is expected rather than a fault. Your broker's tick history, spreads and swap rates are not the ones these tests used, no commission was configured in these tests, and the account level exposure limit described above cannot activate in a single-symbol test. A difference in profit factor or in drawdown is normal. A large difference in the trade count is worth raising in the comments, because that usually means the symbol or the date range is not the same one.
WHAT THE BACKTEST DOES NOT SHOW
This section exists because these limits are real and you would find them yourself.
The 28 tests do not share a balance. Each ran on its own 1,000 USD account. Adding their results together would describe 28 accounts, not one, so no combined figure is published anywhere on this page. A combined figure produced from tests run this way would not describe any real account.
The account level exposure gate never activates in these tests. A single-symbol test holds at most one position, so the 8-position and 21 percent heat limits can never bind. Running many charts at once will refuse some entries that these tests took, and results will differ for that reason alone.
The 28 equity curves are correlated. Several of these pairs share a currency and tend to move together, so simultaneous drawdowns across charts can be deeper than any single pair's figure suggests.
The results come from one broker's tick history and one spread environment. Your broker's spreads, commission, swap rates, execution and symbol availability will differ, and this strategy holds positions for days, so swap is a material cost on some pairs.
No commission was configured in these tests. If you trade a commission-based account, subtract it.
4.6 years is not a full market cycle. It contains particular regimes and does not contain others.
The parameters for each pair were selected using this same historical period, so every figure on this page is in-sample. When the same method was fitted on an earlier window and then measured on a period it had never seen, it did not show a profit. Treat the table as a description of the fitting window, not as an edge that is known to continue.
Past results, whether historical or simulated, do not indicate future results. A backtest is not a forward result, and nothing on this page should be read as a forecast, a projection or a promise of any outcome.
SETTINGS
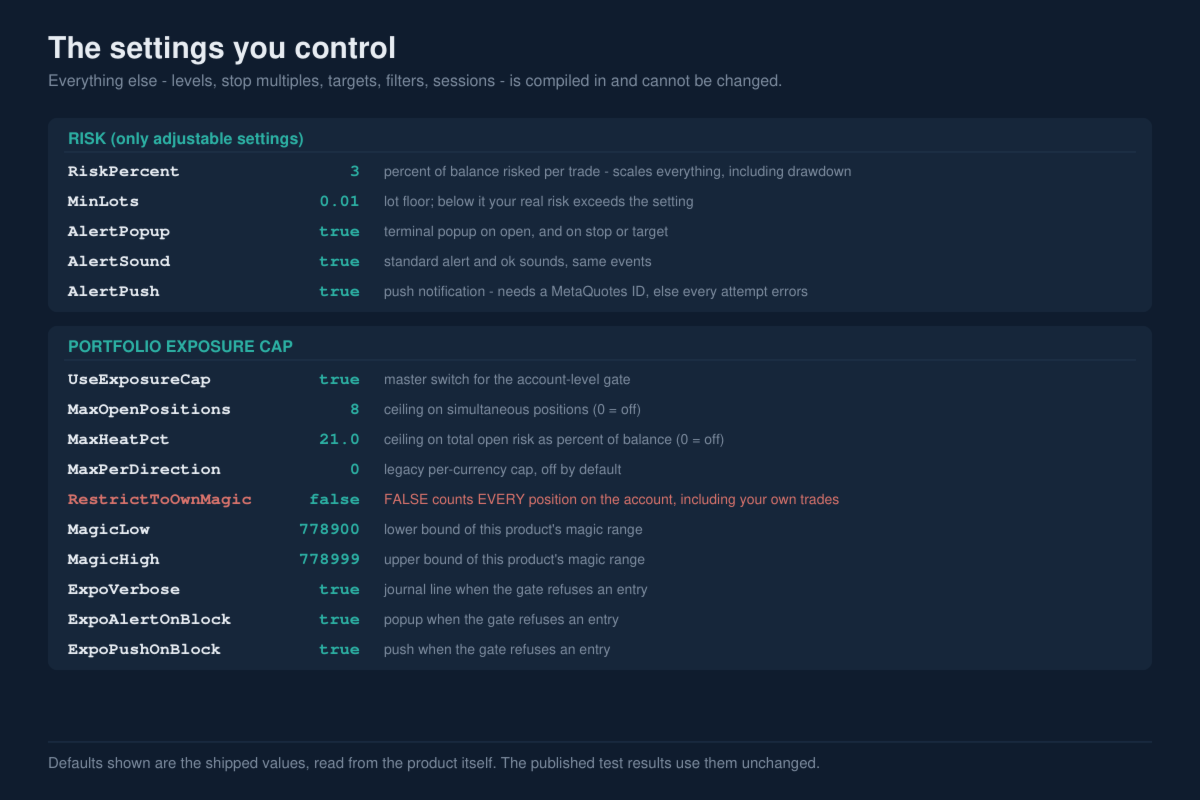
The strategy parameters are locked. The per-pair levels, stop multiples, target ratios, filters and session rules are compiled in and are not exposed as inputs, so they cannot be changed by accident and the version you run is the version that was tested. The inputs below are the ones you control.
RiskPercent, default 3. Percentage of account balance risked per trade, used with that trade's stop distance to size the position. This single input scales everything, including drawdown. The published results use 3.
MinLots, default 0.01. Floor on position size. If the size calculated from RiskPercent falls below this floor or below your broker's own minimum, the Expert Advisor still trades at the minimum, which risks more than RiskPercent on that trade. Small accounts are affected by this most.
AlertPopup, default true. Terminal popup when a trade opens, and when it closes at its stop or its target.
AlertSound, default true. Plays the terminal's standard alert and ok sounds on the same events.
AlertPush, default true. Sends a push notification on the same events. This requires a MetaQuotes ID configured in your terminal options. Without one, every attempt fails and writes an error line to the journal. Set it to false if you do not use push notifications.
UseExposureCap, default true. Master switch for the account level gate described above.
MaxOpenPositions, default 8. Maximum simultaneous open positions before new entries are refused. Set 0 to disable this limit.
MaxHeatPct, default 21. Maximum total risk on open positions, as a percentage of balance, before new entries are refused. Set 0 to disable this limit. At the default RiskPercent of 3, this limit and the 8-position limit bind at approximately the same point.
MaxPerDirection, default 0, which is off. A legacy rule that limited how many positions could be open in the same direction on the same currency. Retained only for users who want it.
RestrictToOwnMagic, default false. When false, the position count and heat limits count every position on the account, including your own manual trades and any other Expert Advisor's positions. When true, only this Expert Advisor's own positions are counted. If you trade the same account manually or run other robots on it, set this to true.
MagicLow, default 778900, and MagicHigh, default 778999. The range of magic numbers treated as belonging to this Expert Advisor when RestrictToOwnMagic is true. Do not change these unless you know why you are changing them.
ExpoVerbose, default true. Writes a journal line when the gate refuses an entry.
ExpoAlertOnBlock, default true. Popup when the gate refuses an entry.
ExpoPushOnBlock, default true. Push notification when the gate refuses an entry. Same MetaQuotes ID requirement as AlertPush.
WHO THIS IS NOT FOR
Read this before buying. It is here to stop the wrong purchase, not to be modest.
If you need a smooth equity curve, this is not it. Maximum drawdown in the published tests ranged from 9.1 percent to 35.1 percent at the default 3 percent risk, and nine of the 28 pairs drew down more than 24 percent.
If you are trading a prop firm evaluation with a fixed maximum drawdown rule, do not buy this at the default settings. The published drawdown figures are far outside typical challenge limits. No tests at other risk settings are published, so treat any lower-risk figure you calculate as your own estimate.
If you want a verified live track record before you buy, wait. There is none at launch. Everything on this page is Strategy Tester simulation on one broker's history.
If you want frequent trades, this is the wrong timeframe. The 28 pairs averaged 113 trades each over 4.6 years, which is roughly two per month per chart. A single chart can go weeks without a signal.
If you want to run one pair on one chart with a small account, look elsewhere. The design assumes several charts, and below roughly 500 USD at 3 percent risk the minimum lot size means you will be risking more per trade than the setting says.
If you want to optimise or change the strategy, this is not that product. The per-pair parameters are compiled in and cannot be edited. You control risk, alerts and the exposure limits, and nothing else. That is intentional, and it is the wrong choice for a trader who wants to tune.
If your broker prefixes symbol names, for example mEURUSD or FX_EURUSD, the Expert Advisor will not match the tuned settings and will run untested median parameters instead. Check your symbol names first.
If you cannot run an always-on terminal or a VPS, expect to miss signals. Entries occur on completed H4 bars and a missed bar is a missed trade.
If you are looking for a product that will make a specific amount of money, this one does not attempt to offer that, and no amount is promised anywhere on this page.
REQUIREMENTS AND SETUP
MetaTrader 5. A hedging account is recommended. On a netting account, a manual position you hold on the same symbol merges with this Expert Advisor's position, and the stop and target then apply to the merged position.
Timeframe H4. There is no timeframe restriction in the program, because Market rules do not allow products to impose one. Since version 1.11 the Expert Advisor reads H4 bars whatever chart it is attached to, so the strategy and the published results are the same on any timeframe. An H4 chart is still recommended, so that what you see on the chart matches what the program is acting on.
One chart per pair, all in one terminal, so the account level gate can see all of them. Attach the same file to each H4 chart.
Broker symbol names. The Expert Advisor matches the pair name at the start of the symbol, so broker suffixes work: EURUSDz, EURUSD.raw, EURUSD_i and EURUSD.pro are all recognised. Broker prefixes are not recognised: on a broker that names the symbol mEURUSD or FX_EURUSD, the Expert Advisor will not find the tuned settings and will fall back to the untested median set, with a notice in the journal. Check your broker's symbol naming before buying if this may apply to you.
Deposit. Size the account so that RiskPercent of balance is larger than the risk of one minimum lot on the widest-stopped pair you intend to run, otherwise the MinLots floor described above makes your real risk higher than the setting. As a practical guide that means about 500 USD or more at 3 percent risk, and about 1,500 USD or more at 1 percent risk. The published tests used 1,000 USD per pair at 3 percent.
Spread and swap. Entries are once per completed H4 bar, so the Expert Advisor is not sensitive to latency, but positions are held for days, so swap rates matter and a wide-spread account will reduce results. A low-spread account is recommended.
A VPS or an always-on machine is recommended, since a missed bar is a missed signal.
KNOWN LIMITATIONS
Validated on H4 only. Since version 1.11 it trades H4 bars on any chart, so attaching it to another timeframe does not change the strategy or the results.
Symbols outside the 28 listed pairs run on untested median parameters, with a journal notice.
Brokers that prefix symbol names are not recognised, as described above.
The account level exposure gate counts all account positions unless RestrictToOwnMagic is set true.
The published results are single-symbol tests. They do not represent a portfolio result and cannot be added together.
Push notifications require a MetaQuotes ID and log errors without one.
There is no live track record published with this release. Everything on this page is simulation.
RISK DISCLAIMER
Trading foreign exchange on margin carries a high level of risk and may not be suitable for all investors. The high degree of leverage can work against you as well as for you. Before deciding to trade foreign exchange you should carefully consider your investment objectives, level of experience and risk appetite. The possibility exists that you could sustain a loss of some or all of your initial investment.
All results presented on this page are from historical simulation in the MetaTrader 5 Strategy Tester. Past performance, whether historical or simulated, does not indicate future results. A backtest describes what a set of rules would have done on one broker's recorded history, not what they will do in future markets. Results depend on your broker's spreads, commissions, swap rates and execution, which differ from those used in these tests.