Equity Analyzer MT5
- Utilities
- Version: 1.0
- Activations: 20

Equity Analyzer is a trading history analysis tool for MetaTrader 5. It helps you assess account performance, review trades by period and symbol, compare results across expert advisors, and find patterns in reports — from the current account or imported data.
Detailed article with screenshots: Equity Analyzer — Complete Guide
Equity Analyzer focuses on two core tasks:
- Equity Indicator — a balance and equity indicator in a subwindow of the terminal chart. Shows how balance and equity changed as trades were executed.
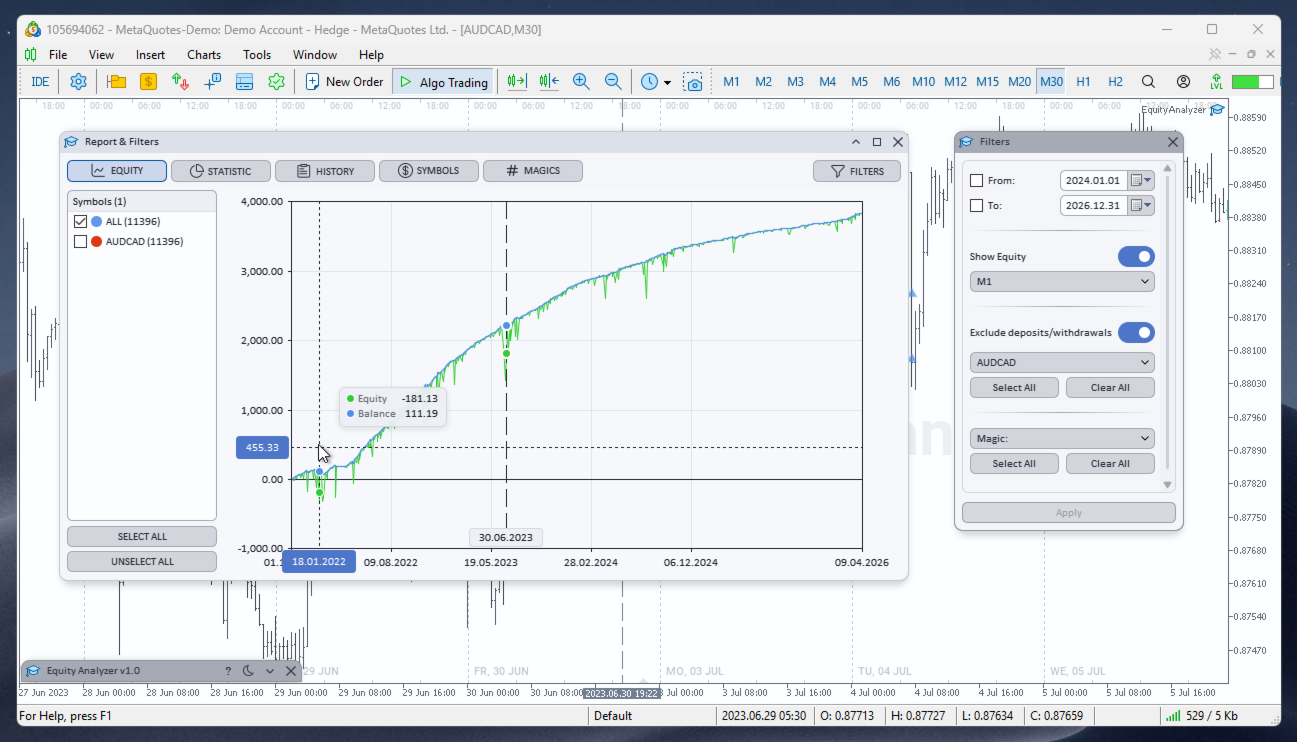
- Interactive results graph — a clear overview of balance/equity and per-symbol curves. Select a point on the graph to instantly jump to the corresponding trade on the terminal chart.
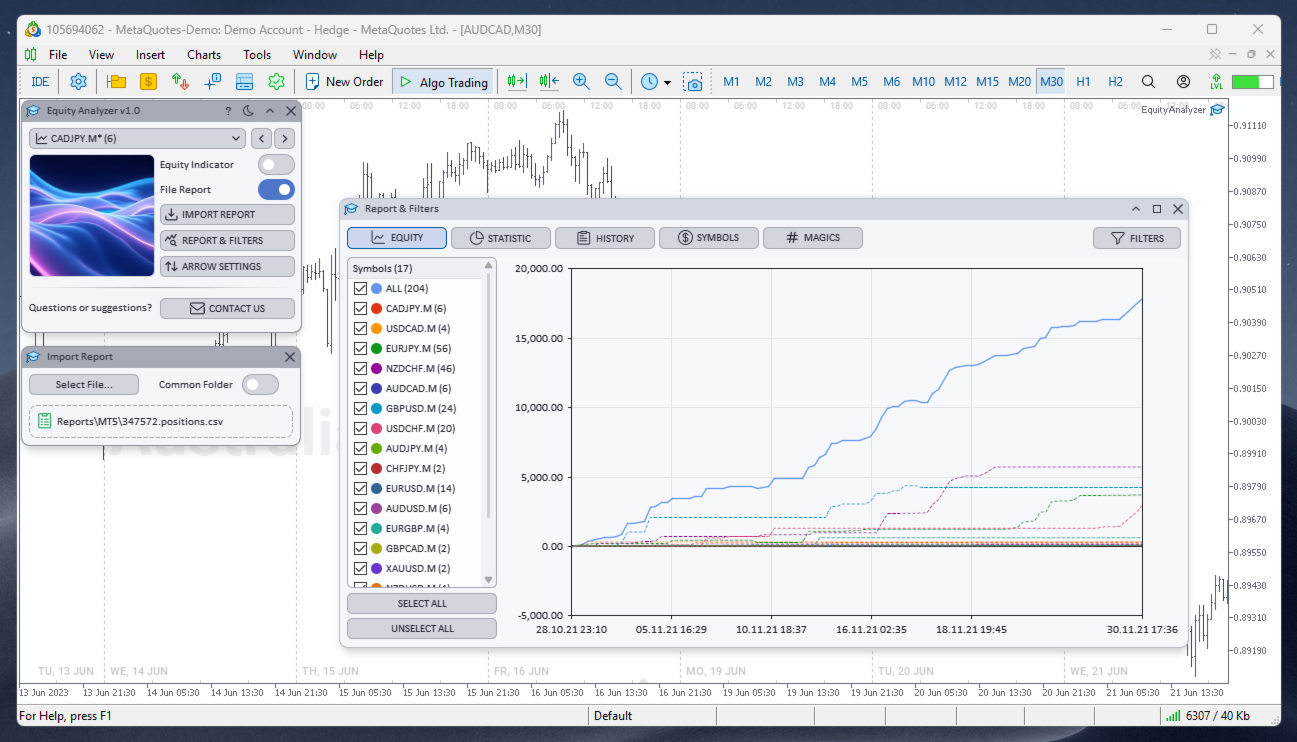
Work with the current account history or enable File Report and load a trading report via IMPORT REPORT — multiple file formats are supported, including CSV and other report types. This is useful for analyzing other traders' results, tests, and archived data. The selected file and folder are saved automatically.
The Report & Filters window combines analytics and filtering: tabs EQUITY, STATISTIC, HISTORY, SYMBOLS, and MAGICS show the graph, key metrics, trade list, and summaries by instrument and magic number. Click a row in the trade history or a marker on the graph — the terminal chart moves to the open time of the selected operation.
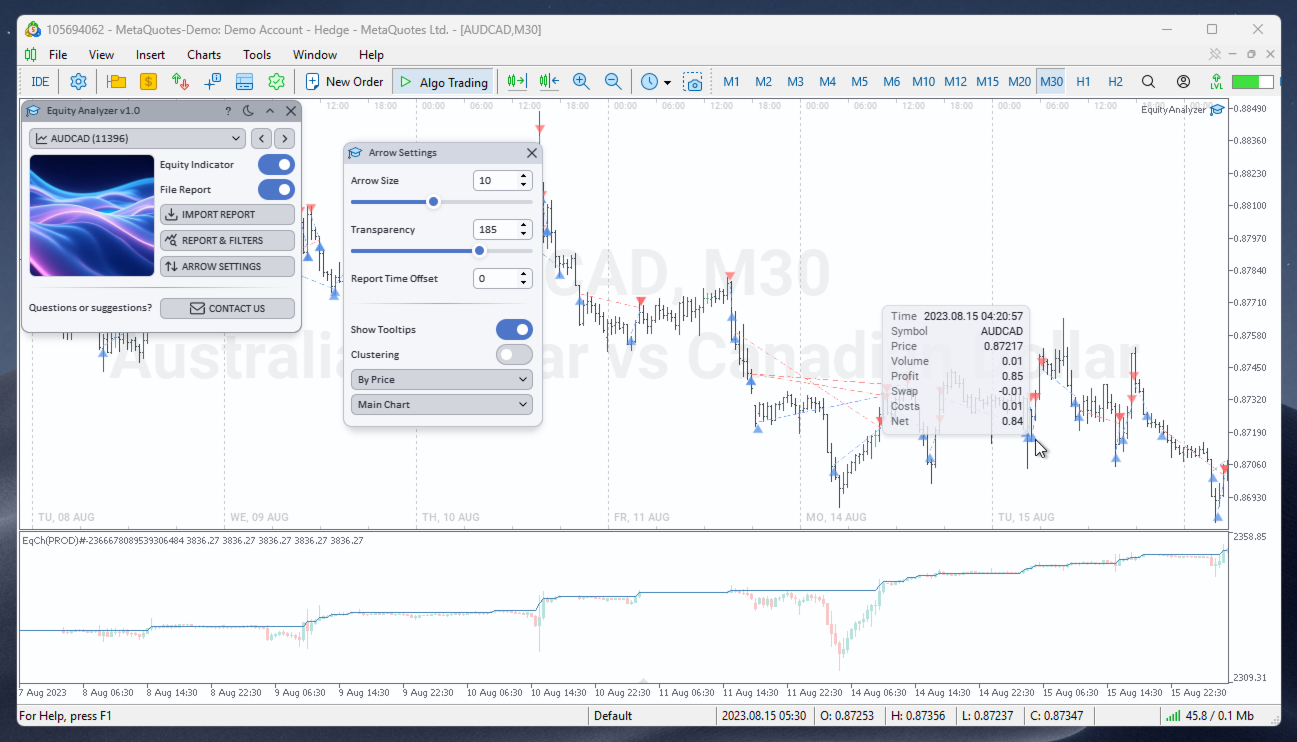
Trades on the chart are shown as customizable arrows with tooltips, clustering of nearby operations, and a choice of display area — on the main chart, in the equity subwindow, or both. All settings are saved automatically and restored on the next launch.
Application Windows
Equity Analyzer consists of several interconnected windows:
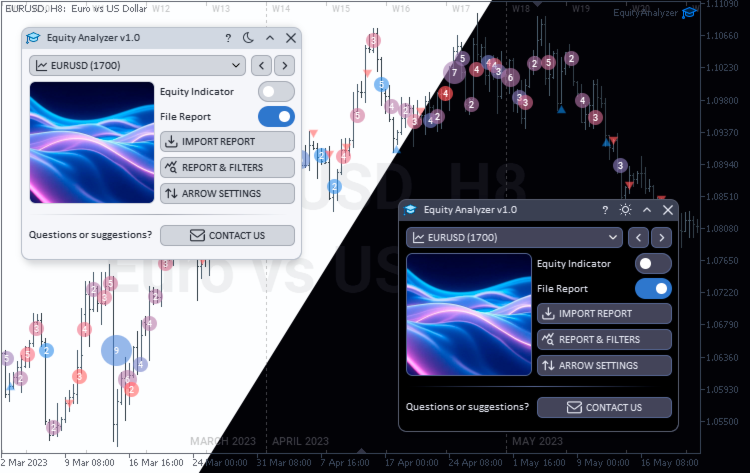
- Main Window — control center: chart symbol selection, Equity Indicator switch, File Report mode, and buttons IMPORT REPORT, REPORT & FILTERS, ARROW SETTINGS, and CONTACT US. A progress indicator appears while data is loading.
- Import Report — select a trading report file in supported formats (CSV and others), Common Folder switch for the terminal shared folder, and display of the selected file path.
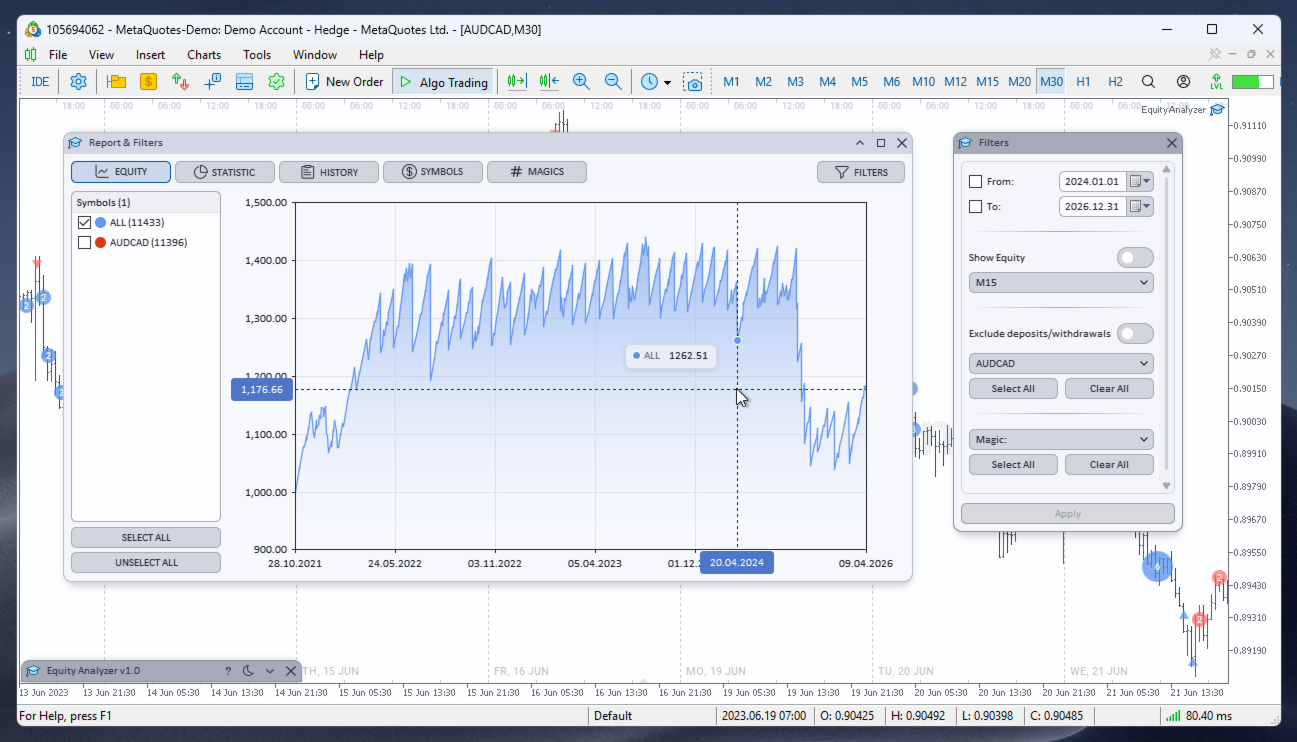
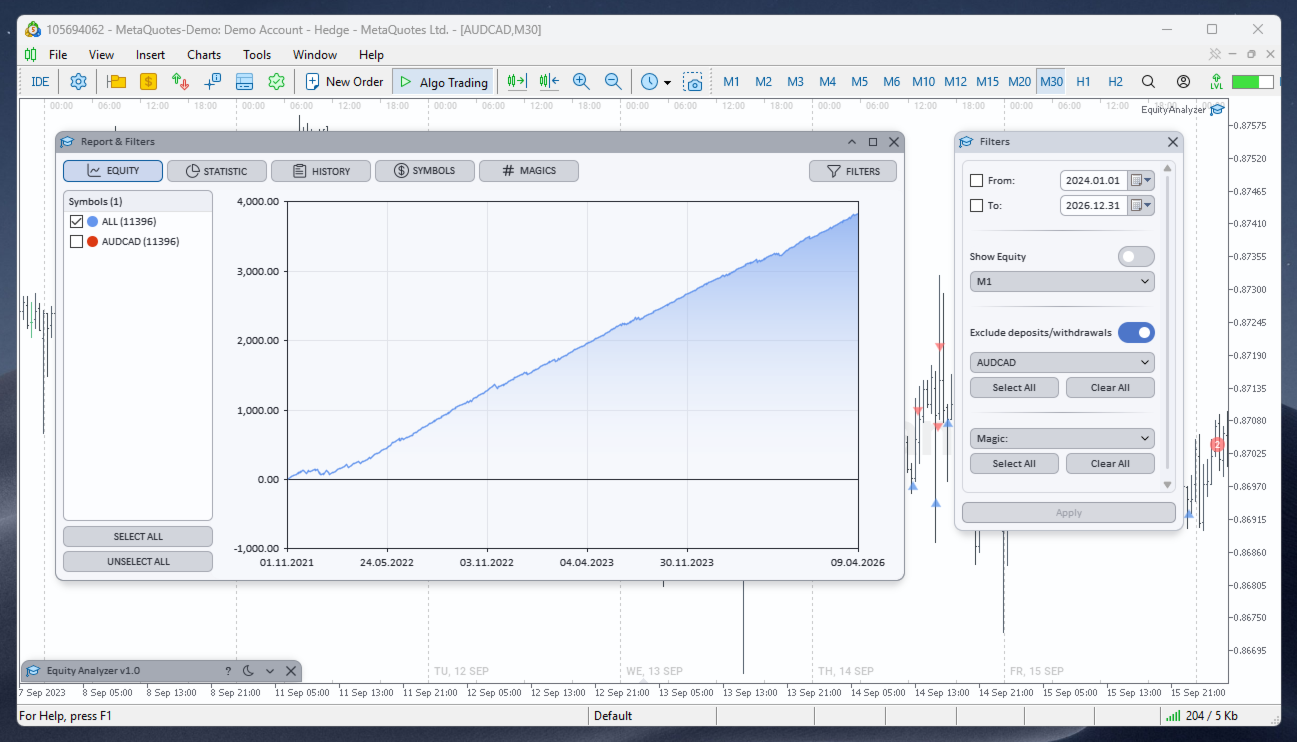
- Report & Filters — main analytics window with tabs EQUITY (interactive graph and per-symbol curve table), STATISTIC (key trading metrics), HISTORY (trade history with navigation), SYMBOLS and MAGICS (statistics by instrument and magic number). The Filters button opens the filters window.
- Filters — filter trades by period, equity timeframe, symbols and magic numbers; exclude deposits and withdrawals.
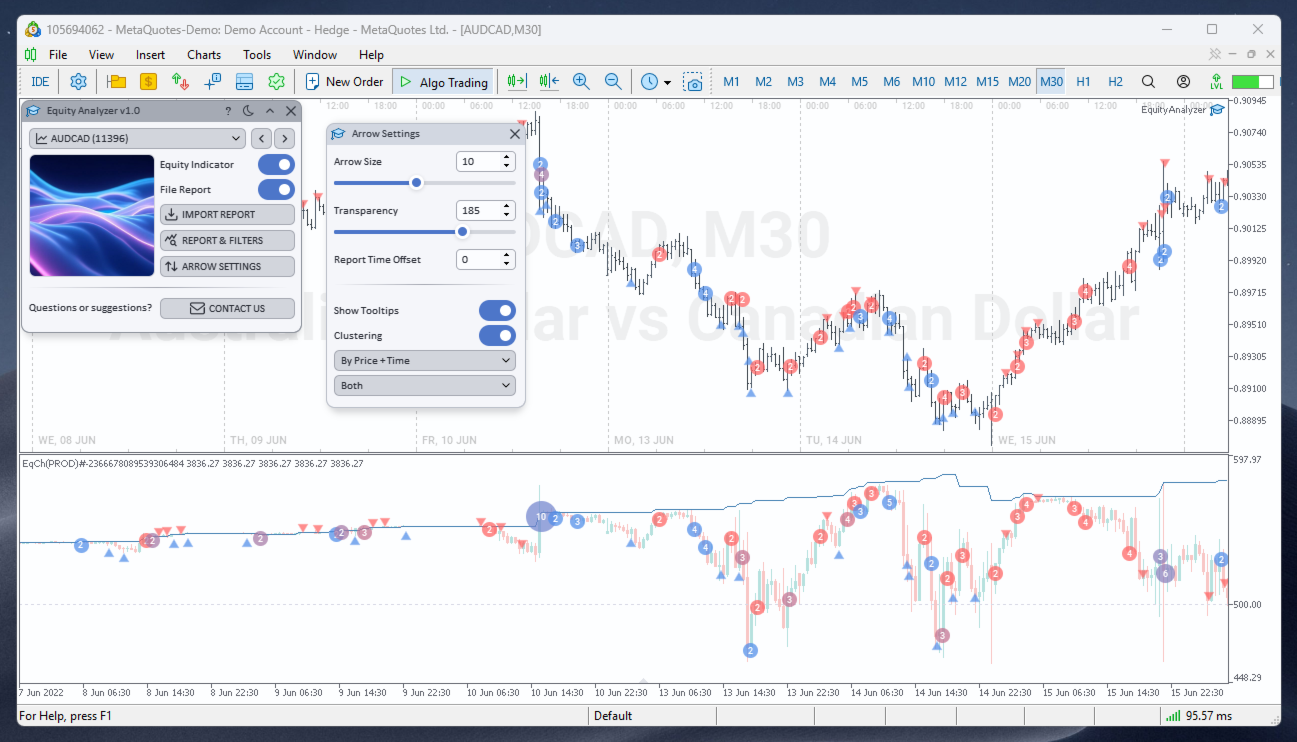
- Arrow Settings — arrow size and transparency, report time offset, hover tooltips, clustering mode, and display area on the chart.
Filter Settings
- From / To — date range for trade selection.
- Show Equity — display the equity curve on the interactive graph.
- Timeframe — timeframe for equity calculation.
- Exclude deposits/withdrawals — exclude deposits and withdrawals from analysis.
- Symbol — filter by instruments with multi-symbol selection; Select All and Clear All buttons.
- Magic — filter by expert advisor magic numbers; Select All and Clear All buttons.
- Apply — apply filters and refresh the graph, tables, and statistics.
Deal Arrow Settings
- Arrow Size — arrow size on the chart.
- Transparency — arrow transparency.
- Report Time Offset — time offset to align the report with the chart.
- Show Tooltips — tooltips when hovering over a trade.
- Clustering and Clustering Mode — group nearby trades (By Price, By Time, By Price + Time, Adaptive).
- Display Mode — where to show arrows: None, Equity, Main Chart, or Both.
Features
- Balance and equity indicator in a chart subwindow
- Interactive balance/equity graph and per-symbol curves
- Import trades from external reports in various formats or analyze current account history
- Filtering by period, symbols, magic numbers, and operation type
- Key trading metrics: profit, drawdown, recovery factor, and more
- Instant navigation to a selected trade on the terminal chart
- Customizable deal arrows on the main chart and in the equity subwindow
- Tooltips, clustering, and flexible choice of arrow display area
- Dark and Light themes — switch with one click
- Resizable windows with auto-adapting content
- High-quality graphics with smooth rounded forms
- Crisp display on high-DPI screens
- Automatic settings save and restore
How to Use
- Launch Equity Analyzer on the chart of the symbol you need.
- Choose the trade source: current account history or a report file in File Report mode via IMPORT REPORT.
- Enable Equity Indicator — the balance and equity indicator works with any data source.
- Open REPORT & FILTERS, set filters in the Filters window, and click Apply.
- Switch between tabs EQUITY, STATISTIC, HISTORY, SYMBOLS, and MAGICS to analyze results.
- Click a trade in HISTORY or a marker on the graph — the terminal chart moves to the selected moment.
- Adjust trade display in ARROW SETTINGS as you prefer.
I would greatly appreciate a positive review if you are happy with your purchase. If something is not working for you — contact me and we will find a solution. Suggestions for new features are welcome — your ideas help improve the product.
Contacts
- All my products: https://www.mql5.com/en/users/tol64/seller
- Contact me: https://www.mql5.com/en/users/tol64