ExoPanels

🇺🇸 English

### ExoPanels v7.1

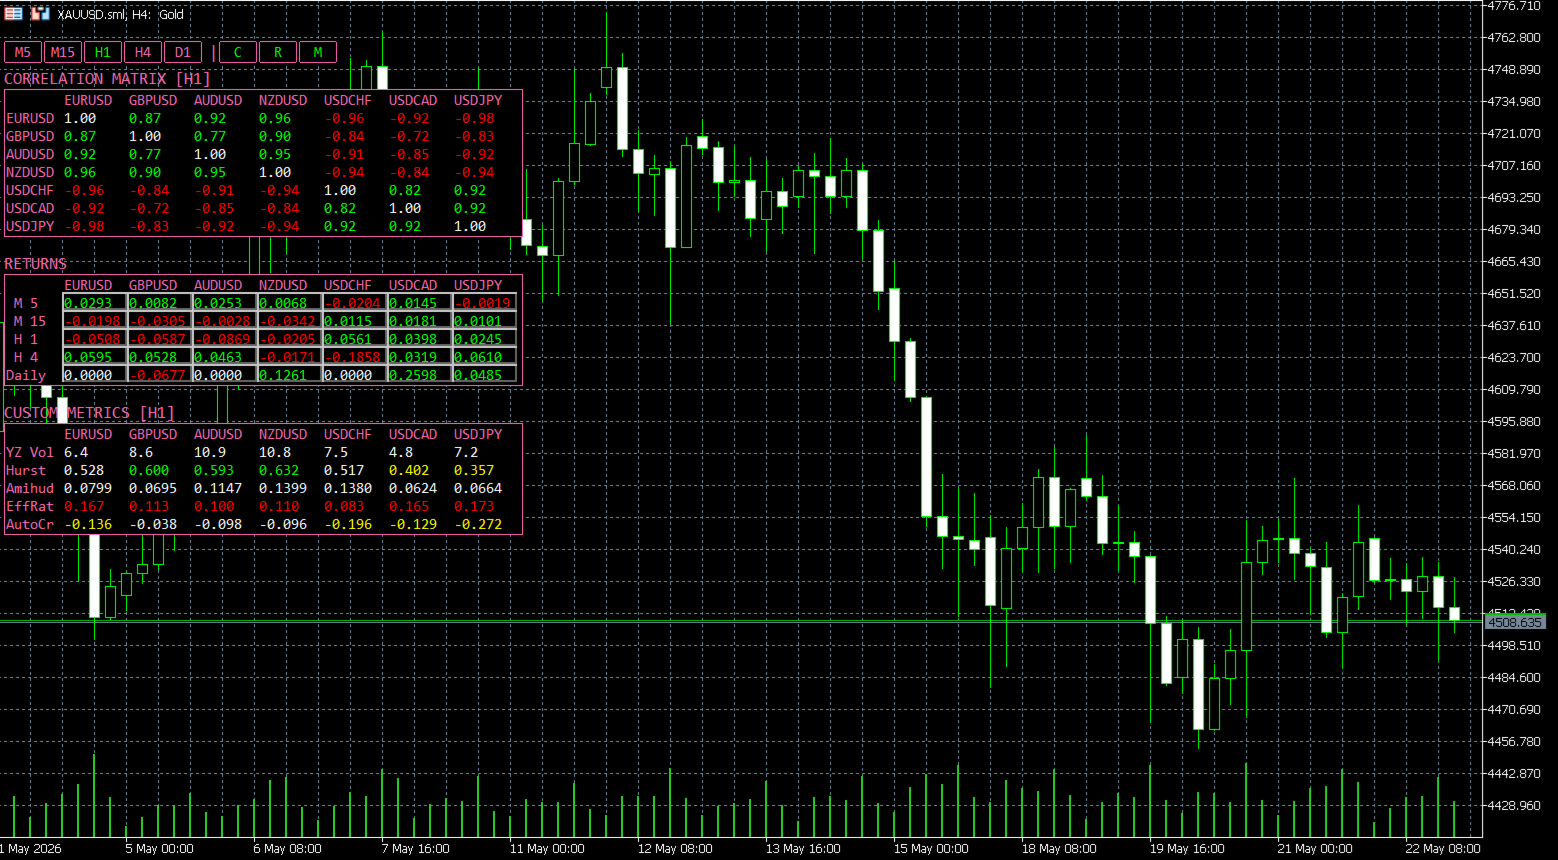
ExoPanels v7.1 is an analysis panel for MetaTrader 5 that displays correlations, returns, and statistical metrics for several symbols in one view. Its main purpose is to help identify overexposure between assets and compare market behavior without constantly switching charts.

#### How it works

The indicator reads the configured symbols, loads historical data from the active timeframe, and calculates a Pearson correlation matrix using the selected method. It also calculates the return of the last closed candle for each configured symbol and timeframe, together with custom metrics related to volatility, liquidity, efficiency, risk, and price structure.

Main readings:

- **Positive correlation:** assets tend to move in the same direction.
- **Negative correlation:** assets tend to move in opposite directions.
- **Correlation near zero:** the recent linear relationship is weak.
- **Positive or negative return:** shows the percentage change of the last closed candle.
- **Custom metrics:** add context about regime, volatility, risk, or liquidity.

#### Visual features

- Multi-symbol correlation matrix with color-coded values.
- Returns panel by symbol and timeframe.
- Custom metrics panel with up to 10 rows.
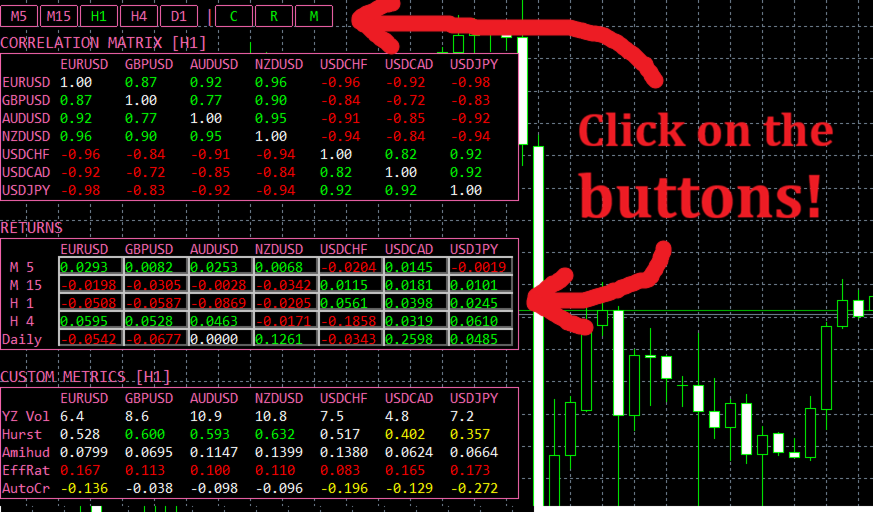
- Buttons to change the timeframe used by the matrix and metrics.
- Clickable return cells to switch the chart to the selected symbol and timeframe.
- Buttons to show or hide correlation, returns, and metrics.

#### Parameter table

| Parameter | Default value | Description |
|---|---:|---|
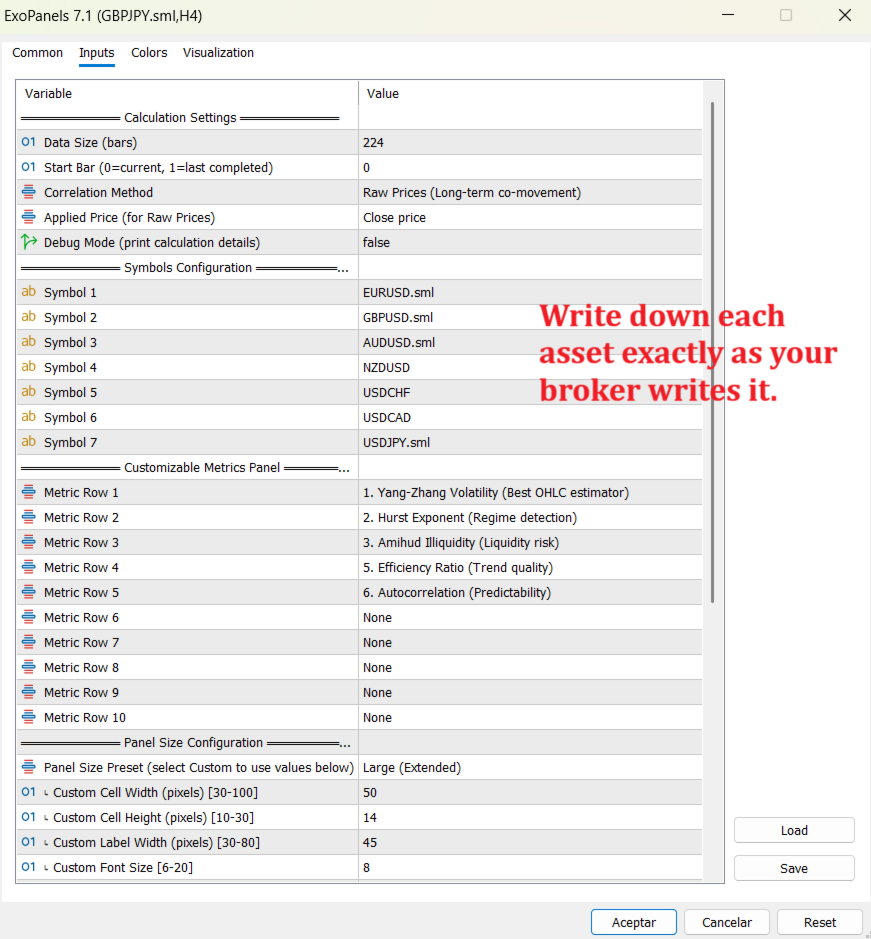
| InpDataSize | 224 | Number of bars used in calculations. |
| InpStartBar | 0 | Starting bar for correlation and metrics; 0 uses the current candle, 1 uses the last closed candle. |
| InpCorrType | CORR_RAW_PRICES | Correlation method: prices, returns, body, wicks, range, gap, volume, or direction. |
| InpAppliedPrice | PRICE_CLOSE | Applied price used when raw price correlation is selected. |
| InpDebugMode | false | Prints calculation details in the log. |
| InpSymbol1–InpSymbol7 | EURAUD, EURCAD, EURCHF, EURGBP, EURJPY, EURNZD, EURUSD | Symbols included in the panels; empty fields are skipped. |
| InpMetric1–InpMetric10 | YZ Vol, Hurst, Amihud, Efficiency Ratio, Autocorrelation, None x5 | Metrics shown in each row of the custom panel. |
| InpPanelSize | SIZE_MEDIUM | Panel size preset: Small, Medium, Large, or Custom. |
| InpCustomCellW | 50 | Cell width used with SIZE_CUSTOM. |
| InpCustomCellH | 14 | Cell height used with SIZE_CUSTOM. |
| InpCustomLabelW | 45 | Label width used with SIZE_CUSTOM. |
| InpCustomFontSize | 8 | Font size used with SIZE_CUSTOM. |
| InpColorText | clrHotPink | Main text and border color. |
| InpColorBg | clrBlack | Panel background color. |
| InpColorPos | clrLime | Color for positive readings. |
| InpColorNeg | clrRed | Color for negative readings. |
| InpColorNeu | clrWhite | Color for neutral readings. |
| InpFontName | Consolas | Font used in the panels. |
| InpTF1–InpTF5 | M5, M15, H1, H4, D1 | Timeframes shown in the returns panel. |
| InpPanelX | 5 | Horizontal panel position. |
| InpPanelY | 40 | Vertical panel position. |

#### Key characteristics

- Visual indicator for MT5; it does not open or close trades.
- Supports up to 7 symbols and 5 configurable timeframes.
- Correlation can be based on prices, returns, candle structure, volume, or direction.
- Useful for reviewing duplicated exposure, relative strength, and market conditions.
- Readings can change during the current candle if InpStartBar is set to 0; using 1 focuses the calculation on closed candles.


More from author
UTBot Alerts
Ulises Calderon Bautista
4.5 (2)
UT Bot Alerts — ATR Trailing Stop System Faithful MQL5 & MQL4 conversion of the legendary "UT Bot Alerts" indicator by QuantNomad from TradingView. Originally developed by Yo_adriiiiaan with the core idea by HPotter, and refined into Pine Script v4 with alerts by QuantNomad (Vadim Cissa) — one of the most followed quant developers on TradingView with over 100K followers. The original script has accumulated 1.1 million+ views and 35,500+ favorites on TradingView, making it one of the most popular
FREE
SuperTrend for MT5
Ulises Calderon Bautista
4.38 (8)
The popular "SuperTrend" indicator is a technical analysis tool that helps identify the direction of a trend and potential entry or exit points in financial markets. The indicator is based on the Average True Range (ATR), which measures market volatility based on price ranges. It's free on other platforms and there's no reason it shouldn't be here as well! It's commonly used in three ways: To Identify the Current Trend: When the price is above this line, it's considered an uptrend, and when the
FREE
UT Bot Alerts for MT4
Ulises Calderon Bautista
5 (1)
UT Bot Alerts — ATR Trailing Stop System Faithful MQL5 & MQL4 conversion of the legendary "UT Bot Alerts" indicator by QuantNomad from TradingView. Originally developed by Yo_adriiiiaan with the core idea by HPotter, and refined into Pine Script v4 with alerts by QuantNomad (Vadim Cissa) — one of the most followed quant developers on TradingView with over 100K followers. The original script has accumulated 1.1 million+ views and 35,500+ favorites on TradingView, making it one of the most popular
FREE
BollingerRSI Strategy
Ulises Calderon Bautista
5 (1)
### Bollinger + RSI, Double Strategy v1.1 Faithful MQL4/MQL5 port of ChartArt's popular TradingView strategy (41,800+ users, 990+ favorites). Generates buy and sell signals only when **both indicators confirm simultaneously** — RSI momentum shift + Bollinger Band breakout on the same candle. **How it works** The strategy uses an unconventional configuration: a fast RSI(6) with its crossover level set at 50 (acting as a momentum direction filter, not an overbought/oversold detector), combined
FREE
Donchian Channels trend mt5
Ulises Calderon Bautista
5 (1)
### Donchian Channels Trend v1.0 A trend-following breakout indicator that encapsulates price action within a dynamic envelope based on historical highs and lows. Originally conceptualized for TradingView, this tool provides a clear visualization of the directional bias using state memory. **How it works** The algorithm calculates the absolute maximum and minimum values over a specified lookback period. It utilizes a finite state machine (FSM) to maintain the current trend direction based on s
FREE
Impulse MACD mt5
Ulises Calderon Bautista
### Impulse MACD [ LazyBear ] v1.0 Port of LazyBear's open-source TradingView indicator, which has accumulated over 8,700 favorites since its publication in 2015. It filters out false MACD signals by measuring momentum only when price breaks outside a smoothed moving average channel. #### How it works The indicator builds a channel using two Smoothed Moving Averages (SMMA) applied to the High and Low. A Zero-Lag EMA (mathematically equivalent to DEMA) is computed on the typical price (HLC3).
FREE
Donchian Channels trend mt4
Ulises Calderon Bautista
### Donchian Channels Trend v1.0 A trend-following breakout indicator that encapsulates price action within a dynamic envelope based on historical highs and lows. Originally conceptualized for TradingView, this tool provides a clear visualization of the directional bias using state memory. **How it works** The algorithm calculates the absolute maximum and minimum values over a specified lookback period. It utilizes a finite state machine (FSM) to maintain the current trend direction based on s
FREE
ADX and DI mt4
Ulises Calderon Bautista
### ADX and DI v1.00 Faithful MQL4/MQL5 port of BeikabuOyaji's "ADX and DI" indicator from TradingView, one of the most widely used ADX implementations on the platform with over 43,000 users. It displays +DI, −DI, and ADX in a single subwindow, using a hybrid smoothing approach — Wilder's method for the Directional Indexes and a simple moving average for the ADX line. #### How it works The indicator implements Welles Wilder's Directional Movement System with one notable variation in the fina
FREE
Heikin Ashi Trend mt5
Ulises Calderon Bautista
Heikin Ashi Trend Indicator v2.1 MQL5/MQL4 port of the Heikin Ashi Trend Indicator originally published on TradingView by dman103 (2,300+ likes, 80,000+ views). It combines Heikin Ashi candle smoothing with the Tilson T3 moving average to produce clean, noise-reduced trend signals directly on the price chart. #### How it works The indicator processes price data in two stages. First, it computes Heikin Ashi OHLC values from the regular candlestick data. Then, it applies the Tilson T3 moving a
FREE
BollingerRSI Strategy MT4
Ulises Calderon Bautista
### Bollinger + RSI, Double Strategy v1.1 Faithful MQL4/MQL5 port of ChartArt's popular TradingView strategy (41,800+ users, 990+ favorites). Generates buy and sell signals only when **both indicators confirm simultaneously** — RSI momentum shift + Bollinger Band breakout on the same candle. **How it works** The strategy uses an unconventional configuration: a fast RSI(6) with its crossover level set at 50 (acting as a momentum direction filter, not an overbought/oversold detector), combined
FREE
ADX and DI mt5
Ulises Calderon Bautista
### ADX and DI v1.00 Faithful MQL4/MQL5 port of BeikabuOyaji's "ADX and DI" indicator from TradingView, one of the most widely used ADX implementations on the platform with over 43,000 users. It displays +DI, −DI, and ADX in a single subwindow, using a hybrid smoothing approach — Wilder's method for the Directional Indexes and a simple moving average for the ADX line. #### How it works The indicator implements Welles Wilder's Directional Movement System with one notable variation in the fina
FREE
SuperTrend for MT4
Ulises Calderon Bautista
The popular "SuperTrend" indicator is a technical analysis tool designed to help identify trend direction and potential entry or exit points in financial markets. This indicator is built upon the Average True Range (ATR) , which gauges market volatility based on price ranges. It is available for free on other platforms, and this should be no exception! Common Use Cases The SuperTrend is typically utilized in three primary ways: Trend Identification: When the price is trading above the indicator
FREE
Coral
Ulises Calderon Bautista
### Coral Trend Indicator v1.0 The Coral Trend Indicator is a faithful port of LazyBear's TradingView script (10,900+ favorites) to MetaTrader 4 and MetaTrader 5. It applies Tim Tillson's T3 Moving Average algorithm (1998) as a color-coded trend filter on the price chart. #### How it works The indicator passes the price through six cascaded Exponential Moving Averages, then combines stages 3 through 6 using binomial polynomial coefficients derived from the Constant D parameter. This pro
FREE
Coral mt4
Ulises Calderon Bautista
### Coral Trend Indicator v1.0 The Coral Trend Indicator is a faithful port of LazyBear's TradingView script (10,900+ favorites) to MetaTrader 4 and MetaTrader 5. It applies Tim Tillson's T3 Moving Average algorithm (1998) as a color-coded trend filter on the price chart. #### How it works The indicator passes the price through six cascaded Exponential Moving Averages, then combines stages 3 through 6 using binomial polynomial coefficients derived from the Constant D parameter. This pro
FREE
Impulse MACD mt4
Ulises Calderon Bautista
### Impulse MACD [ LazyBear ] v1.0 Port of LazyBear's open-source TradingView indicator, which has accumulated over 8,700 favorites since its publication in 2015. It filters out false MACD signals by measuring momentum only when price breaks outside a smoothed moving average channel. #### How it works The indicator builds a channel using two Smoothed Moving Averages (SMMA) applied to the High and Low. A Zero-Lag EMA (mathematically equivalent to DEMA) is computed on the typical price (HLC3).
FREE
The "Envelope of Adaptive Moving Average" indicator is a tool to assist you in making informed decisions in the financial market. It is designed to provide you with a clear view of the trend direction and potential entry and exit points in your trades. This indicator is based on an adaptive moving average, which means it automatically adjusts to changes in market volatility. This makes it especially useful in markets that can be both calm and volatile. The indicator displays two lines that enve
FREE
Double or Triple EMA Envelope
Ulises Calderon Bautista
5 (1)
The Exponential Moving Averages (Double or Triple) Envelopes Indicator is a technical analysis tool designed to assist you in identifying trends and potential reversal points in the financial market. This indicator offers traders the flexibility to choose between two types of exponential moving averages: the Double Exponential Moving Average (DEMA) or the Triple Exponential Moving Average (TEMA). Key Features: Double or Triple Exponential: Switch between DEMA and TEMA based on your analysis pre
FREE
Heikin Ashi Trend mt4
Ulises Calderon Bautista
### Heikin Ashi Trend Indicator v2.1 MQL5/MQL4 port of the Heikin Ashi Trend Indicator originally published on TradingView by dman103 (2,300+ likes, 80,000+ views). It combines Heikin Ashi candle smoothing with the Tilson T3 moving average to produce clean, noise-reduced trend signals directly on the price chart. #### How it works The indicator processes price data in two stages. First, it computes Heikin Ashi OHLC values from the regular candlestick data. Then, it applies the Tilson T3
FREE
Telemetry
Ulises Calderon Bautista
Exobeacon Telemetry is a sentiment analysis overlay that shows in real time how current news is impacting the markets you trade. The product consumes the Exobeacon Labs backend (proprietary backend at api.exobeacon.com ), which monitors 49 news sources and processes each batch with semantic LLM analysis. The result: a consolidated sentiment score per asset, updated every minute, visualized directly on your chart. Unlike generic economic calendars or unprocessed RSS feeds, Exobeacon Telemetry int
FREE
Filter:
No reviews
Reply to review