ENGLISH
Nadaraya-Watson Envelope
Developed by: Engineer Kassymbekov Serik with the assistance of Claude AI (Anthropic)
Platform: MetaTrader 5
Type: Non-parametric regression envelope indicator
---
Overview
Nadaraya-Watson Envelope is a price channel indicator built on the Nadaraya-Watson kernel regression method. Unlike standard moving averages that treat all bars equally, this indicator assigns each bar an individual weight based on its distance from the current point — nearby bars carry more influence, distant bars carry less. The result is an exceptionally smooth curve that accurately captures the market trend without unnecessary noise.
An envelope is constructed around the regression curve using the Mean Absolute Error (MAE). The upper band signals an overbought zone; the lower band signals an oversold zone. When price touches either band, the indicator plots directional arrows and can trigger pop-up alerts.
A Brief History
The method was independently developed in 1964 by two scientists: Soviet-Georgian mathematician Elizbar Nadaraya and Australian statistician Geoffrey Watson. Both published their findings in the same year without knowledge of each other's work. The method became a cornerstone of mathematical statistics and is widely used today in machine learning and data analysis.
How It Works
- Gaussian kernel — bar weights decay along a bell curve as distance increases
- NW curve — a weighted average of price over the window, producing a perfectly smooth line
- Envelope — bands are drawn as NW ± (MAE × Multiplier)
- Signals — red arrow down ( Sell) on touch of the upper band, green arrow up ( Buy) on touch of the lower band
---
Parameters
| Parameter | Default | Description |
| Window Size | 500 | Calculation depth in bars |
| Bandwidth | 8.0 | Smoothing strength |
| Multiplier | 3.0 | Envelope width |
| Source | Close | Price source |
| Arrow Distance | 10 | Arrow offset from bar (points) |
| Enable Alerts | false | Enable pop-up alerts |
Disclaimer
This indicator (Expert Advisor) is provided solely as an analytical and informational tool and does not guarantee profits, successful trades, or any specific financial results. All trading decisions are made independently by the user and at their own risk.
Trading in financial markets involves substantial risk, including the possible loss of part or all invested capital. Past performance does not guarantee future results.
Users are strongly advised to follow proper Risk Management principles, use protective stop-loss orders, and never risk funds that they cannot afford to lose.
The author is not a financial advisor and does not provide investment, financial, legal, or tax advice. Nothing contained in this software should be considered a recommendation, solicitation, or offer to buy, sell, or hold any financial instrument.
The user is solely responsible for complying with all applicable laws, regulations, and requirements in their jurisdiction related to trading and the use of financial software.
By installing or using this indicator (Expert Advisor), the user acknowledges and accepts full responsibility for all trading activities and their outcomes.




















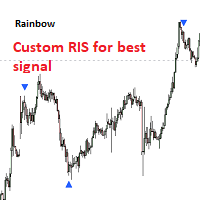
























It looks like the perfect indicator. But it repaints!!!!
The Buy and Sell signals can move over an hour after they first appeared on the chart once you have taken the trade.
One hour after that the buy or sell signal can disappear completely leaving you wondering what happened, but the other old signals still look perfect.
This indicator should be called 20/20 hindsight.