Tick Data Exporter

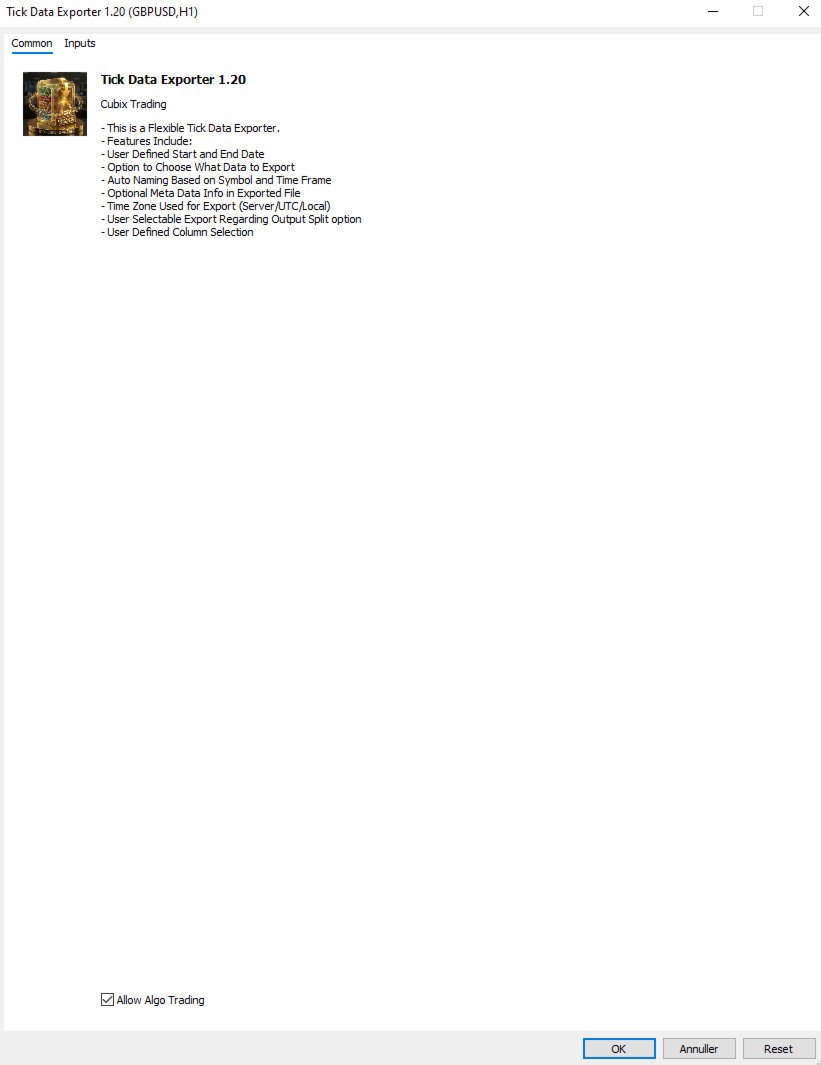
The primary function of this script, Tick Data Exporter, is to efficiently extract historical tick data.
Tick data represents the most granular level of market data, capturing every single price change.
The script downloads this data from a broker and formats it into CSV files for external quantitative analysis.

Five things tick data shows that bars permanently hide:
  1. Spread microstructure: Bars give you one spread number per period (typically the spread at bar close). Ticks show you the spread literally tick-by-tick. The widening seconds before high-impact news is invisible in bars; in ticks it's a billboard. Same for the "spread blink" some brokers do at session opens — they widen for 200ms and tighten back. Bar data smears it out.
  2. Quote frequency as a volatility proxy: When a market is "thinking," ticks come in slowly — maybe 1 to 2 per second. When it's reactive, you get 30 to 50 per second. Tick density itself, separate from price movement, is a real signal. Some professional traders watch quote frequency more than they watch price. A sudden burst of ticks without much price change can precede a directional move by tens of seconds.
  3. Bid/ask asymmetry: In tick exports you see flag patterns like a BID-only update followed milliseconds later by an ASK-only update. That pattern reveals which side of the market is leading. Sustained bid-leading versus ask-leading often precedes directional moves by several seconds. Bar data has no concept of this — bars only show you the resulting price, not the order in which the bids and asks moved.
  4. True touch quality: When you ask "did price touch this level?" using bar data, you check bar high or bar low. Tick data tells you not just whether, but how many times, for how long, and at what spread. Three completely different texture-of-touch readings for the same level.
  5. Sub-bar reversal mapping: A bar that opens at the low and closes at the high (a strong bull bar) tells you nothing about the *path*. Did price spike to the high in the first 30 seconds and chop sideways? Did it grind up steadily? Did it spike, retrace 90%, then break out? These three patterns produce nearly identical bars and very different next-bar behavior. Tick data reconstructs the path.

When NOT to use tick data:
Tick data has costs that bar data doesn't: file size, fetch time, and analytical complexity. The tool isn't right for every question. Use bar data instead when:
  • You're studying multi-day or multi-week trends. Bar data on the right TF is plenty.
  • You only care about open/high/low/close values. Bars deliver these directly; ticks would require aggregation.
  • You're correlating multiple symbols. The OHLC exporter's wide format is far better for this. Tick timestamps don't align across symbols.
  • You're working in Excel without much patience.

Settings:

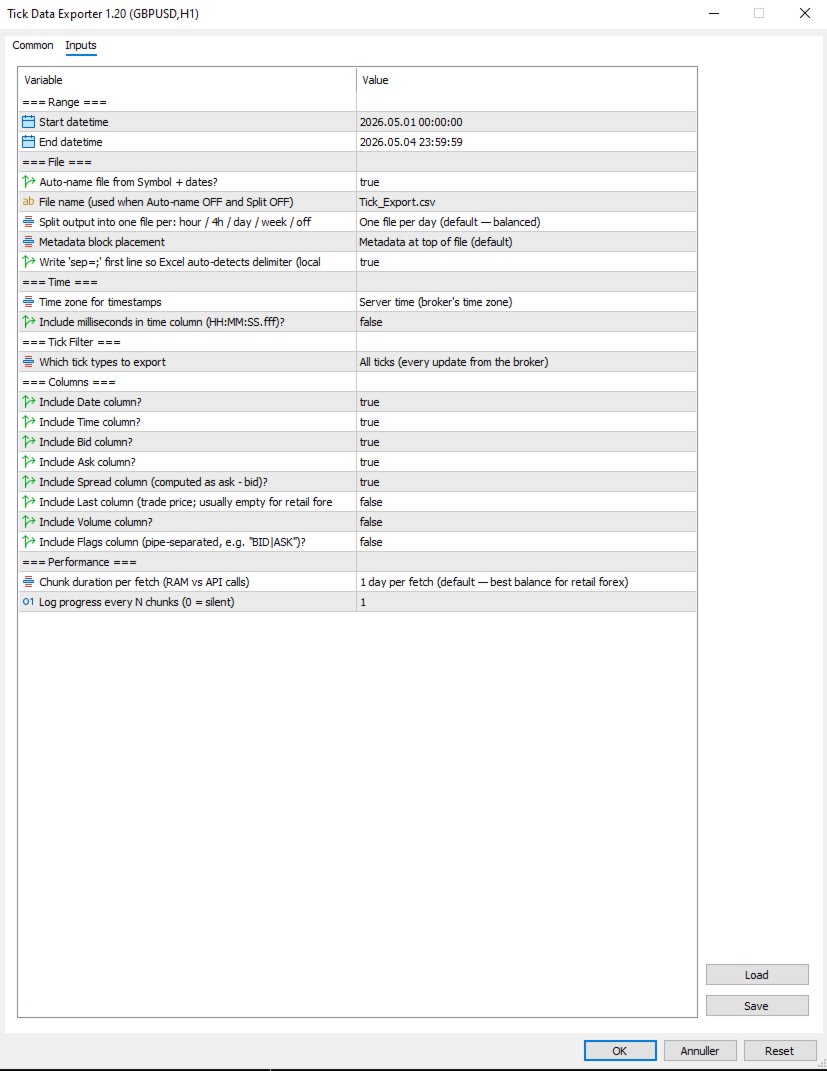
=== Range ===
  1. Start datetime: First moment to fetch ticks for, in server (broker) time. Inclusive.
  2. End datetime: Last moment to fetch ticks for, in server (broker) time. Exclusive of the very last second by convention. Must be after Start datetime. Always specify a date range.

=== File ===
  1. Auto-name file from Symbol + dates?: When true, output filenames are derived from symbol, date(s), and split granularity (e.g. EURUSD_TICKS_2026-05-04_13h.csv). When false, uses File name (used when Auto-name OFF and Split OFF), with date/hour suffixes appended for split-mode exports to avoid collisions.
  2. File name (used when Auto-name OFF and Split OFF): Manual filename (used only when Auto-name file from Symbol + dates? is false). For split exports, the relevant date or date_HHh suffix is inserted before the .csv extension automatically.
  3. Split output into one file per: hour / 4h / day / week / off: How to slice the export into separate files. Off = single file for whole range. 1H/4H = one file per hour or 4-hour window (good for news-window analysis). 1D = one per day (default, balanced). 1W = one file per week (long-range exports). Boundaries align to natural clock units.
  4. Metadata block placement: OFF, TOP, or BOTTOM. Top is default; choose BOTTOM if you plan to use Excel's freeze-top-row feature on the data.
  5. Write 'sep=;' first line so Excel auto-detects delimiter (locale-safe)?: When true, writes 'sep=;' as the very first line of the file. Excel reads this hint and automatically uses semicolon as the delimiter for that file regardless of the OS regional setting. Recommended on European locales (Danish, German, French) where Excel's default delimiter is comma.

=== Time ===
  1. Time zone for timestamps: Time zone for the Date and Time columns. Server = broker's time zone. UTC = GMT/no offset (best for cross-system data analysis). Local PC = your machine's time zone.
  2. Include milliseconds in time column (HH:MM:SS.fff)?: When true, the Time column shows HH:MM:SS.fff with millisecond precision. Important for high-frequency tick data where multiple ticks per second are common. Adds a few characters per row but doesn't significantly increase file size. Recommended ON for serious analysis.

=== Tick Filter ===
  1. Which tick types to export: Which tick types to export. ALL = everything the broker sent. BIDASK = only ticks that updated bid or ask (skips pure-volume ticks; reduces file size slightly). TRADES = only ticks marking actual trades (TICK_FLAG_LAST). Trades-only is rare-to-empty for retail forex but populated for indices, stocks, and centrally-cleared instruments.

=== Columns ===
Each column is independently toggleable. Disabling unused columns shrinks file size, sometimes meaningfully. For example, disabling Volume and Last on retail forex saves about 5% per row.

  1. Include Date column?: Include the Date column (ISO YYYY-MM-DD). Disable only if all your ticks are in one day and you don't need the date.
  2. Include Time column?: Include the Time column. Format depends on "Include milliseconds in time column (HH:MM:SS.fff)?".
  3. Include Bid column?: Include the bid price at the time of the tick.
  4. Include Ask column?: Include the ask price at the time of the tick.
  5. Include Spread column (computed as ask - bid)?: Include the spread (computed as ask - bid, rounded to symbol digits). Recommended ON; spread microstructure is one of the main reasons to use tick data.
  6. Include Last column (trade price; usually empty for retail forex)?: Include the last trade price. Empty for most retail forex (no actual trades reported); useful for indices/stocks. Default off because it's mostly empty.
  7. Include Volume column?: Include trade volume. Same caveat as Last — mostly zero for retail forex. Default off.
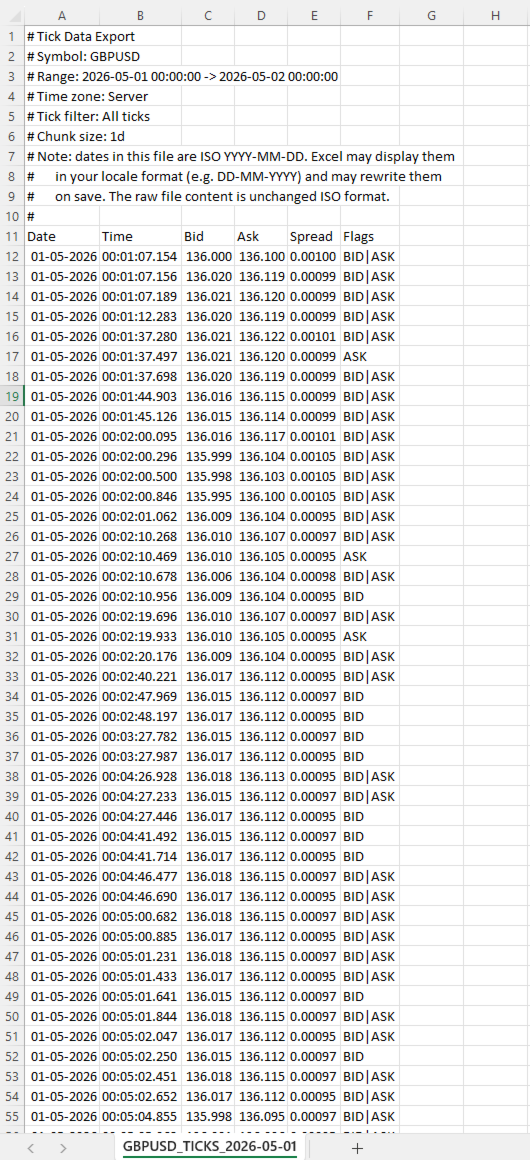
  8. Include Flags column (pipe-separated, e.g. "BID|ASK")?: Include the decoded tick flags column showing what changed in this tick (e.g. BID, ASK, BID|ASK, BID|ASK|LAST, BUY, SELL). Pipe-separated. Default off because most analyses don't need it; turn on for advanced microstructure work.

=== Performance ===
  1. Chunk duration per fetch (RAM vs API calls): Time window per API call. Smaller chunks use less RAM during fetch but require more API calls. Larger chunks use more RAM but finish faster. 1D is the right default for most retail forex use; bump to 1W if you have a beefy machine and large exports, drop to 4H or 1H if you're hitting memory issues.
  2. Log progress every N chunks (0 = silent): Log a progress line every N chunks. Set to 0 to silence intermediate progress (only the final 'mission accomplished' line will appear). Set to 5 or 10 to reduce spam on long exports.

Note that Chunk duration per fetch (RAM vs API calls) and Split output into one file per: hour / 4h / day / week / off are independent settings. Chunk size affects how the script *fetches* data internally; split granularity affects how the *output is sliced into files*. They can be set differently — for example, fetching in 1D chunks (efficient) but writing into 1H files (granular for analysis).


=== .CSV File Column reference ===
  • Date: ISO YYYY-MM-DD Date of the tick in the chosen time zone. ISO format ensures unambiguous interpretation regardless of locale.
  • Time: HH:MM:SS or HH:MM:SS.fff Time of the tick in the chosen time zone. Format depends on Include milliseconds in time column (HH:MM:SS.fff)?.
  • Bid: Bid price at the time of this tick, formatted to the symbol's digit count.
  • Ask: Ask price at the time of this tick.
  • Spread: Computed as ask - bid, rounded to the symbol's digit count. This is the actual spread at this tick, not a bar-aggregated value.
  • Last: Last trade price. Empty (or 0) when the broker didn't report a trade with this tick.
  • Volume: Trade volume. Empty for most retail forex.
  • Flags: Pipe-separated tokens Decoded tick flags. Tokens: BID (bid changed), ASK (ask changed), LAST (trade), VOL (volume update), BUY/SELL (trade direction). A single tick can have multiple flags, e.g. BID|ASK|LAST.


=== Important note about dates and Excel ===
Dates in the file are written in ISO YYYY-MM-DD format. Most tools (pandas, Python, R, plain text editors) read them exactly as written. Excel does not.
When you open a tick file in Excel, the Date column will be displayed in your locale's date format (DD-MM-YYYY in most of Europe, MM/DD/YYYY in the US). Excel auto-parses the ISO dates and re-displays them. If you save the file from Excel, Excel will also rewrite the dates to its locale format inside the file itself, mutating your original ISO data.
This is documented in the file's metadata block as a reminder. Two strategies to handle it:
Treat Excel as a viewer only, never save changes. Open, inspect, close without saving.
Read the file in pandas or Python instead of Excel. The ISO format works perfectly there.
If you specifically need Excel to leave dates alone, format the Date column as Text via the Data > From Text/CSV import wizard.


=== Tips & Examples ===
Choosing the right split granularity. The Split output into one file per: hour / 4h / day / week / off setting profoundly affects how the data is structured for analysis. Choosing the right value is about matching file granularity to your analysis question.
  • SPLIT OFF Single file When you want one continuous tick stream for an entire range and intend to use pandas or Python to filter. Avoid for ranges over 1 day — files get too large to navigate.
  • SPLIT 1H Hourly files Best for news-window analysis. FOMC, NFP, CPI: export the 4-6 hours around the event with SPLIT_1H, and you have one file per hour ready for separate analysis. Each hour-file is small enough to open in Excel.
  • SPLIT 4H Session-aligned files Best for session-based analysis. Files align to 00/04/08/12/16/20 boundaries which roughly correspond to Asian/early-European/London/lunch/NY/NY-late session windows. A week's worth is 42 files but each one is tractable.
  • SPLIT 1D Daily files (default) The general-purpose default. One day per file is a natural unit, files are 5-15 MB on retail forex, and pandas reads them quickly.
  • SPLIT 1W Weekly files Long-range exports where weekly granularity is enough. A month-long export becomes 4-5 files instead of 30.

Example 1: Studying the FOMC announcement
FOMC rate decisions land at 19:00 server time on a specific Wednesday. You want to study what the spread, tick density, and price action looked like in the 2 hours leading up and 2 hours following the announcement.
Settings:
  • Start datetime = D'2026.05.07 17:00:00' // 2 hours before FOMC
  • End datetime    = D'2026.05.07 21:00:00'    // 2 hours after
  • Auto-name file from Symbol + dates?  = true
  • Split output into one file per: hour / 4h / day / week / off    = SPLIT_1H                        // hourly files for granular analysis
  • Time zone for timestamps  = EXPORT_TIME_SERVER
  • Include milliseconds in time column (HH:MM:SS.fff)? = true                          // sub-second sequence matters around news
  • Which tick types to export = TICK_ALL
  • Include Flags column (pipe-separated, e.g. "BID|ASK")? = true                      // helps see bid-leading vs ask-leading patterns
  • Chunk duration per fetch (RAM vs API calls) = CHUNK_1D                      // single fetch fine for 4 hours
Results: four files named EURUSD_TICKS_2026-05-07_17h.csv through _20h.csv. Each file is small (1-5 MB even with the 19h announcement file probably being the largest). You can open the announcement-hour file in Excel directly to inspect, or load all four in pandas to analyze tick density vs. price change.
What to look for: spread typically widens 30-60 seconds before the announcement (broker preparing for volatility), spikes to 5-10x normal at the moment of release, then tightens back over the next 5-15 minutes. Tick density goes from 1-2 per second pre-news to 50-100 per second in the first 30 seconds post-release.

Example 2: Comparing session-open behavior across a week
You want to see whether the spread blink at the London 08:00 open behaves consistently across all five trading days of a week.
Settings:
  • Start datetime = D'2026.05.04 07:30:00'    // Monday, 30 min before London
  • End datetime    = D'2026.05.08 09:00:00'    // Friday, 1 hour after
  • Auto-name file from Symbol + dates?  = true
  • Split output into one file per: hour / 4h / day / week / off    = SPLIT_1D                  // one file per trading day
  • Time zone for timestamps  = EXPORT_TIME_UTC            // UTC since session times are commonly stated in UTC
  • Include milliseconds in time column (HH:MM:SS.fff)? = true
  • Which tick types to export = TICK_ALL
  • Chunk duration per fetch (RAM vs API calls) = CHUNK_1D
Results: five files, one per day. In each file, filter to roughly 06:30-08:00 UTC (London 07:00-09:00 wall clock). Compare spread evolution across the five days side by side.
What to look for: Mondays often have wider opens than midweek (weekend gap effects). Fridays often have tighter post-open spread (book is winding down).

Example 3: Detecting unusual tick density
You want to flag minutes where tick density was unusually high, as a signal that something interesting may have happened.
Settings:
  • Start datetime = D'2026.05.04 00:00:00'
  • End datetime    = D'2026.05.04 23:59:59'    // single full day
  • Auto-name file from Symbol + dates?  = true
  • Split output into one file per: hour / 4h / day / week / off    = SPLIT_OFF                  // single file for the whole day
  • Time zone for timestamps  = EXPORT_TIME_SERVER
  • Include milliseconds in time column (HH:MM:SS.fff)? = true
  • Which tick types to export = TICK_BIDASK              // exclude pure-volume noise
  • Include Flags column (pipe-separated, e.g. "BID|ASK")? = false                  // not needed for density analysis
  • Chunk duration per fetch (RAM vs API calls) = CHUNK_1D
Results: one file containing the full day. In pandas, group by minute and count rows. Sort descending by count. The top 10 minutes are your high-density periods. Cross-reference timestamps against your economic calendar.
This is a powerful diagnostic technique: tick density highs often precede price moves by tens of seconds, and they correlate with events that don't always make the calendar (large institutional orders, broker-side liquidity shifts, sympathetic moves from correlated markets).

Example 4: Spread cost analysis for a Backtest
You're running a Backtest at a tight stop-loss (5-8 pips) and worried that the bar-aggregated spread reading is hiding intra-bar widening that would have stopped you out. You want the actual spread at every tick during the period.
Settings:
  • Start datetime = D'2026.04.01 00:00:00'
  • End datetime    = D'2026.04.30 23:59:59'
  • Auto-name file from Symbol + dates?  = true
  • Split output into one file per: hour / 4h / day / week / off    = SPLIT_1D                  // one file per day, manageable chunks
  • Time zone for timestamps  = EXPORT_TIME_SERVER
  • Include milliseconds in time column (HH:MM:SS.fff)? = false                      // for cost analysis, second precision is fine
  • Which tick types to export = TICK_BIDASK
  • Include Bid column?    = false                  // you only need spread, not price
  • Include Ask column?    = false
  • Include Spread column (computed as ask - bid)? = true
  • Include Flags column (pipe-separated, e.g. "BID|ASK")?  = false
  • Chunk duration per fetch (RAM vs API calls) = CHUNK_1D
Results: 30 daily files, each containing only Date, Time, and Spread columns. Total volume ~50-150 MB for the month. In pandas, you can compute the empirical spread distribution: mean, p95, p99, max. Compare to the constant spread your Backtest assumed. Adjust your stop loss accordingly, or accept that some trades that worked in Backtest would have been stopped on actual spread spikes.

Example 5: Reconstructing a flash event
Something unusual happened on a chart at 14:32 — a sudden 15-pip spike followed by an immediate retrace. Bar data shows the move but not the path. You want millisecond-level detail of what actually happened.
Settings:
  • Start datetime = D'2026.05.04 14:30:00'    // 2 minutes before
  • End datetime    = D'2026.05.04 14:35:00'    // 3 minutes after
  • Auto-name file from Symbol + dates?  = true
  • Split output into one file per: hour / 4h / day / week / off    = SPLIT_OFF                  // 5 minutes is one tiny file
  • Time zone for timestamps  = EXPORT_TIME_SERVER
  • Include milliseconds in time column (HH:MM:SS.fff)? = true                      // critical for reconstructing path
  • Which tick types to export = TICK_ALL
  • Include Flags column (pipe-separated, e.g. "BID|ASK")? = true                    // see bid vs ask leading
  • Chunk duration per fetch (RAM vs API calls) = CHUNK_1H
Results: one small file with potentially 5,000-15,000 ticks depending on event severity. Open in Excel directly. Plot bid and ask over time. The exact sequence of the spike — how many ticks at the spike high, the spread when it spiked, whether bid moved first or ask moved first — tells you whether this was a stop-hunt, a fat-finger order, a news leak, or genuine liquidity event.
This kind of post-mortem is the single best use case for tick data. Bar data shows the wound; tick data shows how it was inflicted.
Recommended products
CChart
Rong Bin Su
Overview In the fast-paced world of forex and financial markets, quick reactions and precise decision-making are crucial. However, the standard MetaTrader 5 terminal only supports a minimum of 1-minute charts, limiting traders' sensitivity to market fluctuations. To address this issue, we introduce the Second-Level Chart Candlestick Indicator , allowing you to effortlessly view and analyze market dynamics from 1 second to 30 seconds on a sub-chart. Key Features Support for Multiple Second-Level
SmartSetup Bot Is an advanced trading tool that combines the flexibility of manual configurations with the power of semi-automated features. It automatically generates graphical objects, displaying critical zones such as support and resistance levels, stop loss and take profit areas, and other essential indicators. SmartSetup Bot provides clear and precise visualization of your trading parameters, facilitating informed decision-making. This bot is designed for traders who value manual control bu
FREE
Donchian Breakout And Rsi
Mattia Impicciatore
4.5 (2)
General Description This indicator is an enhanced version of the classic Donchian Channel , upgraded with practical trading functions. In addition to the standard three lines (high, low, and middle), the system detects breakouts and displays them visually with arrows on the chart, showing only the line opposite to the current trend direction for a cleaner view. The indicator includes: Visual signals : colored arrows on breakout Automatic notifications : popup, push, and email RSI filter : to val
FREE
It has never been so easy to manage the risk of your account until now, this tool will allow you to have full control of your capital and manage your entries in the synthetic index derivative markets, in an easy, practical and safe way. The available input and configuration parameters are as follows :  RISK MANAGEMENT 1. Value of your account: Here as its name says you will place the value corresponding to the size of your account, for example if your account is 150 dollars the corresponding val
Pin Bars MT5
Yury Emeliyanov
Main purpose:   "Pin Bars"   is designed to automatically detect pin bars on financial market charts. A pin bar is a candle with a characteristic body and a long tail, which can signal a trend reversal or correction. How it works:   The indicator analyzes each candle on the chart, determining the size of the body, tail and nose of the candle. When a pin bar corresponding to predefined parameters is detected, the indicator marks it on the chart with an up or down arrow, depending on the directi
FREE
The Simple Manual Trading Panel (v2.11) Is a professional trade management tool designed with a clean, movable UI to streamline manual execution and automated exit strategies. Core Features Dynamic Visual Interface: A movable GUI panel that provides real-time information including a bar countdown timer, live spread, and advanced volume analysis. Flexible Lot Size setting, with 2 decimals (If broker supports it). Multi-Stage Take Profit: Supports three distinct Take Profit (TP) levels in either
Introduction: The RosMaFin Trading Panel is not just a standard order execution tool. It is a comprehensive, professional assistant designed for manual and price-action traders who want to save time, manage risk with mathematical precision, and maintain full market awareness. Say goodbye to manual lot size calculations and tedious Stop Loss adjustments. This panel streamlines your entire trading workflow from analysis to trade exit. KEY FEATURES & BENEFITS: Advanced Risk Management & Exec
FREE
TradePulseMonitor for MetaTrader 4 & 5 Overview: TradePulseMonitor is a comprehensive, real-time dashboard indicator designed for MetaTrader 4 and MetaTrader 5. It provides traders with an at-a-glance overview of their account's financial health, risk exposure, position metrics, and historical performance. By consolidating critical data into a single, customizable on-chart dashboard, it eliminates the need to constantly check the Terminal window, allowing for faster and more informed trading de
FREE
NHK Local Time Scale NHK Local Time Scale displays your PC/local time directly on the MT5 chart , alongside the broker's native chart time. The trader can easily compare both time zones for any candle. Benefits for Traders: Quickly convert Broker Time ↔ Local/PC Time . Helps accurately set News Stop/News Filter times. Makes London, New York, Asian and other trading sessions easier to identify in your local time. Helps verify that EA session and news time settings are correct. Reduces mistakes ca
FREE
Kronos is a multi-timer that displays local time, server time and the countdown of the current period. The programme is multilingual, with a choice of English, Italian and Spanish Language selectables in input. Available in four colours and with the choise of five types of font to be used. Like any other programme we have created, the graphic interface is developed to be non-invasive and intuitive. At start-up, the three windows that make up the graphic interface of Kronos are closed on the left
Smart FVG Stats
- Md Rashidul Hasan
5 (1)
The  Smart FVG Statistics Indicator  is a powerful MetaTrader 5 tool designed to automatically identify, track, and analyze Fair Value Gaps (FVGs) on your charts. Love it? Hate it? Let me know in a review! Feature requests and ideas for new tools are highly appreciated. :) Try "The AUDCAD Trader": https://www.mql5.com/en/market/product/151841 Key Features Advanced  Fair Value Gap  Detection Automatic Identification : Automatically scans for both bullish and bearish FVGs across specified histo
FREE
Bar Replay
Okeene Rajae Chambers
Bar Replay — Manual backtesting made simple. Bar Replay is a chart-based replay tool for MetaTrader 5 that hides future candles past a "frozen time" you control. Step forward bar by bar, jump to any historical date, or auto-play at a custom speed — and practice your strategy as if you were trading the chart live, without any lookahead bias. Whether you're refining a discretionary strategy, building screen time, or studying historical price action, Bar Replay turns any chart into a training grou
FREE
CxPV Analyst
Victor Oluwapelumi Adebajo Akinpelu
CxPV Analyst is a high-performance trading utility and Expert Advisor designed for traders who demand data-driven precision over simple indicator crossovers. By combining four distinct quantitative engines into a single "Cert Score" (Certainty Score), this tool identifies high-conviction market phases while filtering out low-probability "noise." Whether you are a manual analyst looking for a powerful dashboard or an algorithmic trader seeking automated execution, CxPV Analyst provides the instit
FREE
Position Sizer PROP
Lazaro Farias Do Espirito Santo
Position Sizer PROP Stop putting your challenge at risk because of wrong lot sizing, forgotten limits, or unclear exposure before sending the next order. In PROP Firm challenges, many traders do not fail only because of poor entries. Risk management mistakes also matter: oversized lots, poorly calculated risk, daily drawdown breaches, excessive exposure, or lack of control over account rules. After approval, the challenge continues. Keeping the account active requires discipline, operational co
Google SheetExporter — MT5 ↔ Google Sheets Google SheetExporter automatically exports your full MetaTrader 5 deal history to Google Sheets and keeps it synchronized. Every few minutes, your complete trading history appears in your own spreadsheet: every deal, every position matched from entry to exit, every EA identified by name. WHAT IT DOES • Exports the complete deal history (default: 10 years back) — not just open positions • Re-syncs automatically on a timer (default every 5 minutes), start

FREE
Candle Countdown Timer - Optimized Edition Overview Candle Countdown Timer is a lightweight, high-performance indicator that displays the exact time remaining until the current candle closes. Designed with efficiency as a top priority, this indicator provides traders with essential timing information without consuming unnecessary system resources. Whether you're a scalper watching every second on M1 charts, a day trader timing entries on H1, or a swing trader monitoring daily candles, this i
FREE
High Low Open Close
Alexandre Borela
4.98 (45)
If you like this project, leave a 5 star review. This indicator draws the open, high, low and closing prices for the specified period and it can be adjusted for a specific timezone. These are important levels looked by many institutional and professional traders and can be useful for you to know the places where they might be more active. The available periods are: Previous Day. Previous Week. Previous Month. Previous Quarter. Previous year. Or: Current Day. Current Week. Current Month. Current
FREE
RSI Cortex Ai
Michael Prescott Burney
RSI Cortex AI for MT5 RSI Cortex AI is a MetaTrader 5 indicator designed to help traders analyze momentum using a multi-factor ranking model instead of relying only on a fixed RSI threshold approach. It combines momentum features, directional ranking, confidence scoring, and adaptive filtering into a clean TradingView-style workspace for chart-based analysis. What the indicator does RSI Cortex AI evaluates momentum using a broader feature set than a standard RSI line. It is designed to help trad
FREE
Session Sync MT5
Mohammadreza Faghanimakrani
Session Sync MT5 displays the Tokyo, London, New York and Sydney trading sessions directly on your chart. Each session uses its own regional daylight-saving rules and is converted to your broker's server time. The active broker time model is shown on the chart, so you can see exactly what the indicator is using. What you get • Tokyo, London, New York and Sydney session boxes • Session High/Low calculated from M1 data, independent of chart timeframe • Historical sessions loaded automatically
FREE
MSX Hybrid Heiken Scalper
Som Prakash Gehlot
5 (1)
MSX Hybrid Heiken Scalper Overview MSX Hybrid Heiken Scalper is a MetaTrader 5 indicator based on a modified Heiken Ashi methodology with closed-bar smoothing. The indicator is designed to display trend direction through color-coded candles while reducing sensitivity to short-term market fluctuations. All calculations are performed using completed candles, allowing historical values to remain fixed after bar close. Features • Modified Heiken Ashi calculation • Closed-bar processing • Color-code
FREE
StealthTrade Commander   is an advanced visual trading panel and risk-management utility designed for manual traders, scalpers, and Prop-Firm challengers. This tool helps you execute trades visually directly from the chart, hide your Stop Loss and Take Profit levels from the broker, and strictly control your daily drawdown—a crucial feature for passing and keeping Prop-Firm funded accounts.  KEY FEATURES:  Risk Guardian (Prop-Firm Protector) Max Daily Loss Limit:   Automatically closes all trad
FREE
Trade Manager DashPlus
Henry Lyubomir Wallace
4.85 (13)
DashPlus is an advanced trade management tool designed to enhance your trading efficiency and effectiveness on the MetaTrader 5 platform. It offers a comprehensive suite of features, including risk calculation, order management, advanced grid systems, chart-based tools, and performance analytics. Key Features 1. Recovery Grid Implements an averaging and flexible grid system to manage trades during adverse market conditions. Allows for strategic entry and exit points to optimize trade recovery
Algo Scalper EA
Tshepo Michael Motaung
Algo Scalper EA is a confluence day trading robot using market orders and it trades during Trading Sessions. The EA exercise consistency and risk management, it has 2 entry signals produced from  Moving Averages(90 & 120) to harvest the most out of the trending market (on automatic mode). It is capable of allowing you to trade any symbol you want and during the time you want. Profits can only be secured by take profit level. Low spread is highly recommended for this EA, and you will see signific
Survive your prop firm challenge and keep your funded account alive. Prop Firm Risk Guardian is a real-time discipline panel for funded and challenge accounts: it shows exactly how close you are to breaching your daily loss limit and trailing max drawdown, and the largest lot you may fire right now without crossing the line. What it tracks It tracks the three numbers that end challenges: your used daily loss against the limit, with the remaining buffer and a reset countdown; your maximum drawd
FREE
Trade Behavior Mirror reads your own account's closed trade history and counts one specific pattern: opening a new position shortly after a loss, at a lot size larger than your own recent normal. It does not predict, and it does not advise. Every number on the panel is something that already happened on this account. How the numbers are built: it reads up to 31 days of closed deals across every symbol and every magic number - this is an account-wide picture, not a chart-specific one. From the 3
FREE
Trade Assistant for MT5 Key Features Trade Execution & Order Management Intelligent Order Execution Panel   – Quickly place   market, pending, and snipe orders . Dynamic Lot Size Calculation   – Adjusts lot size based on   risk percentage or predefined amount . Partial Take Profit (TP) and Stop Loss (SL)   – Secure profits and minimize losses systematically. Risk Management & Protection Hidden Stop Loss   – Prevents brokers from detecting and targeting SL levels. Fake SL   – Protects against
HotKey Trade
Juan Pablo Sanchez Correa
HotKey Trade: Invisible and Fast Execution It is a minimalist order executor designed for scalpers and price action traders. It eliminates cumbersome panels and operates at maximum speed using only your keyboard. Key Points: 100% Clean Chart: No panels or buttons blocking your view of the price. Instant Execution: Fires orders to the market without menus or clicks. Dynamic Lot Management: Change your volume and view it only when you need it Quick Commands: [ C ] – Buy (BUY) [ V ] – Sell (SELL
How it works –   Base-departure detection — algorithmically finds consolidation bases (overlapping range with compressed volatility) followed by displacement departures. Patterns: Drop-Base-Rally, Rally-Base-Drop, Rally-Base-Rally, Drop-Base-Drop — detected structurally, not by candle names. –   Strength score (0–100) — from departure velocity, time-at-base, freshness (each revisit decays the score), higher-timeframe confluence and origin volume. –   Lifecycle — Fresh, Tested (decaying), Broken
FREE
CosmiCLab SMC FIBO CosmiCLab SMC FIBO is a professional trading indicator designed for traders who use Smart Money Concepts (SMC), market structure analysis and Fibonacci retracement levels. The indicator automatically detects market swings and builds Fibonacci levels based on the latest impulse movement. It also identifies market structure changes such as BOS (Break of Structure) and CHOCH (Change of Character), helping traders understand the current market direction. CosmiCLab SMC FIBO also pr
IMPORTANT NOTE: This is a professional Trade Management Utility and on-chart assistant. It is NOT an automated trading robot. It does not open trades on its own. The UltraFast Trade Manager MT5 is the ultimate execution and risk-management suite designed to give you absolute control over your manual and algorithmic trades. When managing multiple positions, calculating complex net break-even points, or constantly monitoring the economic calendar, hesitation can lead to costly mistakes. This utili
FREE
Buyers of this product also purchase
Trade Assistant MT5
Evgeniy Kravchenko
4.43 (216)
It helps to calculate the risk per trade, the easy installation of a new order, order management with partial closing functions, trailing stop of 7 types and other useful functions. Additional materials and instructions Installation instructions - Application instructions - Trial version of the application for a demo account Line function -   shows on the chart the Opening line, Stop Loss, Take Profit. With this function it is easy to set a new order and see its additional characteristics bef
Forex Trade Manager MT5
InvestSoft
4.98 (678)
Trade Manager MT5 is an advanced position size calculator and trade management tool for MetaTrader 5, designed to help traders plan trades faster, control risk more precisely, and manage open positions directly from the chart. It combines order placement, risk based lot calculation, Stop Loss and Take Profit management, Break Even, Trailing Stop, Partial Close, Equity Protection, and external trade management in one panel. Whether you trade forex, indices, metals, commodities, crypto, or future
================================================================================ POC BREAKOUT - V20.72. Full Professional Grade Toolkit ================================================================================ POC Breakout is a full MetaTrader 5 trading dashboard for discretionary traders who want breakout signals, Point of Control (POC) context, volume profiles, order flow, market structure, news, alerts, and advanced trade planning in one professional workspace. Attached directly to you
Local Trade Copier EA MT5
Juvenille Emperor Limited
4.94 (149)
Local Trade Copier EA MT5 is a fast and flexible trade copier for copying and managing trades between multiple MetaTrader 5 accounts on the same Windows computer or Windows VPS. It combines local trade synchronization with Receiver-side controls for lot sizing, risk management, trade filtering, symbol mapping, trade management and account protection. Set up your Transmitter and Receiver terminals in about 1 minute and copy manual or EA trades between accounts at the same or different brokers. U
TradePanel MT5
Alfiya Fazylova
4.88 (168)
Trade Panel is a multi-functional trading assistant. The app contains over 50 trading functions for manual trading and allows you to automate most trading tasks. Application instructions + video instructions: https://www.mql5.com/en/blogs/post/772292 Trial version of the application for a demo account: https://www.mql5.com/en/blogs/post/750865 How to install the application: https://www.mql5.com/en/blogs/post/756239 How to test the application in visual mode: https://www.mql5.com/en/blogs/post/7
Copy Telegram signals with your own trading rules Telegram to MT5 Signal Trader automatically copies text-based trading signals from public and private Telegram channels and groups into MetaTrader 5. Manage multiple providers and MT5 accounts from one desktop app, with individual risk and trade settings for each provider . No Telegram bot or API setup needed for copying. Simply sign in with your own Telegram account by phone or QR code and select the channels or groups you have already joined. Y
Strategy Ledger Pro
Abdullah Uygar Tuna
5 (2)
Strategy Ledger Pro is a read-only account analysis panel for MetaTrader 5. It separates account results by Expert Advisor, strategy, symbol, and magic number. Before you download the demo. The Market runs the demo of any paid product in the Strategy Tester only. This panel analyses the trades on your own account, and a Strategy Tester run has no account history to read, so the demo opens on an empty panel and says so. That is the demo mechanism, not the product. The video in this description wa
Telegram to MT5 MultiChannel Copier
Sergio Marquez Uroz
4.53 (15)
Telegram to MT5 Multi-Channel Copier   automatically copies trading signals from your Telegram channels straight to MetaTrader 5. No bots, no browser extensions, no manual copying. A signal arrives in Telegram and the EA opens the trade in your terminal within seconds. And before you copy a channel, the built-in backtester shows you what that channel would have done in your account. The product has two components: a Windows application that listens to your Telegram channels, and this Expert Advi
FarmedHedge Pair Trading Dashboard
Tanapisit Tepawarapruek
5 (5)
Farmed Hedge Yield Farming | All Markets (Manual - Hybrid - Semi/Automated EA) VERIFIED TRADING RESULTS - Farmed Hedge Yield Axi Copy:  https://www.mql5.com/en/signals/2356376 - Farmed Hedge Yield Exn Copy:   https://www.mql5.com/en/signals/2356404 - Farmed Hedge Yield V Copy:  https://www.mql5.com/en/signals/2357156 IMPORTANT NOTICE: FarmedHedge is a MANUAL-FOCUSED TRADING UTILITY ,not a fully automated EA. Results shown on this Signal include manual trades and overall strategic management.
Premium Trade Manager - The Trade Panel With a Coach Built In Premium Trade Manager puts a trading coach inside your chart, with a full execution engine underneath it. Set the trade up the way you always do, then let Max, your AI trading coach, read that exact setup against your live account and give you a straight verdict before you commit: is the stop disciplined, is the risk sane, is a high-impact release minutes away, are you near a prop-firm limit. Below sits the engine that runs everything
Exp COPYLOT CLIENT for MT5
Vladislav Andruschenko
3.97 (35)
Professional Trade Copier for MetaTrader 5 Fast, professional, and reliable trade copier for MetaTrader . COPYLOT allows you to copy Forex trades between MT4 and MT5 terminals with support for Hedge and Netting accounts. COPYLOT MT5 version supports: - MT5 Hedge to MT5 Hedge - MT5 Hedge to MT5 Netting - MT5 Netting to MT5 Hedge - MT5 Netting to MT5 Netting - MT4 to MT5 Hedge - MT4 to MT5 Netting MT4 version Full Description +DEMO +PDF How To Buy How To Install How to get Log Files H
Telegram To MT5 Ultra
Mirel Daniel Gheonu
5 (5)
Telegram To MT5 — Signal Copier Turn the trading calls from your Telegram channels into real MT5 orders — automatically, on as many accounts as you like, with risk and rules fully under your control. Telegram To MT5 connects the VIP / signal channels you already follow on Telegram to your MetaTrader 5 terminal. A free companion desktop app reads the messages (even from channels that block bots), and this Expert Advisor executes them on your account — applying your own risk settings, symbol mappi
The product will copy all telegram signal to MT5 ( which you are member) , also it can work as remote copier.  Easy to set up, copy order instant, can work with almost signal formats, image signal,  s upport to translate other language to English Work with all type of channel or group, even channel have "Restrict Saving Content", work with  multi channel, multi MT5 Work as remote copier: with signal have ticket number, it will copy exactly via ticket number. Support to backtest signal. How to s
Astro Trade MT5
Indra Maulana
5 (7)
25% discount on the release of the tool: only for the next 3 buyers Send a message to receive a demo version. AstroTrade Trading Assistant AstroTrade is a comprehensive multi-functional trading utility developed for the MetaTrader 5 platform. It integrates essential tools for trade execution, risk management, and technical monitoring into a single unified interface. The application is designed to assist traders in managing their daily operations through a visual and structured environment. Vi
FUTURES ORDERFLOW FOOTPRINT CHART Professional OrderFlow EA for MetaTrader 5 Version 1.01| Professional tool for real traders | Institutional-Grade Visualization STRATEGY TESTER USERS - PLEASE SELECT EVERY REAL TICK WHEN TESTING AND YOU HAVE DOWNLOADED HISTORICAL DATA. IF YOU SEE A WAITING SCREEN AND IT IS NOT DOWNLOADING, IT MEANS YOU HAVE LOW HISTORICAL DATA. TRY 1 MIN AND 5 MIN FIRST ON 1 DAY DATA. ONE DAY DATA SHOULD BE THE NEWEST AND MOST CURRENT DATE. PLEASE WAIT UNTIL THE MARKET HAS ROL
Timeless Charts
Samuel Manoel De Souza
5 (8)
Timeless Charts is an all-in-one trading utility for professional traders. It combines custom chart types such as Seconds Charts and Renko with advanced order flow analysis using Footprints , Clusters , Volume Profiles , VWAP studies, and anchored analysis tools for deeper market insight. Trading and position management are handled directly from the chart through an integrated trade management panel , while Market Replay and Virtual Accounts provide environments for practicing trading skills and
Trade Copier Ultimate
Janitha Sandaruwan Amaradasa Wickramasingha Arachchilage
5 (5)
Trade Copier Ultimate - Telegram to MT5 Signal Copier Trade Copier Ultimate automatically copies Telegram trading signals into MetaTrader 5. The EA can read signal messages, detect the symbol, order type, entry price, Stop Loss, Take Profit levels and selected update commands, then execute or manage the trade in MT5 using your lot and risk settings. It is more than a basic Telegram to MT5 copier. TCU also supports Bot API and user-account Bridge workflows, Discord signal routing, local MT5 to MT
Trade Dashboard MT5
Fatemeh Ameri
4.94 (133)
Trade Dashboard simplifies how you open, manage, and control your trades, with built-in lot size calculation. It allows you to execute trades, manage risk, and control positions directly on the chart, with tools such as partial close, breakeven, and trailing stop. Designed to reduce manual work and help you stay focused on your trading decisions. A demo version is available for testing. Detailed explanations of features are provided within the MQL5 platform. Installation instructions are include
EA Overfitter
Stephen J Martret
5 (1)
That backtest looks great. But will it still be making money tomorrow, next week, next month? EA Overfitter re-runs your EA on 100 price histories it has never seen. One score tells you if the edge is real. A backtest tells you what an EA did on one price history — the one that happened to occur. What you cannot tell from it is how much of that result was the strategy and how much was the particular path. EA Overfitter answers that. It builds up to 100 synthetic price histories your EA has n
Trade Indicator Assistant   is a powerful MT5 utility designed to turn indicators into automated trading systems. Its main feature is the ability to automatically detect an indicator’s   BUY and SELL signal buffers , without requiring you to know the buffer numbers, search through indicator settings, or modify the indicator source code. Bonus Indicator:   After purchasing Trade Indicator Assistant, contact me to receive   Trade Signal Pro   completely free as a bonus indicator. [Download Demo V
Message me after purchase to receive the complete manual kit + 3-day OpenAI API trial to test the AI features + Another bonus gift The current price is a limited discount for August Relaunch Update — secure your edition now before price go up. Next Price: $340 This is completely different from any trading panel you’ve tried or seen on the market. It’s one of the most innovative AI-powered trading panels available in the retail market right now. Imagine connecting   AI directly to your chart   —
HINN MagicEntry Extra
ALGOFLOW OÜ
4.74 (19)
HINN MAGIC ENTRY – the ultimate tool for entry and position management! SIMPLE. FASTEST. INTUITIVE. MAX AUTOMATED. Place orders by selecting a level directly on the chart! full description   ::  demo-version  :: 60-sec-video-description Key features: - Market, limit, and pending orders - Automatic lot size calculation - Automatic spread and commission accounting - Unlimited partitial take-profits  - Breakeven and trailing stop-loss and take-profit  functions - Invalidation leves - Intuitive, a
Trade Assistant 38 in 1
Makarii Gubaydullin
4.91 (23)
Multifunctional tool: Lot Calculator, Grid Orders, R/R ratio, Trade Manager, Supply and Demand zones, Price Action and much more Demo version   |   User manual Trade Assistant   doesn't work in the strategy tester : you can download the   Demo Version HERE  to test the utility . Contact me   for any questions  / ideas for improvement / in case of a bug found If you need a MT4 version, it is available here Simplify, speed up and automate your trading   process . Expand the standard terminal capa
Footprint Chart Pro — Professional OrderFlow EA for MetaTrader 5 Version 6.34 | Professional tool for real traders | Institutional-Grade Visualization DEMO USERS - PLEASE SELECT EVERY TICK / REAL TICK WHEN TESTING AND YOU HAVE DOWNLOADED HISTORICAL DATA. IF YOU SEE A WAITING SCREEN AND IT IS NOT DOWNLOADING, IT MEANS YOU HAVE LOW HISTORICAL DATA. TRY 1 MIN AND 5 MIN FIRST ON 1 DAY DATA. ONE DAY DATA SHOULD BE THE NEWEST AND MOST CURRENT DATE. PLEASE WAIT UNTIL THE MARKET HAS ROLLED OVER PERIOD.
Grid Manual MT5
Alfiya Fazylova
4.73 (22)
Grid Manual is a trading panel for working with grid strategies. The utility is universal, has flexible settings and an intuitive interface. It works with a grid of orders not only in the direction of averaging losses, but also in the direction of increasing profits. The trader does not need to create and maintain a grid of orders, the utility will do it. It is enough to open an order and the "Grid manual" will automatically create a grid of orders for it and will accompany it until the close. F
Trade copier MT5
Alfiya Fazylova
4.6 (55)
Trade Copier is a professional utility designed to copy and synchronize trades between trading accounts. Copying occurs from the account / terminal of the supplier to the account / terminal of the recipient, which are installed on the same computer or VPS . PROMOTION - If you have already purchased the "Trade Copier MT5," you can receive the "Trade Copier MT4" for free (for copying MT4 > MT5 and MT4 < MT5). For more detailed information about the conditions, please contact us via private message
Anchor Trade Manager
Kalinskie Gilliam
5 (9)
Your EAs cannot see each other, but Anchor can. Anchor gives you one place to coordinate your EAs, manage risk, and decide when trading is allowed. It works alongside the trading bots you already use without any changes to them. The Problem One EA opens a trade. Then another starts trading. The next thing you know, you wake up to multiple grids built across your account. Each EA may be doing exactly what it was designed to do, but together they can place far more risk on your account than you in
Seconds Chart MT5
Boris Sedov
4.61 (18)
Seconds Chart is a unique tool for creating second-based charts in MetaTrader 5 . With Seconds Chart , you can construct charts with timeframes set in seconds, providing unparalleled flexibility and precision in analysis that is unavailable with standard minute or hourly charts. For example, the S15 timeframe indicates a chart with candles lasting 15 seconds. You can use any indicators and Expert Advisors that support custom symbols. Working with them is just as convenient as on standard charts.
Power Candles Strategy Scanner - Self-Optimizing Multi-Symbol Setup Finder Power Candles Strategy Scanner runs the same self-optimizing engine that powers the Power Candles indicator - on every symbol in your Market Watch, side by side. One panel tells you which symbols are statistically tradable right now, which strategy wins on each, the optimal Stop Loss / Take Profit pair, and pings you the moment a fresh signal fires. This tool is part of the Stein Investments ecosystem - 18+ tools plus Max
Effortlessly manage multiple trading accounts The Local Trade Copier EA is a solution for individual traders or account managers who need to execute trade signals from external sources or who need to manage several accounts at the same time, without the need for a MAM or a PAMM account. It copies from up to 8 master accounts to unlimited slave accounts . [ Installation Guide | Update Guide | Troubleshooting | FAQ | All Products  ] 100% self hosted Easy to install and use It can copy from MT4 t
More from author
News Marker
Kenneth Weleh
News Markers Description Version: 1.13Type: MetaTrader 5 indicator (chart window) Purpose: Plots economic-calendar news events as color-coded vertical lines on the chart, with optional currency tags and an upcoming-news HUD panel. Before you start — three things that always apply Live connection required. The data comes from MT5's built-in economic calendar via your broker's feed. It returns nothing in the Strategy Tester, and nothing if your broker doesn't serve calendar data. If no lines appe
FREE
What Is Fibonacci Pilot Mini? Fibonacci Pilot Mini is a semi-automatic Expert Advisor for MetaTrader 5. It assists the trader in placing Fibonacci-based trades by automating the mechanical steps after the trader has identified the swing. The trader performs the analysis; the EA handles lot sizing, entry price calculation, stop loss, take profit levels, and order placement. Mini is the streamlined single-setup edition of Fibonacci Pilot Pro. It runs one trade setup at a time with a clean, minima
FREE
The Simple Manual Trading Panel (v2.11) Is a professional trade management tool designed with a clean, movable UI to streamline manual execution and automated exit strategies. Core Features Dynamic Visual Interface: A movable GUI panel that provides real-time information including a bar countdown timer, live spread, and advanced volume analysis. Flexible Lot Size setting, with 2 decimals (If broker supports it). Multi-Stage Take Profit: Supports three distinct Take Profit (TP) levels in either
Trend Matrix Panel is a multi-timeframe technical indicator for MetaTrader 5 that compresses an entire trading session's structural picture into a single panel. Rather than flipping between charts to read M1, M15, H1, and D1 separately, the panel shows the trend state of three configurable moving averages across twelve timeframes simultaneously, with a heatmap that draws your eye to the genuinely strong signals and away from noise. The core idea is simple: every cell in the matrix tells you how
This script is an Intelligence Gathering Utility designed to give you full control over your data exports from MetaTrader 5. It allows you to synchronize up to three different symbols into a single file with precise timestamping. 1. Setting the Data Range (Range) You can define exactly which historical period you want to capture: Date Mode : If Last N bars (0 = use date range above) is set to 0 , the script will export all data between your chosen start and end dates. Bar Mode : By entering a nu
FVG Multi TimeFrame Levels — Indicator Overview What it is A multi-timeframe   Fair Value Gap   detector and analysis tool for MetaTrader 5. It scans price action across up to four configurable timeframe "slots" simultaneously, identifies gaps that meet a configurable significance threshold, draws them as boxes on the current chart, and tracks how each gap behaves over its lifetime — whether it gets tested, how deeply, how often, and ultimately whether it gets filled or swept beyond. It runs alo
Fibonacci Pilot Pro Overview The EA functions as a comprehensive, panel-driven Fibonacci trading ecosystem designed to bridge the gap between manual chart analysis and fully automated algorithmic execution. Dual Execution Modes: It operates as both a visual trade assistant for manual trading and a fully autonomous robot. In manual mode, you plot Point A and Point B on the chart to instantly visualize risk/reward zones and limit entries before executing. In auto mode, it scans for market struc
Filter:
No reviews
Reply to review