Tick Data Exporter

The primary function of this script, Tick Data Exporter, is to efficiently extract historical tick data.
Tick data represents the most granular level of market data, capturing every single price change.
The script downloads this data from a broker and formats it into CSV files for external quantitative analysis.

Five things tick data shows that bars permanently hide:
  1. Spread microstructure: Bars give you one spread number per period (typically the spread at bar close). Ticks show you the spread literally tick-by-tick. The widening seconds before high-impact news is invisible in bars; in ticks it's a billboard. Same for the "spread blink" some brokers do at session opens — they widen for 200ms and tighten back. Bar data smears it out.
  2. Quote frequency as a volatility proxy: When a market is "thinking," ticks come in slowly — maybe 1 to 2 per second. When it's reactive, you get 30 to 50 per second. Tick density itself, separate from price movement, is a real signal. Some professional traders watch quote frequency more than they watch price. A sudden burst of ticks without much price change can precede a directional move by tens of seconds.
  3. Bid/ask asymmetry: In tick exports you see flag patterns like a BID-only update followed milliseconds later by an ASK-only update. That pattern reveals which side of the market is leading. Sustained bid-leading versus ask-leading often precedes directional moves by several seconds. Bar data has no concept of this — bars only show you the resulting price, not the order in which the bids and asks moved.
  4. True touch quality: When you ask "did price touch this level?" using bar data, you check bar high or bar low. Tick data tells you not just whether, but how many times, for how long, and at what spread. Three completely different texture-of-touch readings for the same level.
  5. Sub-bar reversal mapping: A bar that opens at the low and closes at the high (a strong bull bar) tells you nothing about the *path*. Did price spike to the high in the first 30 seconds and chop sideways? Did it grind up steadily? Did it spike, retrace 90%, then break out? These three patterns produce nearly identical bars and very different next-bar behavior. Tick data reconstructs the path.

When NOT to use tick data:
Tick data has costs that bar data doesn't: file size, fetch time, and analytical complexity. The tool isn't right for every question. Use bar data instead when:
  • You're studying multi-day or multi-week trends. Bar data on the right TF is plenty.
  • You only care about open/high/low/close values. Bars deliver these directly; ticks would require aggregation.
  • You're correlating multiple symbols. The OHLC exporter's wide format is far better for this. Tick timestamps don't align across symbols.
  • You're working in Excel without much patience.
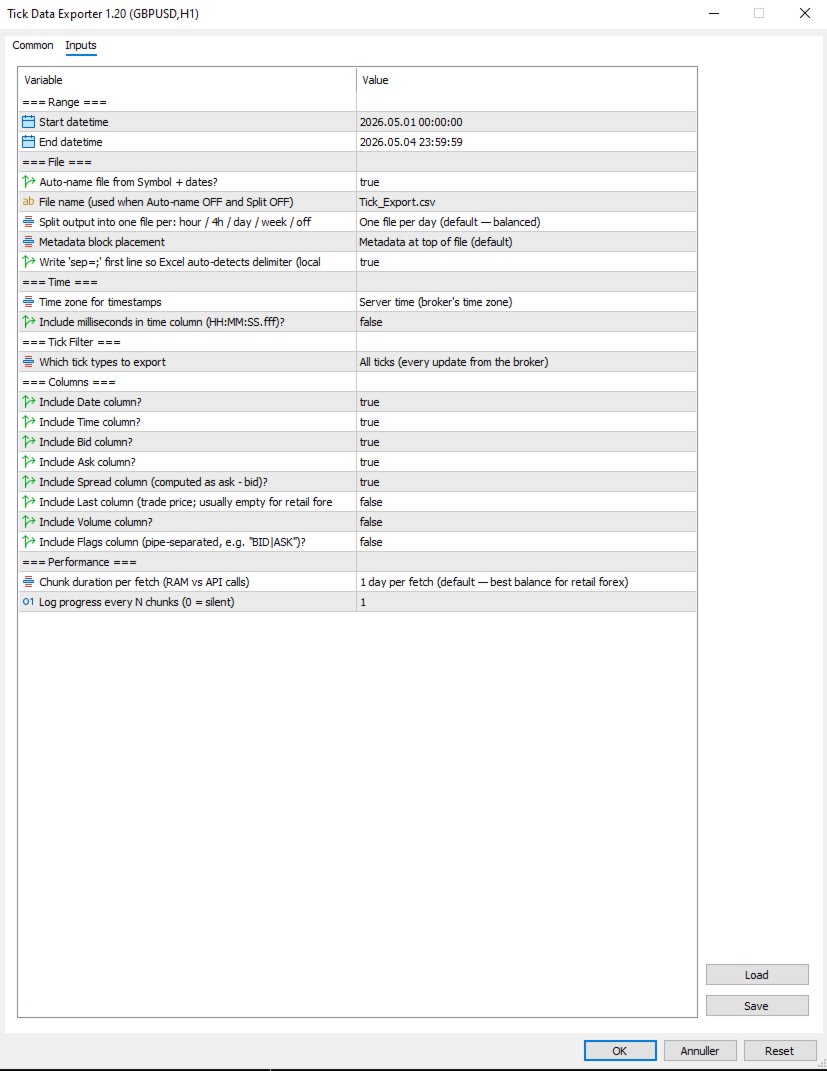
Settings:

=== Range ===
  1. Start datetime: First moment to fetch ticks for, in server (broker) time. Inclusive.
  2. End datetime: Last moment to fetch ticks for, in server (broker) time. Exclusive of the very last second by convention. Must be after Start datetime. Always specify a date range.

=== File ===
  1. Auto-name file from Symbol + dates?: When true, output filenames are derived from symbol, date(s), and split granularity (e.g. EURUSD_TICKS_2026-05-04_13h.csv). When false, uses File name (used when Auto-name OFF and Split OFF), with date/hour suffixes appended for split-mode exports to avoid collisions.
  2. File name (used when Auto-name OFF and Split OFF): Manual filename (used only when Auto-name file from Symbol + dates? is false). For split exports, the relevant date or date_HHh suffix is inserted before the .csv extension automatically.
  3. Split output into one file per: hour / 4h / day / week / off: How to slice the export into separate files. Off = single file for whole range. 1H/4H = one file per hour or 4-hour window (good for news-window analysis). 1D = one per day (default, balanced). 1W = one file per week (long-range exports). Boundaries align to natural clock units.
  4. Metadata block placement: OFF, TOP, or BOTTOM. Top is default; choose BOTTOM if you plan to use Excel's freeze-top-row feature on the data.
  5. Write 'sep=;' first line so Excel auto-detects delimiter (locale-safe)?: When true, writes 'sep=;' as the very first line of the file. Excel reads this hint and automatically uses semicolon as the delimiter for that file regardless of the OS regional setting. Recommended on European locales (Danish, German, French) where Excel's default delimiter is comma.

=== Time ===
  1. Time zone for timestamps: Time zone for the Date and Time columns. Server = broker's time zone. UTC = GMT/no offset (best for cross-system data analysis). Local PC = your machine's time zone.
  2. Include milliseconds in time column (HH:MM:SS.fff)?: When true, the Time column shows HH:MM:SS.fff with millisecond precision. Important for high-frequency tick data where multiple ticks per second are common. Adds a few characters per row but doesn't significantly increase file size. Recommended ON for serious analysis.

=== Tick Filter ===
  1. Which tick types to export: Which tick types to export. ALL = everything the broker sent. BIDASK = only ticks that updated bid or ask (skips pure-volume ticks; reduces file size slightly). TRADES = only ticks marking actual trades (TICK_FLAG_LAST). Trades-only is rare-to-empty for retail forex but populated for indices, stocks, and centrally-cleared instruments.

=== Columns ===
Each column is independently toggleable. Disabling unused columns shrinks file size, sometimes meaningfully. For example, disabling Volume and Last on retail forex saves about 5% per row.

  1. Include Date column?: Include the Date column (ISO YYYY-MM-DD). Disable only if all your ticks are in one day and you don't need the date.
  2. Include Time column?: Include the Time column. Format depends on "Include milliseconds in time column (HH:MM:SS.fff)?".
  3. Include Bid column?: Include the bid price at the time of the tick.
  4. Include Ask column?: Include the ask price at the time of the tick.
  5. Include Spread column (computed as ask - bid)?: Include the spread (computed as ask - bid, rounded to symbol digits). Recommended ON; spread microstructure is one of the main reasons to use tick data.
  6. Include Last column (trade price; usually empty for retail forex)?: Include the last trade price. Empty for most retail forex (no actual trades reported); useful for indices/stocks. Default off because it's mostly empty.
  7. Include Volume column?: Include trade volume. Same caveat as Last — mostly zero for retail forex. Default off.
  8. Include Flags column (pipe-separated, e.g. "BID|ASK")?: Include the decoded tick flags column showing what changed in this tick (e.g. BID, ASK, BID|ASK, BID|ASK|LAST, BUY, SELL). Pipe-separated. Default off because most analyses don't need it; turn on for advanced microstructure work.

=== Performance ===
  1. Chunk duration per fetch (RAM vs API calls): Time window per API call. Smaller chunks use less RAM during fetch but require more API calls. Larger chunks use more RAM but finish faster. 1D is the right default for most retail forex use; bump to 1W if you have a beefy machine and large exports, drop to 4H or 1H if you're hitting memory issues.
  2. Log progress every N chunks (0 = silent): Log a progress line every N chunks. Set to 0 to silence intermediate progress (only the final 'mission accomplished' line will appear). Set to 5 or 10 to reduce spam on long exports.

Note that Chunk duration per fetch (RAM vs API calls) and Split output into one file per: hour / 4h / day / week / off are independent settings. Chunk size affects how the script *fetches* data internally; split granularity affects how the *output is sliced into files*. They can be set differently — for example, fetching in 1D chunks (efficient) but writing into 1H files (granular for analysis).


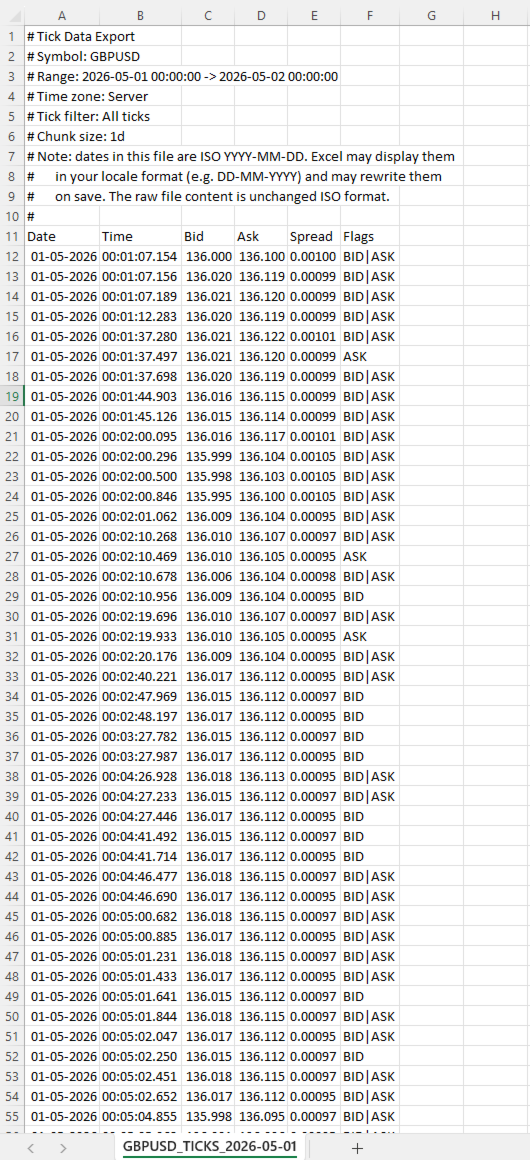
=== .CSV File Column reference ===
  • Date: ISO YYYY-MM-DD Date of the tick in the chosen time zone. ISO format ensures unambiguous interpretation regardless of locale.
  • Time: HH:MM:SS or HH:MM:SS.fff Time of the tick in the chosen time zone. Format depends on Include milliseconds in time column (HH:MM:SS.fff)?.
  • Bid: Bid price at the time of this tick, formatted to the symbol's digit count.
  • Ask: Ask price at the time of this tick.
  • Spread: Computed as ask - bid, rounded to the symbol's digit count. This is the actual spread at this tick, not a bar-aggregated value.
  • Last: Last trade price. Empty (or 0) when the broker didn't report a trade with this tick.
  • Volume: Trade volume. Empty for most retail forex.
  • Flags: Pipe-separated tokens Decoded tick flags. Tokens: BID (bid changed), ASK (ask changed), LAST (trade), VOL (volume update), BUY/SELL (trade direction). A single tick can have multiple flags, e.g. BID|ASK|LAST.


=== Important note about dates and Excel ===
Dates in the file are written in ISO YYYY-MM-DD format. Most tools (pandas, Python, R, plain text editors) read them exactly as written. Excel does not.
When you open a tick file in Excel, the Date column will be displayed in your locale's date format (DD-MM-YYYY in most of Europe, MM/DD/YYYY in the US). Excel auto-parses the ISO dates and re-displays them. If you save the file from Excel, Excel will also rewrite the dates to its locale format inside the file itself, mutating your original ISO data.
This is documented in the file's metadata block as a reminder. Two strategies to handle it:
Treat Excel as a viewer only, never save changes. Open, inspect, close without saving.
Read the file in pandas or Python instead of Excel. The ISO format works perfectly there.
If you specifically need Excel to leave dates alone, format the Date column as Text via the Data > From Text/CSV import wizard.


=== Tips & Examples ===
Choosing the right split granularity. The Split output into one file per: hour / 4h / day / week / off setting profoundly affects how the data is structured for analysis. Choosing the right value is about matching file granularity to your analysis question.
  • SPLIT OFF Single file When you want one continuous tick stream for an entire range and intend to use pandas or Python to filter. Avoid for ranges over 1 day — files get too large to navigate.
  • SPLIT 1H Hourly files Best for news-window analysis. FOMC, NFP, CPI: export the 4-6 hours around the event with SPLIT_1H, and you have one file per hour ready for separate analysis. Each hour-file is small enough to open in Excel.
  • SPLIT 4H Session-aligned files Best for session-based analysis. Files align to 00/04/08/12/16/20 boundaries which roughly correspond to Asian/early-European/London/lunch/NY/NY-late session windows. A week's worth is 42 files but each one is tractable.
  • SPLIT 1D Daily files (default) The general-purpose default. One day per file is a natural unit, files are 5-15 MB on retail forex, and pandas reads them quickly.
  • SPLIT 1W Weekly files Long-range exports where weekly granularity is enough. A month-long export becomes 4-5 files instead of 30.

Example 1: Studying the FOMC announcement
FOMC rate decisions land at 19:00 server time on a specific Wednesday. You want to study what the spread, tick density, and price action looked like in the 2 hours leading up and 2 hours following the announcement.
Settings:
  • Start datetime = D'2026.05.07 17:00:00' // 2 hours before FOMC
  • End datetime    = D'2026.05.07 21:00:00'    // 2 hours after
  • Auto-name file from Symbol + dates?  = true
  • Split output into one file per: hour / 4h / day / week / off    = SPLIT_1H                        // hourly files for granular analysis
  • Time zone for timestamps  = EXPORT_TIME_SERVER
  • Include milliseconds in time column (HH:MM:SS.fff)? = true                          // sub-second sequence matters around news
  • Which tick types to export = TICK_ALL
  • Include Flags column (pipe-separated, e.g. "BID|ASK")? = true                      // helps see bid-leading vs ask-leading patterns
  • Chunk duration per fetch (RAM vs API calls) = CHUNK_1D                      // single fetch fine for 4 hours
Results: four files named EURUSD_TICKS_2026-05-07_17h.csv through _20h.csv. Each file is small (1-5 MB even with the 19h announcement file probably being the largest). You can open the announcement-hour file in Excel directly to inspect, or load all four in pandas to analyze tick density vs. price change.
What to look for: spread typically widens 30-60 seconds before the announcement (broker preparing for volatility), spikes to 5-10x normal at the moment of release, then tightens back over the next 5-15 minutes. Tick density goes from 1-2 per second pre-news to 50-100 per second in the first 30 seconds post-release.

Example 2: Comparing session-open behavior across a week
You want to see whether the spread blink at the London 08:00 open behaves consistently across all five trading days of a week.
Settings:
  • Start datetime = D'2026.05.04 07:30:00'    // Monday, 30 min before London
  • End datetime    = D'2026.05.08 09:00:00'    // Friday, 1 hour after
  • Auto-name file from Symbol + dates?  = true
  • Split output into one file per: hour / 4h / day / week / off    = SPLIT_1D                  // one file per trading day
  • Time zone for timestamps  = EXPORT_TIME_UTC            // UTC since session times are commonly stated in UTC
  • Include milliseconds in time column (HH:MM:SS.fff)? = true
  • Which tick types to export = TICK_ALL
  • Chunk duration per fetch (RAM vs API calls) = CHUNK_1D
Results: five files, one per day. In each file, filter to roughly 06:30-08:00 UTC (London 07:00-09:00 wall clock). Compare spread evolution across the five days side by side.
What to look for: Mondays often have wider opens than midweek (weekend gap effects). Fridays often have tighter post-open spread (book is winding down).

Example 3: Detecting unusual tick density
You want to flag minutes where tick density was unusually high, as a signal that something interesting may have happened.
Settings:
  • Start datetime = D'2026.05.04 00:00:00'
  • End datetime    = D'2026.05.04 23:59:59'    // single full day
  • Auto-name file from Symbol + dates?  = true
  • Split output into one file per: hour / 4h / day / week / off    = SPLIT_OFF                  // single file for the whole day
  • Time zone for timestamps  = EXPORT_TIME_SERVER
  • Include milliseconds in time column (HH:MM:SS.fff)? = true
  • Which tick types to export = TICK_BIDASK              // exclude pure-volume noise
  • Include Flags column (pipe-separated, e.g. "BID|ASK")? = false                  // not needed for density analysis
  • Chunk duration per fetch (RAM vs API calls) = CHUNK_1D
Results: one file containing the full day. In pandas, group by minute and count rows. Sort descending by count. The top 10 minutes are your high-density periods. Cross-reference timestamps against your economic calendar.
This is a powerful diagnostic technique: tick density highs often precede price moves by tens of seconds, and they correlate with events that don't always make the calendar (large institutional orders, broker-side liquidity shifts, sympathetic moves from correlated markets).

Example 4: Spread cost analysis for a Backtest
You're running a Backtest at a tight stop-loss (5-8 pips) and worried that the bar-aggregated spread reading is hiding intra-bar widening that would have stopped you out. You want the actual spread at every tick during the period.
Settings:
  • Start datetime = D'2026.04.01 00:00:00'
  • End datetime    = D'2026.04.30 23:59:59'
  • Auto-name file from Symbol + dates?  = true
  • Split output into one file per: hour / 4h / day / week / off    = SPLIT_1D                  // one file per day, manageable chunks
  • Time zone for timestamps  = EXPORT_TIME_SERVER
  • Include milliseconds in time column (HH:MM:SS.fff)? = false                      // for cost analysis, second precision is fine
  • Which tick types to export = TICK_BIDASK
  • Include Bid column?    = false                  // you only need spread, not price
  • Include Ask column?    = false
  • Include Spread column (computed as ask - bid)? = true
  • Include Flags column (pipe-separated, e.g. "BID|ASK")?  = false
  • Chunk duration per fetch (RAM vs API calls) = CHUNK_1D
Results: 30 daily files, each containing only Date, Time, and Spread columns. Total volume ~50-150 MB for the month. In pandas, you can compute the empirical spread distribution: mean, p95, p99, max. Compare to the constant spread your Backtest assumed. Adjust your stop loss accordingly, or accept that some trades that worked in Backtest would have been stopped on actual spread spikes.

Example 5: Reconstructing a flash event
Something unusual happened on a chart at 14:32 — a sudden 15-pip spike followed by an immediate retrace. Bar data shows the move but not the path. You want millisecond-level detail of what actually happened.
Settings:
  • Start datetime = D'2026.05.04 14:30:00'    // 2 minutes before
  • End datetime    = D'2026.05.04 14:35:00'    // 3 minutes after
  • Auto-name file from Symbol + dates?  = true
  • Split output into one file per: hour / 4h / day / week / off    = SPLIT_OFF                  // 5 minutes is one tiny file
  • Time zone for timestamps  = EXPORT_TIME_SERVER
  • Include milliseconds in time column (HH:MM:SS.fff)? = true                      // critical for reconstructing path
  • Which tick types to export = TICK_ALL
  • Include Flags column (pipe-separated, e.g. "BID|ASK")? = true                    // see bid vs ask leading
  • Chunk duration per fetch (RAM vs API calls) = CHUNK_1H
Results: one small file with potentially 5,000-15,000 ticks depending on event severity. Open in Excel directly. Plot bid and ask over time. The exact sequence of the spike — how many ticks at the spike high, the spread when it spiked, whether bid moved first or ask moved first — tells you whether this was a stop-hunt, a fat-finger order, a news leak, or genuine liquidity event.
This kind of post-mortem is the single best use case for tick data. Bar data shows the wound; tick data shows how it was inflicted.

推荐产品
CChart
Rong Bin Su
在外汇和金融市场中,快速反应和精准的决策至关重要。然而,常规的 MetaTrader 5 终端最低只支持 1 分钟图表,限制了交易者对市场波动的敏感度。为了解决这一问题,我们推出了全新的 秒级图表 K 线指标 ,让您在副图中轻松查看和分析 1 秒至 30 秒的市场动态。 主要功能 支持多种秒级周期 :该指标允许您选择以下周期,满足不同交易策略的需求: S1 : 1 秒 S2 : 2 秒 S3 : 3 秒 S4 : 4 秒 S5 : 5 秒 S10 : 10 秒 S15 : 15 秒 S20 : 20 秒 S30 : 30 秒 实时更新 :秒级图表将实时更新,确保您在每一刻都能获取到最新的市场信息,帮助您做出及时的交易决策。 用户友好的界面 :该指标在副图中显示,直观易用,您可以轻松切换不同的时间周期,快速分析市场走势。 适用人群 短线交易者 :适合高频交易和短线策略的交易者,通过秒级图表捕捉瞬息万变的市场机会。 技术分析师 :为技术分析提供更细致的数据支持,帮助您识别潜在的买入和卖出信号。 如何使用 将指标添加到您的图表上。 选择您希望观察的秒级时间周期。 实时监控市场动向,利用丰富
SmartSetup Bot Is an advanced trading tool that combines the flexibility of manual configurations with the power of semi-automated features. It automatically generates graphical objects, displaying critical zones such as support and resistance levels, stop loss and take profit areas, and other essential indicators. SmartSetup Bot provides clear and precise visualization of your trading parameters, facilitating informed decision-making. This bot is designed for traders who value manual control bu
FREE
Donchian Breakout And Rsi
Mattia Impicciatore
4.5 (2)
概述 本指标是经典 Donchian 通道 的增强版,增加了多种实用的交易功能。 除了标准的三条线(最高、最低和中线),系统能够检测 突破 ,并在图表上用箭头进行可视化标记,同时只显示 与当前趋势方向相反的那条线 ,让图表更加简洁。 功能包括: 可视化信号 :突破时在图表上绘制彩色箭头 自动通知 :弹窗、Push 推送和 Email 邮件 RSI 过滤 :根据市场相对强弱验证信号 个性化设置 :颜色、线条粗细、箭头符号、RSI 阈值等 工作原理 Donchian 通道计算: 上轨线 :最近 N 根已收盘 K 线的最高价 下轨线 :最近 N 根已收盘 K 线的最低价 中线 :最高价和最低价的平均值 看涨突破 :收盘价高于上轨线 看跌突破 :收盘价低于下轨线 指标会: 绘制三条 Donchian 通道线 仅在 方向变化后的首次突破 绘制箭头 隐藏顺应趋势方向的那条线(上涨趋势: 只显示红色下轨线;下跌趋势: 只显示绿色上轨线) 可选用 RSI 过滤突破信号,减少虚假突破 支持实时发送通知 参数说明 Donchian 通道设置 indPeriod :计算通道高低点的已收盘 K 线数量 Lin
FREE
It has never been so easy to manage the risk of your account until now, this tool will allow you to have full control of your capital and manage your entries in the synthetic index derivative markets, in an easy, practical and safe way. The available input and configuration parameters are as follows :  RISK MANAGEMENT 1. Value of your account: Here as its name says you will place the value corresponding to the size of your account, for example if your account is 150 dollars the corresponding val
Pin Bars MT5
Yury Emeliyanov
Main purpose:   "Pin Bars"   is designed to automatically detect pin bars on financial market charts. A pin bar is a candle with a characteristic body and a long tail, which can signal a trend reversal or correction. How it works:   The indicator analyzes each candle on the chart, determining the size of the body, tail and nose of the candle. When a pin bar corresponding to predefined parameters is detected, the indicator marks it on the chart with an up or down arrow, depending on the directi
FREE
The Simple Manual Trading Panel (v2.11) Is a professional trade management tool designed with a clean, movable UI to streamline manual execution and automated exit strategies. Core Features Dynamic Visual Interface: A movable GUI panel that provides real-time information including a bar countdown timer, live spread, and advanced volume analysis. Flexible Lot Size setting, with 2 decimals (If broker supports it). Multi-Stage Take Profit: Supports three distinct Take Profit (TP) levels in either
LT Ajuste Diario
Thiago Duarte
3.67 (3)
This is a tool in script type. It shows in chart the actual and/or past day ajust price in a horizontal line. The symbol name and it expiration must be set up according to the actual parameters. The lines appearance are fully customizable. You need to authorize the B3 url on MT5 configurations:  www2.bmf.com.br. You need this to the tool can work. This is a tool for brazilian B3 market only!
FREE
MT5 to Telegram & Discord Notifier MT5 to Telegram & Discord Notifier is a lightweight and practical notification utility for MetaTrader 5 that automatically sends real-time trade updates to your Telegram and Discord channels. It is designed for traders who want to stay informed about trading activity without constantly watching the terminal. Once connected, the notifier delivers instant alerts whenever a position is opened or closed, helping you monitor live activity, improve communication, an
FREE
风险管理器 – MT5交易助手 概述 风险管理器 – 交易助手是一款先进的工具,旨在增强交易执行、自动化风险管理,并优化交易绩效。该工具集成了动态手数计算、隐藏止损保护、交易自动化以及实时交易日志,帮助交易者在市场中占据优势。 凭借直观的界面和自动化功能,风险管理器非常适合剥头皮交易者、日内交易者和波段交易者,他们希望在有效执行交易的同时控制风险。 主要功能 交易执行与订单管理 智能订单执行面板   – 快速下单,包括市价单、挂单和狙击单 动态手数计算   – 根据风险百分比或预设金额自动调整手数 部分止盈(TP)和止损(SL)   – 系统化地锁定利润并最小化损失 风险管理与保护 隐藏止损   – 防止经纪商检测和针对止损价格 虚假止损   – 保护交易者免受止损狩猎和价格操纵影响 基于点差的执行   – 仅在点差处于设定阈值内时执行交易 K线收盘退出策略   – 根据K线收盘条件自动关闭交易 交易优化与策略分析 K线收盘倒计时   – 显示当前K线剩余时间,帮助精准交易 自动截图捕捉   – 记录交易执行截图,便于后续分析和日志记录 集成交易日志   – 所有交易数据和截图本地
Introduction: The RosMaFin Trading Panel is not just a standard order execution tool. It is a comprehensive, professional assistant designed for manual and price-action traders who want to save time, manage risk with mathematical precision, and maintain full market awareness. Say goodbye to manual lot size calculations and tedious Stop Loss adjustments. This panel streamlines your entire trading workflow from analysis to trade exit. KEY FEATURES & BENEFITS: Advanced Risk Management & Exec
FREE
Kronos is a multi-timer that displays local time, server time and the countdown of the current period. The programme is multilingual, with a choice of English, Italian and Spanish Language selectables in input. Available in four colours and with the choise of five types of font to be used. Like any other programme we have created, the graphic interface is developed to be non-invasive and intuitive. At start-up, the three windows that make up the graphic interface of Kronos are closed on the left
Smart FVG Stats
- Md Rashidul Hasan
5 (1)
The  Smart FVG Statistics Indicator  is a powerful MetaTrader 5 tool designed to automatically identify, track, and analyze Fair Value Gaps (FVGs) on your charts. Love it? Hate it? Let me know in a review! Feature requests and ideas for new tools are highly appreciated. :) Try "The AUDCAD Trader": https://www.mql5.com/en/market/product/151841 Key Features Advanced  Fair Value Gap  Detection Automatic Identification : Automatically scans for both bullish and bearish FVGs across specified histo
FREE
High Low Open Close
Alexandre Borela
4.98 (44)
如果你象这个项目一样,就有5个饥饿审查。 这项指标采用了既定价格的公开、高、低价和关闭价格 可以对特定时间区加以调整。 许多机构和专业人士都认为这些是重要的。 贸易商可以为你了解他们可能更进一步的地点, 积极。 现有期间为: 前一日。 前一星期。 曾任Month。 曾任。 前一年。 或: 目前日。 目前周。 目前 Month。 目前配额。 今年。
FREE
Telegram to MT5 Coppy
Sergey Batudayev
5 (8)
Telegram 到 MT5: 终极信号复制解决方案 使用 Telegram 到 MT5 简化您的交易,这款现代化工具可直接从 Telegram 频道和聊天室复制交易信号到您的 MetaTrader 5 平台,无需 DLL 文件。这款强大的解决方案可确保精准的信号执行、丰富的自定义选项,节省时间并提高您的效率。 [ Instructions and DEMO ] 主要特点 直接 Telegram API 集成 通过电话号码和安全码进行身份验证。 通过用户友好的 EXE 桥轻松管理聊天 ID。 添加、删除和刷新多个频道/聊天以同时复制信号。 使用高级过滤器进行信号解析 跳过包含异常词(例如“报告”、“结果”)的不需要的信号。 支持灵活的 SL 和 TP 格式:价格、点数或点数。 自动计算指定点而不是价格的信号的切入点。 订单定制和灵活性 使用多种模式配置订单大小:固定手数、动态手数(% 风险)或特定符号手数。 使用信号数据或自定义参数调整 SL/TP。 设置滑点限制、挂单到期时间和重试参数,以实现无缝执行。 综合符号管理 排除特定符号或映射到特定经纪人的符号。 自定义信号和经纪商符号之间
ORB Range Architect:指标详尽说明  ORB Range Architect 是一款专业的交易时段范围和扩展指标,专为希望通过时段、日线和周线价格周期获得更整洁的结构、更清晰的突破区域和更智能的交易背景的交易者而设计。 ORB Range Architect 旨在帮助交易者映射图表上最重要的开盘和参考范围,从这些范围投射结构化的扩展水平,并跟踪已完成时段、前一交易日和前一周的高/低点订单块 (Order Block) 区域。 video:   https://youtu.be/rctOboVWcf8?si=d-sQELqP-UVmN2s2 该工具专为希望在保持大量图表信息的同时,拥有干净的机构级图表工作流程且无杂乱感的交易者量身定制。 ORB Range Architect 的功能 ORB Range Architect 根据您选择的周期构建测量范围,然后使用可配置的扩展水平将该范围延伸至未来。 您可以利用三种不同的周期模式: 时段周期 (Session Cycle) — 测量交易时段的开盘范围,并投射该时段的扩展结构。 日线周期 (Daily Cycl
StealthTrade Commander 是一款高级可视化交易面板和风险管理工具,专为手动交易者、剥头皮交易者(Scalpers)和自营交易公司(Prop-Firm)挑战者设计。 该工具可帮助您直接在图表上可视化执行交易,向经纪商隐藏您的止损(SL)和止盈(TP)水平,并严格控制您的每日回撤——这是通过和保留 Prop-Firm 资金账户的关键功能。 主要功能: Risk Guardian(自营交易保护器) 每日最大亏损限制: 如果您的每日回撤达到指定限制,自动平仓所有交易并锁定面板。 每日利润目标: 一旦达到您的每日目标,即平仓所有头寸以锁定利润。 精准手数计算: 根据您的可视化止损和预设风险(%、$ 或账户净值)计算确切的交易手数。 Stealth & Tactical Engine(隐身与战术引擎) 隐身模式: 向经纪商隐藏真实的 SL 和 TP 水平。面板在内部管理它们,并在价格穿过您的虚拟线时精准平仓。 幽灵入场(虚拟挂单): 放置隐形挂单,仅在价格触及您的线条时触发。 OCO 订单(选择性委托单): 突破交易的完美选择。当一个挂单被触发时,相反的挂单将自动删除。 价格磁
FREE
Trade Manager DashPlus
Henry Lyubomir Wallace
5 (13)
DashPlus 是一款先进的交易管理工具,旨在提升您在 MetaTrader 5 平台上的交易效率和效果。它提供一整套功能,包括风险计算、订单管理、先进的网格系统、基于图表的工具和绩效分析。 主要功能 1. 恢复网格 实施一个平均和灵活的网格系统,以在不利的市场条件下管理交易。 允许设置战略性进出点,以优化交易恢复。 2. 叠加网格 通过在强劲的市场波动中增加仓位,最大化有利交易的潜在回报。 帮助您通过扩展获利交易来利用趋势市场。 3. 盈亏线 在图表上直接提供潜在利润和损失场景的可视化表示。 调整设置并拖动盈亏线,以在执行之前评估各种交易结果。 4. 篮子模式 简化同一交易品种的多仓位管理,将它们合并为一个聚合仓位。 基于平均价格,便于监控和应用止损、止盈以及其他订单修改。 5. 图表上的新闻 将预定的经济新闻事件整合到您的交易图表中。 帮助您随时掌握可能影响市场波动的即将发生的事件,从而更好地规划交易。 6. 警报 设置基于时间或价格的警报,通知会显示在 MT5 中,或通过 MT5 应用发送到您的移动设备。 对监控关键价格水平或重要的交易时段非常有用。 7. 绩效统计 提供详细的
Algo Scalper EA
Tshepo Michael Motaung
Algo Scalper EA is a confluence day trading robot using market orders and it trades during Trading Sessions. The EA exercise consistency and risk management, it has 2 entry signals produced from  Moving Averages(90 & 120) to harvest the most out of the trending market (on automatic mode). It is capable of allowing you to trade any symbol you want and during the time you want. Profits can only be secured by take profit level. Low spread is highly recommended for this EA, and you will see signific
CosmiCLab FIBO
Kirils Subins
CosmiCLab SMC FIBO CosmiCLab SMC FIBO is a professional trading indicator designed for traders who use Smart Money Concepts (SMC), market structure analysis and Fibonacci retracement levels. The indicator automatically detects market swings and builds Fibonacci levels based on the latest impulse movement. It also identifies market structure changes such as BOS (Break of Structure) and CHOCH (Change of Character), helping traders understand the current market direction. CosmiCLab SMC FIBO also pr
IMPORTANT NOTE: This is a professional Trade Management Utility and on-chart assistant. It is NOT an automated trading robot. It does not open trades on its own. The UltraFast Trade Manager MT5 is the ultimate execution and risk-management suite designed to give you absolute control over your manual and algorithmic trades. When managing multiple positions, calculating complex net break-even points, or constantly monitoring the economic calendar, hesitation can lead to costly mistakes. This utili
FREE
PropFolio Command Manager Pro PropFolio Command Manager Pro is an advanced, multi-symbol execution terminal designed to automate your custom arrow indicators. Simply enter the name of your arrow indicator into the settings, and the Command Manager will monitor up to 30 currency pairs, indices, or metals simultaneously from a single chart. When your indicator generates a signal, the EA verifies the trend using the built-in Higher Timeframe (HTF) algorithm, checks the live spread, and manages the
Friend of the trend
Anderson De Assis
Friend of the Trend: Your Trend Tracker Master the market with Friend of the Trend , the indicator that simplifies trend analysis and helps you identify the best moments to buy, sell, or wait. With an intuitive and visually striking design, Friend of the Trend analyzes price movements and delivers signals through a colorful histogram: Green Bars : Signal an uptrend, indicating buying opportunities. Red Bars : Alert to a downtrend, suggesting potential selling points. Orange Bars : Represent cons
FREE
MeeKiew Easy Order Manager (MT5)   is a high-performance trading utility designed to streamline order execution and management on the MetaTrader 5 platform. Specifically optimized for use with the   MeeKiew Dynamic MTF Pivot (MT5)   indicator, this tool allows traders to react to market levels with speed and precision. While MT5 can sometimes feel slower in manual execution, this manager bridges the gap with a "One-Click" philosophy and advanced bulk management features. MeeKiew Dynamic MTF Pivo
FREE
Just $10 for six months!!!. This will draw Supply & Demand zones just by clicking on a candle. It can also draw a 50% line on the zone. https://youtu.be/XeO_x7cpx8g As a drawing tool, it is not active all the time after adding it to the chart. Activate by pressing 's' twice on the keyboard within a second. If activated but then decided not to draw, deactivate by pressing 's' once.  Box color depends if candle is above or below current price. Features: Draw the box up to the last current candl
QuantumAlert Stoch Navigator is a free indicator available for MT4/MT5 platforms, its work is to provide "alerts" when the market is inside "overbought and oversold" regions in the form of "buy or sell" signals. This indicator comes with many customization options mentioned in the parameter section below, user can customise these parameters as needful. Join our   MQL5 group , where we share important news and updates. You are also welcome to join our private channel as well, contact me for the p
FREE
Rainbow MT5
Jamal El Alama
4 (1)
Description : Rainbow MT5 is a technical indicator based on Moving Average with period 34 and very easy to use. When price crosses above MA and MA changes color to green, then this is a signal to buy. When price crosses below MA and MA changes color to red, then this is a signal to sell. The Expert advisor ( Rainbow EA MT5 ) based on Rainbow MT5 indicator is now available here . MT4 version is available here .
FREE
Object Synchronizer MT5 : Better focus/analysis of the price chart in many timeframes. Are you bored to save and load template many times for the same symbol for many chart timeframes? Here is the alternative. With this indicator, you enjoy creating objects across many charts, you can modify the same object in any chart, you can delete the same object in any chart. All objects you created/modified are always synchronized across all chart windows (with the same symbol). Save your time, you can fo
FlatBreakout MT5
Aleksei Vorontsov
FlatBreakout MT5 (Free Version) Flat Range Detector and Breakout Panel for MT5 — GBPUSD Only FlatBreakout MT5   is the free version of the professional FlatBreakoutPro MT5 indicator, specially designed for flat (range) detection and breakout signals on the   GBPUSD   pair only. Perfect for traders who want to experience the unique fractal logic of FlatBreakout MT5 and test breakout signals on a live market without limitations. Who Is This Product For? For traders who prefer to trade breakout of
FREE
KT Forex Trade Manager EA MT5
KEENBASE SOFTWARE SOLUTIONS
KT Trade Manager 是一款强大的交易工具,能够提升交易执行与持仓管理的效率。通过简洁易用的界面,交易者可以轻松监控并控制他们的交易。 这是一套全面的交易解决方案,涵盖了交易中的多个关键环节,包括风险控制与仓位管理。将这些核心要素整合在一起,帮助交易者更有效地应对金融市场,做出明智决策并优化交易策略。 随着全球市场不断发展,尤其是在外汇市场中,高效的交易工具对新手和专业交易者来说都变得越来越重要。这款工具已彻底革新了外汇交易方式。 这款功能强大的交易辅助工具为交易者提供了无与伦比的进场和持仓管理支持,助您将交易表现提升到新高度。 功能特点 清晰且用户友好的操作界面。 轻松执行市价订单与挂单。 一键设置移动止损、自动保本、部分平仓。 图表上显示入场、止损和止盈的交易线。 可通过控制面板按钮或图表线管理止损和止盈。 支持固定和自动仓位计算,按每笔交易的风险百分比设定。 一键关闭所有盈利或亏损的订单。 一键批量下挂单或删除所有挂单。 适用于外汇、加密货币、股票、期货、大宗商品、指数和贵金属,兼容 2-3-4 位定价格式。 使用 magic number 机制,避免与其他 EA
Forex 4up MT5
Volodymyr Hrybachov
您想在電報頻道中交易和發布您的信號嗎?那麼這個實用程序是給你的。 - 在您的終端交易 - 向您的電報頻道發布交易 您的客戶會很高興: - 每天 5 個信號 - 漂亮的信號設計 定制 服務 -> 設置 -> EA 交易 -> 允許以下 URL 的 WebRequest: https://api.telegram.org 在 Telegram 中,轉到 @BotFather 並創建一個機器人 複製機器人的令牌並將其輸入到顧問的參數中 創建您的頻道並將其設為公開 將您創建的機器人添加到您的頻道並使其成為管理員 點擊鏈接: https://api.telegram.org/bot [TOKEN_BOTA]/sendMessage?chat_id=@[USERNAME_KANALA]&text=TEST。將括號 [] 替換為您自己的值。就我而言 https://api.telegram.org/bot1285429093:AAERdfBAsdy5Vq8FotJWQZxLejXR8rRiZJ4/sendMessage?chat_id=@moneystrategy_mql&amp ;
该产品的买家也购买
Trade Assistant MT5
Evgeniy Kravchenko
4.42 (209)
它有助于计算每笔交易的风险,容易安装新的订单,具有部分关闭功能的订单管理, 7 种类型的追踪止损和其他有用的功能。   附加材料和说明 安装说明   -   应用程序说明   -   模拟账户应用程序的试用版 线条功能  - 在图表上显示开仓线、止损线、止盈线。 有了这个功能,就可以很容易地设置一个新的订单,并在开仓前看到它的附加特性。   风险管理  - 风险计算功能在考虑到设定的风险和止损单的大小的情况下,计算新订单的成交量。它允许你设置任何大小的止损,同时观察设定的风险。 批量计算按钮 - 启用 / 禁用风险计算。 在 " 风险 " 一栏中设置必要的风险值,从 0 到 100 的百分比或存款的货币。 在 " 设置 " 选项卡上选择风险计算的变量: $ 货币, % 余额, % 资产, % 自由保证金, % 自定义, %AB 前一天, %AB 前一周, %AB 前一个月。   R/TP 和 R/SL - 设置止盈和止损的关系。 这允许你设置相对于损失的利润大小。 例如, 1 : 1 - 这决定了 TP = SL 的大小。 2 : 1 - 这意味着 TP 是 SL 的两倍。 RR -
欢迎来到 Trade Manager EA——这是一个终极风险管理工具,旨在使交易变得更直观、精准和高效。它不仅仅是一个下单工具,而是一个用于无缝交易计划、仓位管理和风险控制的全面解决方案。不论您是新手交易员、资深交易员,还是需要快速执行的剥头皮交易员,Trade Manager EA 都可以满足您的需求,适用于外汇、指数、大宗商品、加密货币等各种市场。 借助 Trade Manager EA,复杂的计算已成过去。只需分析市场,在图表上用水平线标记入场、止损和止盈,设置您的风险水平,Trade Manager 就会立即计算出理想的头寸规模,并实时显示以点、账户货币计价的止损和止盈。每笔交易都得以轻松管理。 主要功能: 头寸规模计算器 :根据定义的风险瞬间确定交易规模。 简单的交易计划 :在图表上用可拖动的水平线直接计划交易,设置入场、止损和止盈。 实时显示 SL 和 TP :以账户货币、点或分显示止损和止盈,便于分析。 高级保护工具 盈亏平衡选项 : 基本盈亏平衡 :当您的交易达到设定水平时自动保护利润。 多级盈亏平衡 :设置多达 4 个级别以逐步保护利润。 尾随止损选项 : 基本尾随
Local Trade Copier EA MT5
Juvenille Emperor Limited
4.96 (136)
通过 Local Trade Copier EA MT5 获得非常快速的交易复制体验。它的简单1分钟设置,使您可以在同一台Windows计算机或Windows VPS上在多个MetaTrader终端之间复制交易,具有闪电般快速的复制速度,低于0.5秒。 无论您是初学者还是专业交易者, Local Trade Copier EA MT5 都提供了广泛的选项,可根据您的特定需求进行自定义。对于任何希望增加利润潜力的人来说,这都是终极解决方案。 今天就尝试一下,看看为什么它是市场上最快、最简单的贸易复印机! 提示: 您可以在您的模拟账户中下载并试用 Local Trade Copier EA MT5 模拟版: 这里 将下载的免费演示文件粘贴到您的 MT5 >> 文件 >> 打开数据文件夹 >> MQL5 >> 专家文件夹并重新启动您的终端。  免费演示版本每次可在 4 小时内发挥全部功能,仅限演示帐户。 要重置试用期,请转至 MT5 >> 工具 >> 全局变量 >> Control + A >> 删除。 请仅在非关键模拟账户上执行此操作,不要在挑战道具公司账户中执行此操作。 如果您无法
Farmed Hedge Yield Farming | All Markets (Manual - Hybrid - Semi/Automated EA) MULTI-ASSET SUPPORT Trade any asset available on your broker - Forex: Major, Minor, Exotic pairs - Crypto: BTC, ETH, XRP, SOL, BNB - Stocks: Apple, Tesla, Amazon, Google, etc. - Commodities: Gold, Silver, Oil, Gas - Indices: US30, NAS100, SPX500, DAX40 - Any CFD your broker offers VERIFIED TRADING RESULTS - Farmed Hedge Yield Axi Copy:  https://www.mql5.com/en/signals/2356376 - Farmed Hedge Yield Exn Copy:   https:/
TradePanel MT5
Alfiya Fazylova
4.87 (153)
交易面板是一款多功能交易助手。该应用包含超过50种手动交易功能,并允许您自动执行大多数交易任务。 在购买之前,您可以在演示账户上测试演示版本。下载用于演示账户的试用版应用程序: https://www.mql5.com/zh/blogs/post/762579 。 完整说明 这里 。 贸易. 只需单击一下即可执行交易操作: 打開掛單和頭寸,並自動計算風險。 一鍵打開多個訂單和頭寸。 打開訂單網格。 按組別關閉掛單和頭寸。 反轉頭寸方向(關閉買入>打開賣出,關閉賣出>打開買入)。 鎖定頭寸(通過開啟缺少的頭寸,使買入和賣出頭寸的數量相等)。 一鍵部分關閉所有頭寸。 將所有頭寸的止盈和止損設置在同一價格水平。 將所有頭寸的止損設置在盈虧平衡水平。 開倉時,可使用以下功能: 在多個訂單或倉位之間分配計算出的數量(在單擊一次時開啟多個訂單和倉位)。 在開啟訂單前在圖表上可視化交易水平。 僅在當前點差不超過設定值時才開啟倉位。 止盈和止損之間的自動比例。 虛擬止損和止盈。 自動將止損和止盈的大小增加為當前點差的大小。 基於ATR指標讀數計算止盈和止損。 設置掛單的到期日期。 為掛單設置追蹤(掛單
测试版发布 Telegram to MT5 Signal Trader 即将进入正式的 Alpha 版本。一些功能仍在开发中,您可能会遇到一些小错误。如果您遇到问题,请反馈,您的意见将帮助我们改进软件。 Telegram to MT5 Signal Trader 是一款强大的工具,能够将 Telegram 频道或群组的交易信号自动复制到您的 MetaTrader 5 账户。 支持公开和私人频道,可将多个信号提供者连接至一个或多个 MT5 账户。软件优化、高效、稳定,精准控制每笔复制交易。 界面简洁,仪表盘美观,图表交互性佳,导航直观。您可以管理多个信号账户,自定义每个提供者的设置,并实时监控所有操作。 系统需求 由于 MQL 限制,EA 需要配合 PC 端应用与 Telegram 通信。 安装程序可通过官方 安装指南 获取。 核心功能 多提供者支持: 从多渠道复制信号至多个 MT5 帐户 高级信号识别: 关键词、模式和标签全面自定义 逐提供者控制: 可启用/禁用特定信号类型、平仓策略等 灵活风险管理: 固定手数、固定金额、余额/权益百分比、部分平仓设置 可定制 SL/TP: 覆盖信号
Power Candles 策略扫描器——自优化多符号设置查找器 Power Candles策略扫描器 采用与Power Candles指标相同的自优化引擎,可同时扫描您“市场观察”中的所有交易品种。一个面板即可显示当前哪些品种在统计上具备交易价值、每种策略的最佳应用方向、最优止损/止盈组合,并在新信号触发时立即向您发送提醒。 本工具是 Stein Investments 生态系统的一部分 - 18+ 款工具,加上 Max,您的一对一 AI 交易导师。  随时在线,深入了解每一款指标,在您需要梳理思路的那一刻就在那里。  立即认识他: https://stein.investments 您的全面市场监控。每个交易品种超过3,000次自动优化。2种警报类型。一键切换图表并采取行动。 为何您需要此工具 大多数多标的扫描器仅展示价格 波动 。每只股票的波动率、百分比变化、RSI。您仍需自行摸索正确的策略、合适的止损位以及理想的入场阈值。Power Candles策略扫描器针对每只股票自动解答这些问题,仅在数学验证过的交易设置中触发实际入场信号时才会向您发出提示。这就是全部卖点。 自动
Trade Dashboard MT5
Fatemeh Ameri
4.94 (123)
疲于复杂的订单下达和手动计算?Trade Dashboard 是您的解决方案。凭借其用户友好的界面,订单下达变得轻而易举,只需点击一下,您就可以开设交易、设置止损和止盈水平、管理交易手数,并计算风险回报比,让您只需专注于您的策略。告别手动计算,使用 Trade Dashboard 简化您的交易体验。 立即下载演示版本 。 您可以在这里找到仪表盘功能和特性的详细信息 。 加入 Telegram 频道 。 购买后请给我发消息以获取支持。如果您需要添加更多功能,可以在产品的评论区留下您的想法,我愿意听取任何建议,希望您能在使用我的产品时获得最佳体验 。 这是 MT4 版本。 风险管理:使用 Trade Dashboard,可以将您的风险设置为账户余额或权益的百分比,或将风险设置为总金额。在图表上直观地定义您的止损,让工具准确计算每个货币对的适当手数。该工具还可以根据您期望的风险回报比自动设置止盈水平。它甚至可以在手数计算中涵盖佣金和点差费用。此外,您的止损和止盈可以转变为虚拟水平,隐藏于经纪商。通过 Trade Dashboard 的高级风险管理功能,掌控风险,保护您的资本。 交易线
Exp COPYLOT CLIENT for MT5
Vladislav Andruschenko
3.82 (34)
适用于 MetaTrader 5 的专业交易复制器 快速、专业、稳定可靠的 交易复制器 ,适用于 MetaTrader 。 COPYLOT 可在 MT4 和 MT5 终端之间复制 Forex 交易,并支持 Hedge 和 Netting 账户。 COPYLOT 的 MT5 版本支持: - MT5 Hedge → MT5 Hedge - MT5 Hedge → MT5 Netting - MT5 Netting → MT5 Hedge - MT5 Netting → MT5 Netting - MT4 → MT5 Hedge - MT4 → MT5 Netting MT4 版本 完整说明 + DEMO + PDF 如何购买 如何安装 如何获取日志文件 如何测试和优化 Expforex 的所有产品 您也可以将交易复制到 MT4 终端(MT4 → MT4,MT5 → MT4): COPYLOT CLIENT for MT4 COPYLOT 是一款专业的交易和持仓复制器,可同时与 2、3 甚至 10 个终端协同工作。 支持从 模拟账户和投资者账户 复制,也支持同时在多个终端上运行。 您可以使
Trade copier MT5
Alfiya Fazylova
4.59 (41)
Trade Copier 是一种专业实用程序,旨在复制和同步交易账户之间的交易。 复制发生从供应商的帐户/终端到收件人的帐户/终端,安装在同一台计算机或 vps 上。 促销活动 - 如果您已经购买了“Trade copier MT5”,您可以免费获取“Trade copier MT4”(用于 MT4 > MT5 和 MT4 < MT5 的复制)。欲了解更多详细条款,请通过私人消息与我们联系! 在购买之前,您可以在演示帐户上测试演示版本。 演示 这里 。 完整说明 这里 。 主要功能和优点: 支持复制MT5>MT5、MT4>MT5、MT5>MT4,包括МТ5 netting账户。 供应商和收件人模式在同一产品中实现。 简单直观的界面,允许您直接从图表中实时控制复制。 连接中断或终端重新启动时不会丢失设置和位置。 允许您选择要复制的符号,也可以替换接收者的符号,例如 EURUSD> USDJPY。 支持回拷贝。 能够仅复制某些订单。 允许您设置开仓交易价格的最大差异和最大时间延迟。 正确复制部分订单关闭的执行。 计算复制手数的几种方法。 同步止盈和止损。有几种方法可以计算它们的位置。 支持
Timeless Charts
Samuel Manoel De Souza
5 (4)
Timeless Charts is an advanced charting solution designed for professional traders seeking for custom charts / custom timeframes , including seconds charts / seconds timeframe, renko charts / renko bars, cluster charts / footprint charts and advanced tools present in most of the popular platforms. Unlike traditional offline charts or simplistic custom indicators, this solution constructs fully custom bars with true timestamp accuracy , down to miliseconds, allowing for a powerful and precise tr
Footprint Chart Pro — Professional OrderFlow EA for MetaTrader 5 Version 6.34 | Professional tool for real traders | Institutional-Grade Visualization DEMO USERS - PLEASE SELECT EVERY TICK / REAL TICK WHEN TESTING AND YOU HAVE DOWNLOADED HISTORICAL DATA. IF YOU SEE A WAITING SCREEN AND IT IS NOT DOWNLOADING, IT MEANS YOU HAVE LOW HISTORICAL DATA. TRY 1 MIN AND 5 MIN FIRST ON 1 DAY DATA. ONE DAY DATA SHOULD BE THE NEWEST AND MOST CURRENT DATE. PLEASE WAIT UNTIL THE MARKET HAS ROLLED OVER PERIOD.
AntiOverfit PRO MT5
Enrique Enguix
5 (4)
在购买 EA 之前,先确认它到底是真的扛得住,还是只是刚好在回测里走运。 大多数机器人都是靠一份漂亮的回测卖出去的。 曲线一路向上。 Profit Factor 很好看。 看起来几乎没有疑点。 但即便如此,很多 EA 只要市场不再按照那段历史那样运行,很快就会出问题。 为什么? 因为回测只能证明一件事: 这个策略曾经在某一条特定的价格路径上有效。 它不能证明它在其他路径下也能扛住。 不能证明它足够稳健。 更不能证明它值得你花钱。 因为你买 EA,不是为了欣赏过去那条漂亮的曲线。 你买它,是为了在会变化的市场里使用它。 AntiOverfit PRO 是做什么的 AntiOverfit PRO 帮你判断一个 MetaTrader 5 Expert Advisor 到底是真的够扎实,还是只是恰好适配某一段特定历史。 它的原理其实很容易理解: 它拿真实历史数据,生成许多与原始历史相似、但路径不同的版本,然后让你看到当市场不再完全照着原来的路线走时,这个 EA 会有什么表现。 如果你只是稍微改变一下市场路径,这个机器人就开始失效,那就是个坏信号。 而如果它在许多与原始历史相似的场景里都能稳住
MT5 to Telegram Signal Provider 是一个易于使用且完全可自定义的工具,它允许向 Telegram 的聊天室、频道或群组发送 指定 的信号,将您的账户变为一个 信号提供商 。 与大多数竞争产品不同,它不使用 DLL 导入。 [ 演示 ] [ 手册 ] [ MT4 版本 ] [ Discord 版本 ] [ Telegram 频道 ]  New: [ Telegram To MT5 ] 设置 提供了逐步的 用户指南 。 不需要了解 Telegram API;开发者提供了您所需的一切。 关键特性 能够自定义发送给订阅者的订单详情 您可以创建分层的订阅模型,例如铜、银、金。其中金订阅获得所有信号等。 通过 id、符号或评论过滤订单 包括执行订单的图表截图 在发送的截图上绘制已关闭的订单,以便额外核实 延迟发送新订单消息的可能性,以便在发送前对位置进行调整 订单详情完全透明: 新的市场订单*带截图 订单修改(止损、获利) 已关闭的订单*带截图 部分关闭的订单** 新的挂单 修改的挂单(进场价格) 挂单激活(作为新的市场订单附加) 已删除的挂单 历史订单报告
Copy Cat More Trade Copier MT5 (复制猫MT5) 是一个本地跟单软件,也是一个完整的风险管理和执行框架,专为当今的交易挑战而设计。从资金管理公司挑战到个人投资组合管理,它能适应各种情况,结合了稳健的执行、资本保护、灵活配置和高级交易处理功能。 该跟单软件可在主端(发送方)和从端(接收方)模式下工作,实时同步市价单和挂单、交易修改、部分平仓和对冲平仓操作。它兼容模拟和实盘账户、交易或投资者登录,并通过持久的交易记忆系统确保恢复功能,即使EA、终端或VPS重启也不例外。可以同时管理多个主端和从端,使用唯一ID,并通过前缀/后缀调整或自定义品种映射自动处理跨经纪商差异。 手册/设置  | Copy Cat More MT4 | 频道  特色功能: 易于设置——快至30秒(见视频)。 快速、稳定、准确——Turbo模式下低延迟复制(见截图)。 高安全性——不使用潜在危险的DLL或WebRequest。 持久交易记忆,避免孤立、丢失或不准确的交易。 可从手动或EA复制,支持所有账户类型。 品种自动前缀/后缀,快速设置;支持MT4和MT5之间复制。 非常灵活的多主端
HINN MagicEntry Extra
ALGOFLOW OÜ
4.71 (14)
HINN MAGIC ENTRY – the ultimate tool for entry and position management! Place orders by selecting a level directly on the chart! full description   ::  demo-version  :: 60-sec-video-description Key features: - Market, limit, and pending orders - Automatic lot size calculation - Automatic spread and commission accounting - Unlimited partitial take-profits  - Breakeven and trailing stop-loss and take-profit  functions - Invalidation leves - Intuitive, adaptive, and customizable interface - Works
Seconds Chart MT5
Boris Sedov
4.59 (17)
秒级图表 (Seconds Chart) - 一款专为 MetaTrader 5 设计的独特工具,用于创建秒级时间框架的图表。 通过 秒级图表 ,您可以构建以秒为单位的时间框架图表,获得标准分钟或小时图表无法提供的极致灵活性和分析精度。例如,时间框架 S15 表示每根蜡烛图持续15秒。您可以使用任何支持自定义交易品种的指标和EA交易系统。操作它们就像在标准图表上交易一样方便。 与标准工具不同, 秒级图表 让您能够在超短时间框架下进行高精度交易,无延迟干扰。 秒级图表的优势 支持 1至900秒 的时间框架图表。 基于内置的实时报价数据库, 即时加载 历史数据。 数据实时更新, 无延迟或滞后 。 可同时创建 多个秒级图表 。 秒级图表的理想应用场景 剥头皮交易 和高频交易。 精确的入场和出场时机。 在短时间框架下测试交易策略。 时间框架设置 默认设置包含以下时间框架: S1、S2、S3、S4、S5、S6、S10、S12、S15、S20、S30 。 您可轻松自定义时间框架组合,只需按升序列出 1至900秒 的数值且避免重复即可。 其他免费工具 快速交易管理器 ( Quick Trade Ma
ABQ Visual Risk Sizer
Cristian David Castillo Arrieta
ABQ Visual Risk Sizer - 机构级风险管理与交易执行工具 类别:实用工具 / 风险管理 手动计算手数既耗时又费钱。 在现代交易中,特别是在操作自营交易账户(Prop Firms)时,手数计算错误或下单延迟5秒都可能意味着违反每日回撤规则,或错过完美的入场价格。 ABQ Visual Risk Sizer 是一款专为彻底解决这一问题而设计的机构级工具。它将复杂的风险数学计算转化为直观、快速且100%准确的视觉体验,直接在您的 MetaTrader 5 图表上运行。 忘记外部计算器或 Excel 表格吧。只需在图表上拖动线条,即可实现一键交易。 为什么您需要 ABQ Visual Risk Sizer 为自营交易公司提供全面保护: 确保每笔交易的风险完全符合您设定的百分比(或金额)。在黄金或纳斯达克等高波动性资产中,再也不会开错手数。 反应速度: 当您用鼠标移动止损位时,毫秒级计算风险、所需保证金和风险回报比。 通用资产计算: 内部算法自动读取交易商的报价步长(Tick Size)和报价价值(Tick Value)。完美适用于外汇、指数、大宗商品、股票和加密货币。 主要
Custom Alerts AIO:多市场智能监控,一键启动,无需设置 概述 Custom Alerts AIO 是一款“开箱即用”的高级市场扫描工具,无需额外安装任何其他指标或进行复杂设置。它内置了 Stein Investments 的所有核心指标(FX Power、FX Volume、FX Dynamic、FX Levels 和 IX Power),可帮助您轻松监控所有主要资产类别,如外汇、黄金、指数和加密货币。如果您的经纪商支持股票,您也可以手动添加个股进行监控。 1. 为什么选择 Custom Alerts AIO? 无需额外购买任何指标 • 所有关键指标均已内置,开箱即用。 • 专注于实时预警,不包含任何图形元素,性能高效,界面简洁。 全面覆盖所有主要市场 • 支持监控外汇、金属、加密货币和指数市场。 • 无需手动输入任何交易品种,只需在设置中勾选资产类别即可启用。 • 股票并不属于默认类别,如有需要可手动通过参数输入添加。 高效、专业、便捷 • 无需图表模板和手动加载,适合自动化或远程交易环境。 • 非常适合 VPS 上长期运行,或作为后台市场预警工具使用。 2
Cerberus Equity Watcher
Samuel Bandi Roccatello
5 (3)
Cerberus the Equity Watcher 是一种风险管理工具,可以持续监控您的账户资产并避免因错误的 EA 或您的情绪行为(如果您是全权交易者)导致的重大亏损。对于依赖 EA 的系统交易者来说,它非常有用,EA 可能包含错误,或者在意外的市场条件下可能表现不佳。 Cerberus 允许您设置最小净值和(可选)最大值,如果达到其中任何一个,则所有头寸都被平仓,所有挂单被关闭,所有 EA 被“杀死”。在展平所有位置后,将向用户手机发送通知,并在屏幕上显示一条清晰的消息。在“扁平化”之后, Cerberus 继续关注股权价值,并继续扼杀任何进一步的交易尝试,直到它被重新初始化。 Cerberus 执行的任何操作都清楚地显示在屏幕上,报告在“专家顾问”选项卡上,并向用户发送通知。为了避免用户错误,对用户输入的输入值和自动交易的当前状态进行了多次检查。 ****** 特征 最小和最大权益值可以以账户货币或初始权益的百分比设置 最大净值是可选的 如果达到最小/最大净值,则所有 EA 将独立于它们交易的符号被终止 第一次压扁后几秒钟进行双重检查 Cerberus 在拉平后也继续监控股权
Telegram To MT5 Receiver
Levi Dane Benjamin
4.31 (16)
将信号从您所属的任何渠道(包括私人和受限渠道)直接复制到您的 MT5。 该工具在设计时充分考虑了用户的需求,同时提供了管理和监控交易所需的许多功能。 该产品采用易于使用且具有视觉吸引力的图形界面。 自定义您的设置并在几分钟内开始使用该产品! 用户指南 + 演示  |   MT4版本  |   不和谐版本 如果您想尝试演示,请参阅用户指南。 Telegram To MT5 接收器在策略测试器中不起作用! Telegram 至 MT5 功能 一次复制多个通道的信号 从私人和受限频道复制信号 不需要机器人令牌或聊天 ID(如果出于某种原因需要,您仍然可以使用这些) 使用风险百分比或固定手数进行交易 排除特定符号 选择复制所有信号或自定义要复制的信号 配置单词和短语以识别所有信号(默认值应适用于 99% 的信号提供商) 配置时间和日期设置以仅在需要时复制信号 设置一次打开的最大交易量 交易和头寸管理 使用信号或自动设置的管理 通过设置每月、每周、每天、每小时或每分钟的最大交易次数,停止过度交易和报复性交易。 支持市价订单和挂单 每日最大利润目标(以美元为单位)以确保头寸并停止过度交易 确
MetaTrader 5 专业交易面板 —— 图表与键盘一键交易的高效控制中心 一款面向主动交易者的专业 Trading Panel,可让您比标准 MetaTrader 操作方式更快、更直观地完成开仓、平仓、修改、管理与控制。 这不是一个普通的小工具,而是一个为高频手动操作、仓位管理、挂单控制与利润管理而设计的完整交易工作台。 通过这套面板,您可以直接在图表上一键执行交易,通过键盘快速触发核心操作,并借助自动参数计算、图形提示、信息标签以及可视化管理功能,大幅减少重复性操作,让整个交易流程更加流畅、高效且专业。 使用我们的交易面板,您可以直接从图表上一键下单,执行交易操作的速度可比标准 MetaTrader 控件快约 30 倍。 MT4 版本 | 完整说明 + DEMO + PDF | 如何购买 | 如何安装 | 如何获取日志文件 | 如何测试与优化 | Expforex 的所有产品 为什么交易者会选择这套面板 图表一键交易 ,并支持键盘快速操作 快速完成开仓、平仓、修改、反转、锁仓与部分平仓 深度控制仓位、挂单、总利润与风控逻辑 自动参数计算,减少手动输入与重复劳动 图表可视化管理
HINN Lazy Trader
ALGOFLOW OÜ
5 (2)
The core idea: using the user interface, you configure the parameters the chart must meet before entering a position (or positions), choose which entry models to use, and set the rules for when trading and planning should end. Lazy Trader  handles the rest: it  takes over all the routine chart watching and execution! full description  :: 3 key videos [1] ->  [2]   ->  [3] What can it do? - Understands Larry Williams market structure - Understands swing market structure by Michael Huddleston
Poc Breakout Signal: The Ultimate Institutional Order Flow & Price Action System Elevate your trading with Poc Breakout, a comprehensive technical analysis tool designed to bridge the gap between retail trading and institutional market understanding. This all-in-one system combines powerful Buy/Sell signals, advanced Volume Profile analysis, real-time Order Flow (Depth of Market), and critical macroeconomic data to give you a clear, unambiguous edge in the markets. Poc Breakout Signal decodes c
Bots Builder Pro MT5
Andrey Barinov
4.17 (6)
This is exactly what the name says. Visual strategy builder . One of a kind. Turn your trading strategies and ideas into Expert Advisors without writing single line of code. Generate mql source code files with a few clicks and get your fully functional Expert Advisors, which are ready for live execution, strategy tester and cloud optimization. There are very few options for those who have no programming skills and can not create their trading solutions in the MQL language. Now, with Bots Builde
The product will copy all telegram signal to MT5 ( which you are member) , also it can work as remote copier.  Easy to set up, copy order instant, can work with almost signal formats, image signal,  s upport to translate other language to English Work with all type of channel or group, even channel have "Restrict Saving Content", work with  multi channel, multi MT5 Work as remote copier: with signal have ticket number, it will copy exactly via ticket number. Support to backtest signal. How to s
FUTURES ORDERFLOW FOOTPRINT CHART Professional OrderFlow EA for MetaTrader 5 Version 1.01| Professional tool for real traders | Institutional-Grade Visualization STRATEGY TESTER USERS - PLEASE SELECT EVERY REAL TICK WHEN TESTING AND YOU HAVE DOWNLOADED HISTORICAL DATA. IF YOU SEE A WAITING SCREEN AND IT IS NOT DOWNLOADING, IT MEANS YOU HAVE LOW HISTORICAL DATA. TRY 1 MIN AND 5 MIN FIRST ON 1 DAY DATA. ONE DAY DATA SHOULD BE THE NEWEST AND MOST CURRENT DATE. PLEASE WAIT UNTIL THE MARKET HAS ROL
Local Trade Copier EA 是针对需要从外部来源执行交易信号或需要同时管理多个账户的个人交易者或账户经理的解决方案,无需 MAM 或 PAMM 账户。它可以从多达 8 个主帐户复制到无限的从帐户 [ 安装指南 | 更新指南 | 故障排除 | 常见问题 | 所有产品 ] 100% 自托管 容易安装和使用 不使用安装程序、配置文件、服务器、内存管道或 DLL 1000 次激活可永久使用 EA 本地执行,无网络延迟 它实现了您需要的所有功能: 最多8个主账户和无限从属账户 适用于所有经纪人和 DD/NDD/ECN/STP 执行 适用于具有不同帐户货币的帐户 在真实账户和模拟账户之间工作不明显 支持主从账户中的符号名称后缀 按幻数和订单评论过滤 不会干扰其他交易 可选择复制 SL 和 TP 水平 可选择复制挂单 支持符号翻译 支持部分关闭 反向模式 灵活的交易规模: - 固定地段 - 乘数 - 成比例的 - 与乘数成比例 EA 可以使用投资者或任何账户的主密码复制交易。 如何将交易从一个主账户复制到一个或多个从账户 在源终端中安装 EA 将 EA 加载到任何图表并选择“MA
Ultimate Extractor
Clifton Creath
5 (9)
Ultimate Extractor - Professional Trading Analytics for MT5 *****this is the local HTML version of Ultimate Extractor. !!!!!it is not compatible with Cloud!!!! For the online version please reach out to me directly****** Ultimate Extractor transforms your MetaTrader 5 trading history into actionable insights with comprehensive analytics, interactive charts, and real-time performance tracking. What It Does Automatically analyzes your MT5 trading history across all Expert Advisors and generates
Trader Evolution
Siarhei Vashchylka
5 (7)
" Trader Evolution " - A utility designed for traders who use wave and technical analysis in their work. One tab of the utility is capable of money management and opening orders, and the other can help in making Elliott wave and technical analysis. Manual (Be sure to read before purchasing) | Version for MT4 Advantages 1. Trading in a few clicks. Immediate and pending orders are available in the panel 2. Money management. The program automatically selects the appropriate lot size 3. Simplifies
作者的更多信息
The Simple Manual Trading Panel (v2.11) Is a professional trade management tool designed with a clean, movable UI to streamline manual execution and automated exit strategies. Core Features Dynamic Visual Interface: A movable GUI panel that provides real-time information including a bar countdown timer, live spread, and advanced volume analysis. Flexible Lot Size setting, with 2 decimals (If broker supports it). Multi-Stage Take Profit: Supports three distinct Take Profit (TP) levels in either
Trend Matrix Panel is a multi-timeframe technical indicator for MetaTrader 5 that compresses an entire trading session's structural picture into a single panel. Rather than flipping between charts to read M1, M15, H1, and D1 separately, the panel shows the trend state of three configurable moving averages across twelve timeframes simultaneously, with a heatmap that draws your eye to the genuinely strong signals and away from noise. The core idea is simple: every cell in the matrix tells you how
This script is an Intelligence Gathering Utility designed to give you full control over your data exports from MetaTrader 5. It allows you to synchronize up to three different symbols into a single file with precise timestamping. 1. Setting the Data Range (Range) You can define exactly which historical period you want to capture: Date Mode : If Last N bars (0 = use date range above) is set to 0 , the script will export all data between your chosen start and end dates. Bar Mode : By entering a nu
筛选:
无评论
回复评论