Fractal Waves
- Indicators
-
Maxim Romanov
 Trading is my full-time job. I've been in the market since 2008, researching the forex, stock, commodity, and cryptocurrency markets. I study patterns and the reasons why they emerge and disappear. I'm developing my own pricing theory that describes and predicts the emergence of certain patterns. I
 - Version: 1.1
- Updated: 24 March 2020
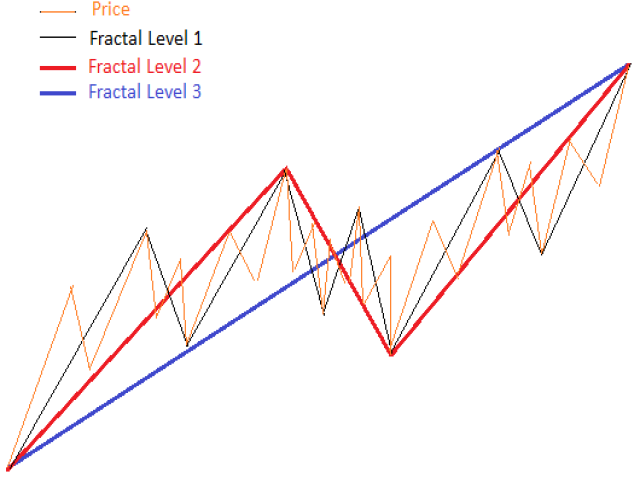
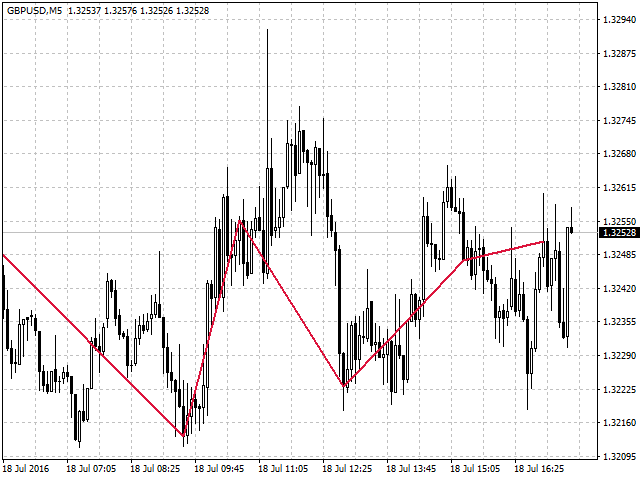
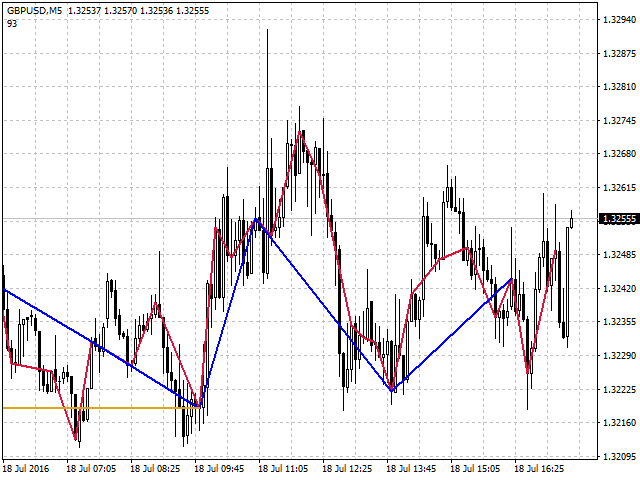
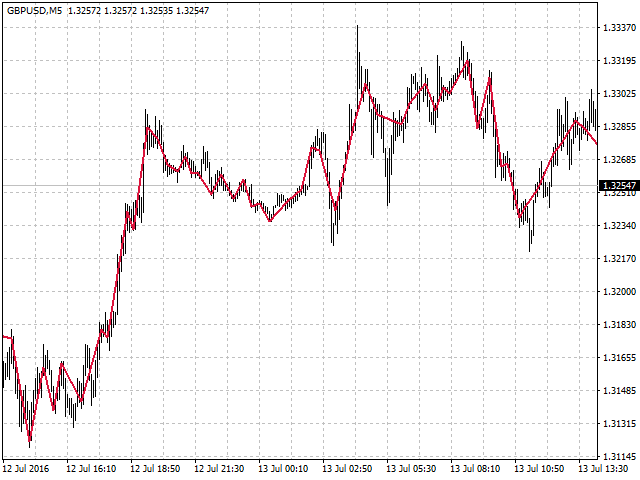
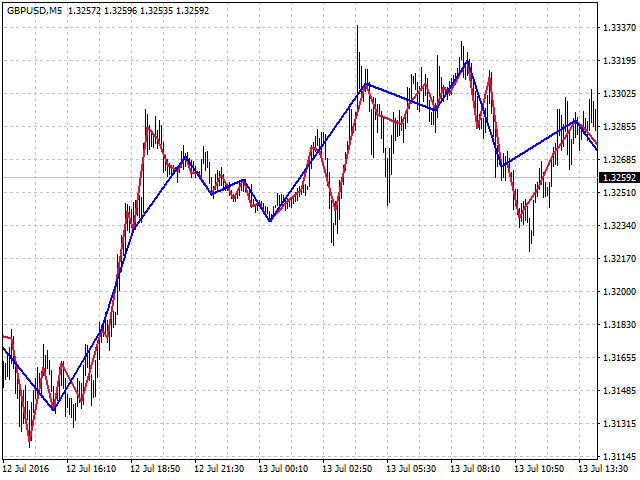
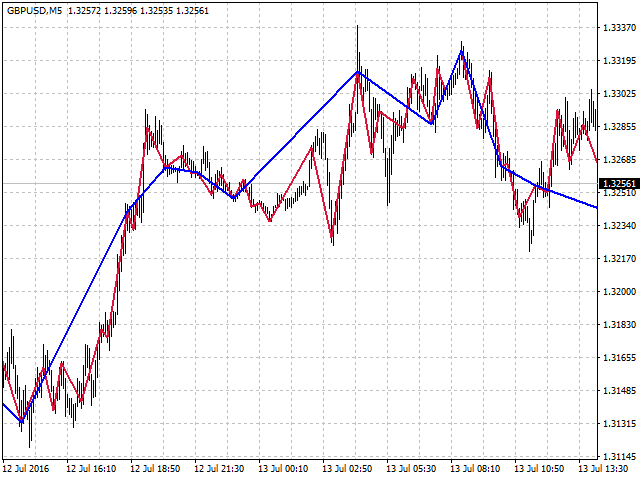
The indicator looks for market Highs and Lows. They are defined by fractals, i.e. the market creates the indicator algorithm and structure, unlike ZigZag having a rigid algorithm that affects the final result. This indicator provides a different view of the price series and detects patterns that are difficult to find on standard charts and timeframes.
The indicator does not repaint but works with a small delay.
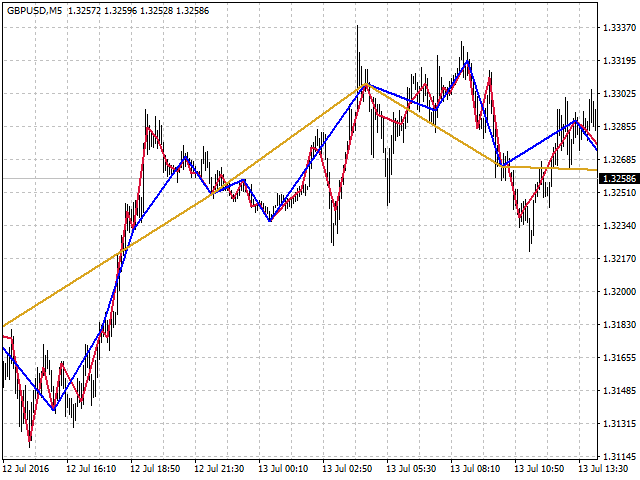
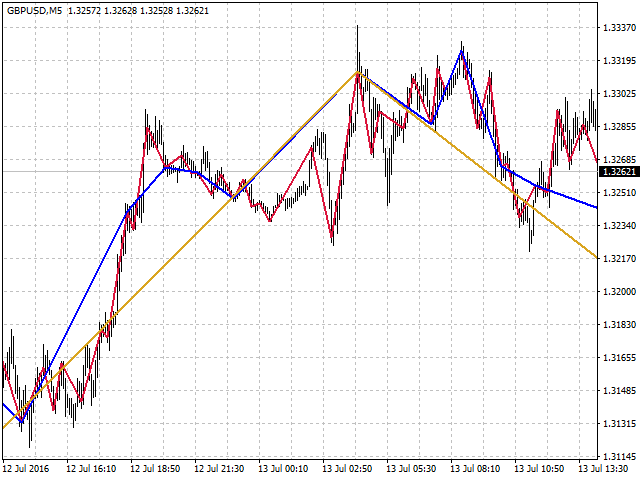
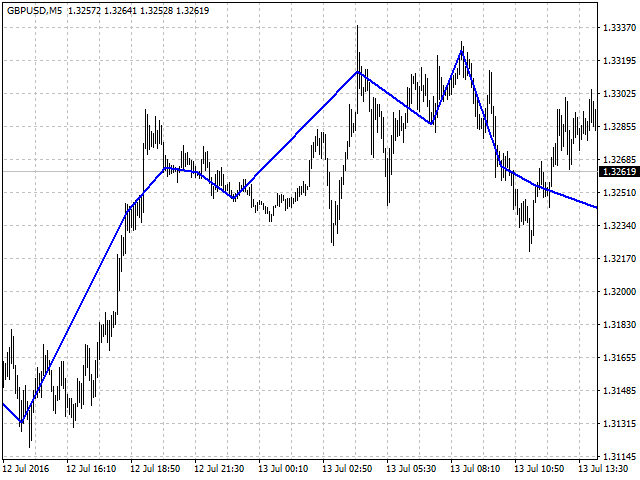
The first fractal level is based on the price, the second fractal level is based on the first one, etc. The first screenshot displays the sample indicator algorithm. If you use Elliott waves, the indicator will greatly facilitate your work.
This indicator also allows users to avoid time discretization.
The indicator features only four settings, including labeling start date. The labeling form depends on its date and time due to the fractal nature of the market.
Settings
- StartLeveL - initial level for displaying labeling (at least 1)
- Levels - number of labeling levels (up to 6)
- StartTime - labeling start date and time
- Mode - labeling algorithm (1 or 2)

User didn't leave any comment to the rating