Fractal Waves

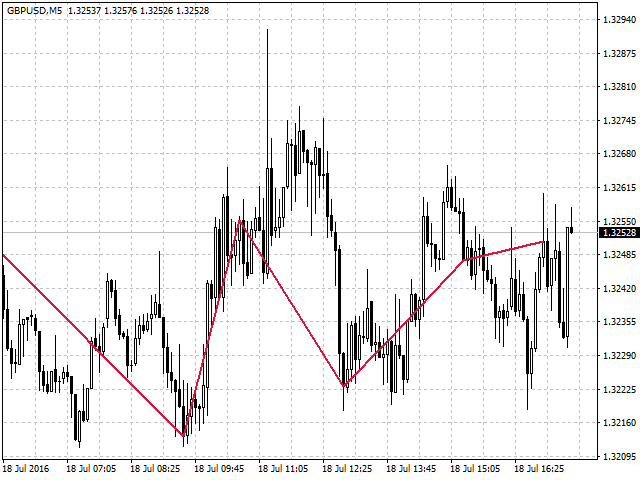
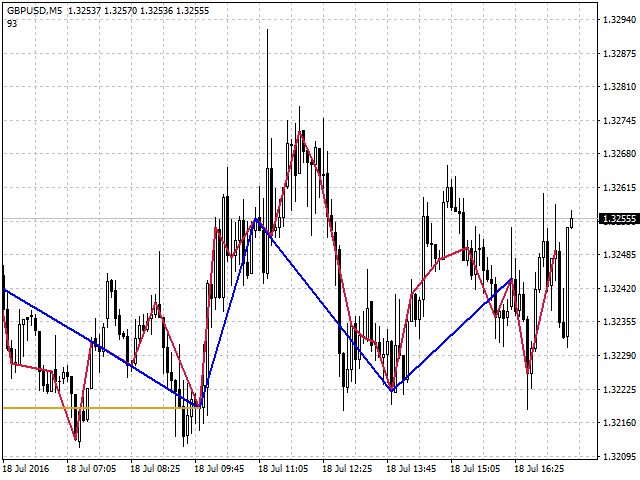
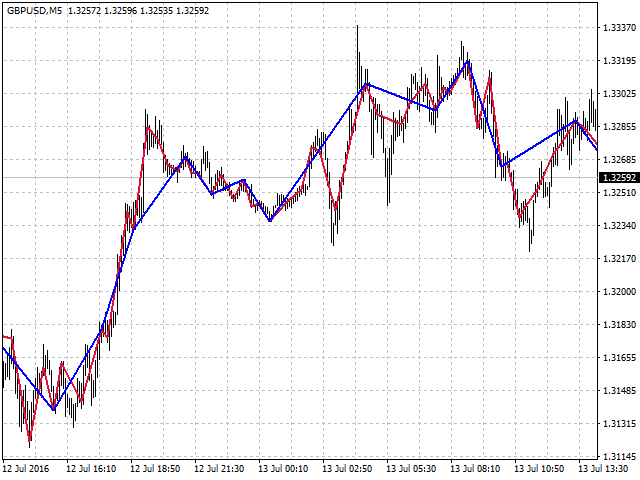
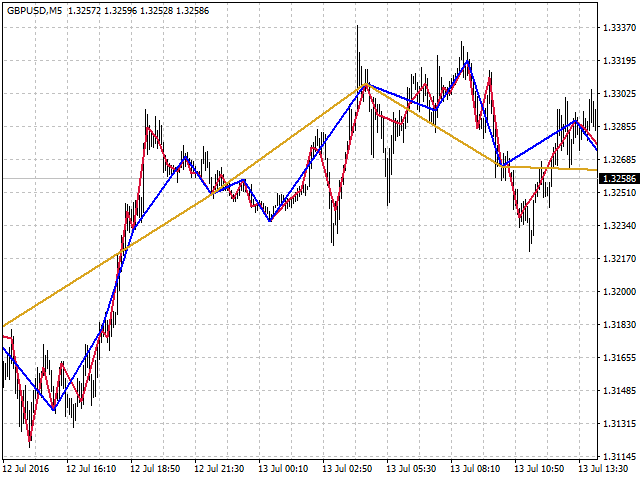
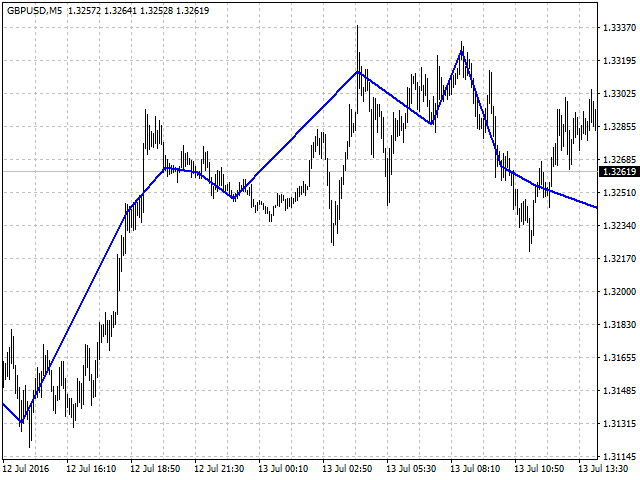
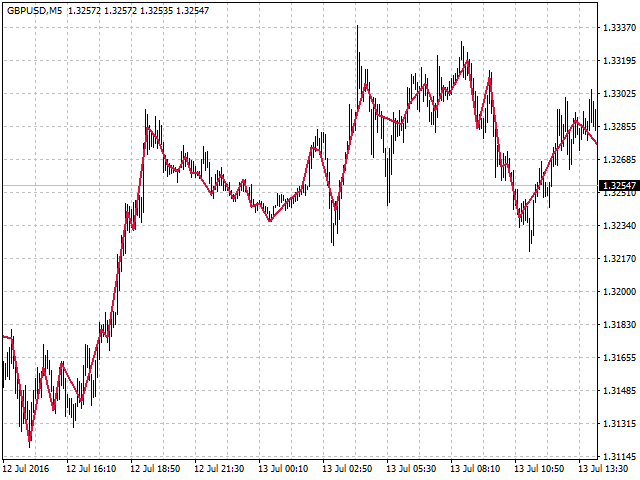
The indicator looks for market Highs and Lows. They are defined by fractals, i.e. the market creates the indicator algorithm and structure, unlike ZigZag having a rigid algorithm that affects the final result. This indicator provides a different view of the price series and detects patterns that are difficult to find on standard charts and timeframes.

The indicator does not repaint but works with a small delay.

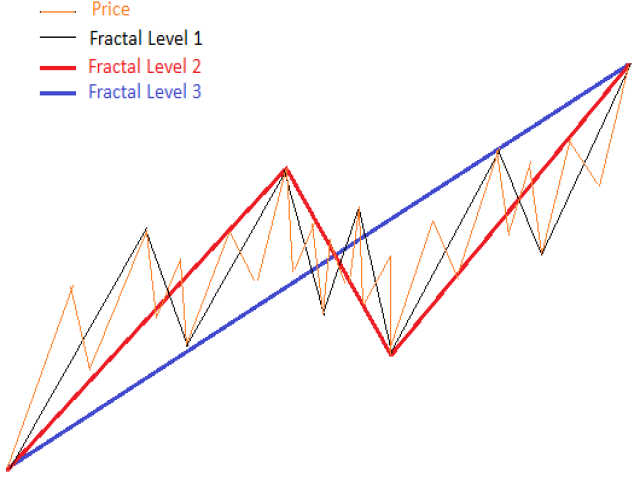
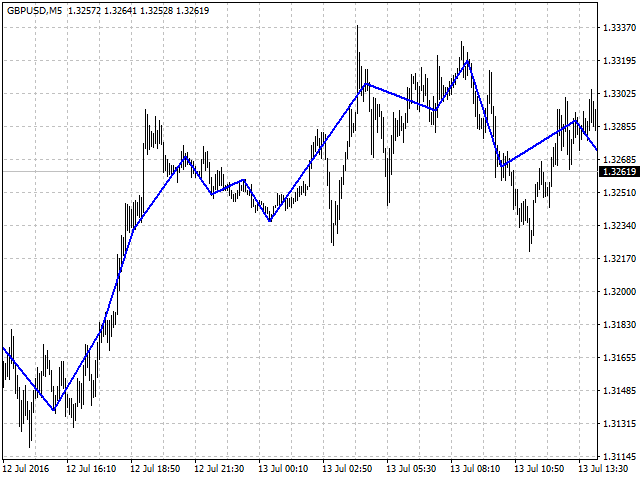
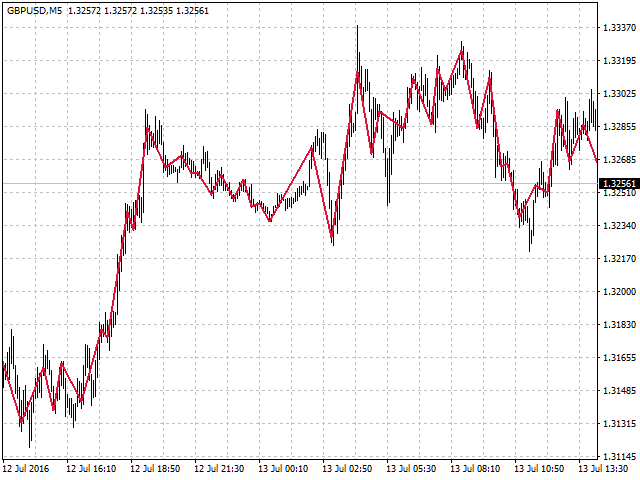
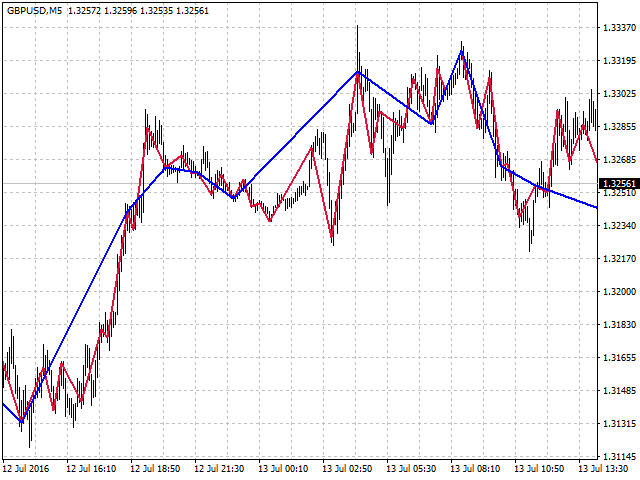
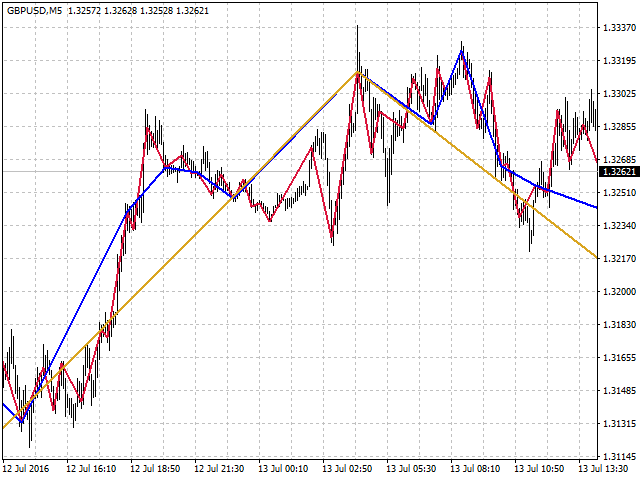
The first fractal level is based on the price, the second fractal level is based on the first one, etc. The first screenshot displays the sample indicator algorithm. If you use Elliott waves, the indicator will greatly facilitate your work.

This indicator also allows users to avoid time discretization.

The indicator features only four settings, including labeling start date. The labeling form depends on its date and time due to the fractal nature of the market.


Settings

  • StartLeveL - initial level for displaying labeling (at least 1)
  • Levels - number of labeling levels (up to 6)
  • StartTime - labeling start date and time
  • Mode - labeling algorithm (1 or 2)
Produtos recomendados
Wise Men Indicator demo
Bohdan Kasyanenko
3 (2)
The indicator displays signals according to the strategy of Bill Williams on the chart. Demo version of the indicator has the same features as the paid, except that it can work only on a demo account . Signal "First Wise Man" is formed when there is a divergent bar with angulation.  Bullish divergent bar - with lower minimum and closing price in the upper half. Bearish divergent bar - higher maximum and the closing price at the bottom half. Angulation is formed when all three lines of Alligator
FREE
Você marca zonas de oferta e zonas de demanda à mão e obtém um resultado um pouco diferente a cada vez? Este indicador gratuito para MetaTrader 4 as desenha com uma única regra fixa, descrita por completo abaixo, para que você possa conferir cada zona por conta própria. A ideia: um candle forte (corpo de pelo menos X vezes o ATR) deixa logo antes dele uma "base" de 1 a 10 candles pequenos. Um candle forte de alta que fecha acima da base a transforma em uma zona de demanda; um de baixa que fecha

FREE
Traditional MACD MT4
Daniel Lewis
4.6 (57)
Indicador MACD em MetaTrader 4/5 parece diferente do que o MACD faz na maioria dos outros softwares gráficos. Isso é porque a versão MetaTrader 4/5 de MACD mostra a linha MACD como um histograma quando é tradicionalmente apresentado como uma linha. Além disso, a versão MetaTrader 4/5 calcula a linha de sinal usando uma SMA, no entanto de acordo com a definição, o indicador MACD supostamente é calculado com uma EMA. A versão MetaTrader 4/5 também não computa um verdadeiro Histograma MACD (a difer
FREE
OrderBlock TS Roman
Vladislav Vlastovskii
4 (6)
Индикатор строит блоки заказов (БЗ) по торговой системе (ТС) Романа. Поиск блоков осуществляется одновременно на двух таймфремах: текущем и старшем (определяемым в настройках). Для оптимизации и игнорирования устаревших блоков в настройках задается ограничение количества дней в пределах которых осуществляется поиск блоков. Блоки строятся по правилам ТС состоящем из трех шагов: какую свечу вынесли (что?); какой свечой вынесли (чем?); правило отрисовки (как?).
FREE
Free automatic Fibonacci is an indicator that automatically plots a Fibonacci retracement based on the number of bars you select on the BarsToScan setting in the indicator. The Fibonacci is automatically updated in real time as new highest and lowest values appears amongst the selected bars. You can select which level values to be displayed in the indicator settings. You can also select the color of the levels thus enabling the trader to be able to attach the indicator several times with differe
FREE
SuperTrend V
Muhammad Hassaan
*This is TradingView indicator converted to mql4* The SuperTrend V indicator is a popular technical analysis tool used to identify trends and potential trend reversals in financial markets. It is based on the concept of the SuperTrend indicator but incorporates additional features and variations. The SuperTrend V indicator uses a combination of price action and volatility to determine the trend direction and generate trading signals. Here are the key components and features of the indicator: Ca
FREE
PZ Penta O MT4
PZ TRADING SLU
2.33 (3)
The Penta-O is a 6-point retracement harmonacci pattern which usually precedes big market movements. Penta-O patterns can expand and repaint quite a bit. To make things easier this indicator implements a twist: it waits for a donchian breakout in the right direction before signaling the trade. The end result is an otherwise repainting indicator with a very reliable trading signal. The donchian breakout period is entered as an input. [ Installation Guide | Update Guide | Troubleshooting | FAQ | A
FREE
Follow The Line
Oliver Gideon Amofa Appiah
3.94 (16)
FOLLOW THE LINE GET THE FULL VERSION HERE: https://www.mql5.com/en/market/product/36024 This indicator obeys the popular maxim that: "THE TREND IS YOUR FRIEND" It paints a GREEN line for BUY and also paints a RED line for SELL.  It gives alarms and alerts of all kinds. IT DOES NOT REPAINT and can be used for all currency pairs and timeframes. Yes, as easy and simple as that. Even a newbie can use it to make great and reliable trades. NB: For best results, get my other premium indicators for more
FREE
Extremum Reverse Bar
Yurij Izyumov
2.8 (5)
This indicator has been created for finding the probable reversal points of the symbol price. A small candlestick reversal pattern is used it its operation in conjunction with a filter of extremums. The indicator is not redrawn! If the extremum filter is disabled, the indicator shows all points that have a pattern. If the extremum filter is enabled, the condition works – if the history Previous bars 1 candles back contains higher candles and they are farther than the Previous bars 2 candle, such
FREE
UPD1 Rsi Dots Dashboard
Vitaliy Kuznetsov
5 (2)
O indicador mostra sinais baseados no oscilador RSI terminal no gráfico. É possível filtrar sinais repetidos. Aqui, o oscilador é usado para procurar um sinal reverso. É recomendado como um ponto de entrada em estratégias de swing e negociação a partir de níveis. Um painel multi-moeda está disponível. Com ele, você pode alternar facilmente entre os gráficos. Nas discussões de produtos, você pode sugerir um algoritmo no qual pode incorporar um painel. Parametro. Configurações Principais. Bar
FREE
WAD Stoch
Yonny Pascal Ekwa Mezui
WAD Divergence + Stochastic Overview WAD Divergence + Stochastic is a technical indicator designed to assist traders in identifying potential market turning points. It combines price behavior with momentum confirmation to highlight areas where buying or selling pressure may be shifting. The indicator works directly on the chart and provides clear visual signals to support decision-making in fast-moving markets. How It Works The indicator analyzes the relationship between price movement and inte
FREE
SMA Indicator
Nitu Brijesh Yadav
Arrow Indicator (Buy/Sell Alerts) – Simple Yet Powerful Tool!             Product Version: 1.01           Indicator Type: Trend Reversal Signals           Timeframes Supported: All (Recommended: H1, H4, D1)           Key Features: Buy Signal: Green upward arrow () appears below the candle  Sell Signal : Red downward arrow () appears above the candle Accurate Trend Reversal Detection – Based on tried and tested SMA strategy. ️ Clean Chart View – Minimalist, non-i
FREE
Candle Countdown — Tempo preciso até o fechamento da vela para MT4 Candle Countdown é um  instrumento simples e preciso que mostra o tempo restante até o fechamento da vela atual diretamente no gráfico. Quando a entrada depende do fechamento da vela, até mesmo alguns segundos fazem diferença. Este indicador permite ver o tempo exato e tomar decisões sem pressa ou suposições. Um indicador para controle preciso do fechamento da vela. O indicador mostra: tempo restante até o fechamento da vela hor
FREE
Multi-TF MA Levels plots a single moving average across multiple timeframes directly on your chart, giving you instant context at every level of the market. No switching charts. No mental maths. Just clean, flat lines showing exactly where the MA sits on M15, M30, H1, H4 and D1 — all updated on confirmed bar close so there is no repainting. Features Plots the local timeframe MA plus up to 5 higher timeframe MAs simultaneously HTF lines only update on confirmed bar close — no repainting Higher ti
FREE
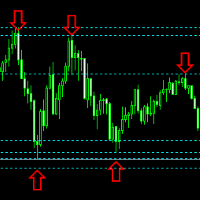
.....................................hi....................... ................for showing high s and low s and support and resistanses .....................we have a lot of ways............................... it can be helpful for finding trends , higher highs , higher lows , lower highs , lower lows .......................today i write on of thems.......................... ........................you can enter the number of last support and resistanses .........................and it will dra
FREE
Donchian channels are a tool in technical analysis used to determine the relative volatility of a market and the potential for price breakouts. Can help identify potential breakouts and reversals in price, which are the moments when traders are called on to make strategic decisions. These strategies can help you capitalize on price trends while having pre-defined entry and exit points to secure gains or limit losses. Using the Donchian channel can thus be part of a disciplined approach to managi
FREE
The indicator detects and displays Shark harmonic pattern (see the screenshot). The pattern is plotted by the extreme values of the ZigZag indicator (included in the resources, no need to install). After detecting the pattern, the indicator notifies of that by a pop-up window, a mobile notification and an email. The indicator highlights the process of the pattern formation and not just the complete pattern. In the former case, it is displayed in the contour triangles. After the pattern is comple
Wave Reversal Indicator
Vitalyi Belyh
4.33 (3)
Wave Reversal Indicator - determina a direção e as reversões de preço em torno da linha de equilíbrio. O indicador mostra os movimentos das ondas e os picos de tendência. Dá recomendações sobre onde seguir o trader, ajuda a seguir a estratégia de trading. É um complemento a uma estratégia intradiária ou de médio prazo. Quase todos os parâmetros são selecionados para cada intervalo de tempo e mudam automaticamente; Prazos ideais para utilizar M5, M15, M30, H1, H4. Funciona em vários instrumentos
FREE
True Stochastic Divergence — Indicador de Divergência Stochastic de Alta Qualidade A maioria dos indicadores de divergência gera sinais em praticamente todos os topos e fundos locais, fazendo com que o gráfico fique repleto de divergências falsas ou pouco relevantes. True Stochastic Divergence utiliza um algoritmo de filtragem proprietário que analisa a estrutura do preço e exibe apenas os sinais de maior qualidade. Seu principal objetivo não é encontrar o maior número possível de divergências,
FREE
PZ Turtle Trading
PZ TRADING SLU
3.8 (10)
The Turtle Trading Indicator implements the original Dennis Richards and Bill Eckhart trading system, commonly known as The Turtle Trader. This trend following system relies on breakouts of historical highs and lows to take and close trades: it is the complete opposite to the "buy low and sell high" approach. The main rule is "Trade an N-day breakout and take profits when an M-day high or low is breached (N must me above M)". [ Installation Guide | Update Guide | Troubleshooting | FAQ | All Prod
FREE
Padrões Harmônicos são mais bem utilizados para prever pontos de virada no mercado. Esses padrões oferecem uma alta taxa de vitória e diversas oportunidades de negociação em um único dia de negociação. Nosso indicador identifica os Padrões Harmônicos mais populares com base nos princípios descritos na literatura de Negociação Harmônica. NOTAS IMPORTANTES: O indicador não repinta, não atrasa (detecta um padrão no ponto D) e não REDRAW (o padrão é válido ou cancelado). COMO USAR: Arraste e solte o
FREE
Power Trend Free
Yurij Kozhevnikov
5 (2)
Power Trend Free - the indicator shows the trend strength in the selected period. Input Parameters The indicator has three input parameters: Period - a positive number greater than one, it shows the number of candlesticks used for calculations. If you enter one or zero, there will be no error, but the indicator will not be drawn. Applied Price - the standard "Apply to:" set meaning data used for the indicator calculation: Close - Close prices; Open - Open prices; High - High prices; Low - Low p
FREE
Double HMA lines MTF
Pavel Zamoshnikov
5 (2)
This is a multi-timeframe version of the popular Hull Moving Average (HMA). The Double HMA MTF Light indicator combines two timeframes on a single chart. The HMA of the higher timeframe defines the trend, and the HMA of the current timeframe defines short-term price movements. The indicator is freely distributed and hasn't audio signals or messages. Its main function is the visualization of price movements. If you need advanced functionality of the HMA multi-timeframe indicator (information ab
FREE
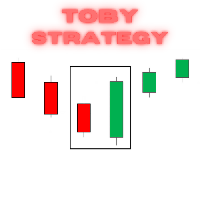
Toby Strategy Indicator
Ahmd Sbhy Mhmd Ahmd ʿYshh
The indicator rely on The Toby strategy >> The mother candle which is bigger in range than the previous six candles. A vertical line shows the last Toby Candle with the targets shown up and down. The strategy is about the closing price out of the range of the toby candle to reach the 3 targets..The most probable to be hit is target1 so ensure reserving your profits and managing your stop lose.
FREE
Railway Tracks Pattern — Reversal Pattern Indicator Railway Tracks Pattern is an indicator that automatically detects a powerful two-candle reversal pattern on the chart. It looks for two candles with opposite directions (bullish and bearish), similar in size, and with minimal wicks — a clear sign of momentum shift. How it works: The first candle is strong and directional. The second candle moves in the opposite direction and is of similar size. Both candles have small shadows (wicks). The
FREE
Trendline indicator
David Muriithi
2 (1)
Are you tired of drawing trendlines every time you're analyzing charts? Or perhaps you would like more consistency in your technical analysis. Then this is for you. This indicator will draw trend lines automatically when dropped on a chart. How it works Works similar to standard deviation channel found on mt4 and mt5. It has 2 parameters: 1. Starting Bar 2. Number of bars for calculation The   starting bar   is the bar which drawing of the trend lines will begin, while the   number of bars for c
FREE
GS spread
Aleksander Gladkov
The indicator calculates the current spread for each tick using the formula Spread=(ASK-BID)/Point. Schedule of changes in the boundaries spread over the timeframe displayed in a separate window from the date of accession of the indicator. Two lines corresponding to the minimum and maximum spread values are displayed. The indicator window is self-adjusted according to the minimum and maximum values from the moment of launch. The minimum and maximum values for the entire period of the indicator o
FREE
ProReaper
Sergei Anshakov
Представляю новый индикатор — Profit Reaper! Это чистый Price Action, усиленный алгоритмом. Как он это делает? Мощный сканер Engulf-паттернов: Сканирует рынок 24/7 в поиске сильнейших паттернов "Поглощение". Фильтр RSI | инд. стабильности: Отсеивает слабые сигналы с помощью RSI и фильтра стабильности. ️ TP/SL на основе ATR: Мгновенно определяет оптимальные TP и SL на основе ATR. ️ Мгновенные алерты на сигналы Основа — паттерн "Поглощение": Индикатор находит классические бычьи и
FREE
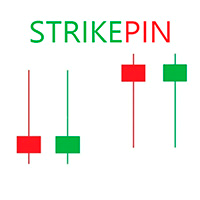
StrikePin
Mike Pascal Plavonil
1 (1)
The StrikePin indicator is a technical, analytical tool designed to identify trend reversals and find optimal market entries.  The StrikePin indicator is based on the pin bar pattern, which is the Price Action reversal pattern. An entry signal, in a trending market, can offer a very high-probability entry and a good risk to reward scenario. Be careful: the indicator is repainting since it is looking for highest high and lowest lows.  You should avoid to use it in experts but you can use it in
FREE
Blahtech VWAP
Blahtech Limited
5 (3)
Blahtech VWAP - Volume Weighted Average Price (VWAP) is the ratio of price to total volume. It provides an average price over a specified time interval.  Links [  Install  |  Update  |  Documentation   ] Feature Highlights Configurable VWAP Line Sessions, intervals, anchored or continuous Previous day settlement line Standard Deviation bands Alerts at bar close or real time Automatic Broker or Tick volumes Significantly reduced CPU usage Input Parameters Expert Advisor Mode  - Reserved for iC
FREE
Os compradores deste produto também adquirem
Trend SniperX MT4
Sarvarbek Abduvoxobov
5 (5)
Trend Sniper X é um indicador de tendência multitemporal para MetaTrader 5 que ajuda os traders a identificar a direção da tendência e potenciais pontos de reversão com clareza e precisão. Para MT5: https://www.mql5.com/en/market/product/181101 Informação de preço: O preço atual é promocional e está sujeito a alterações à medida que novas atualizações e recursos forem lançados. Canal Code2Profit Domine o Mercado com Análise Multitemporal! Como Maximizar sua Taxa de Acerto com o Trend Sniper X: R
Currency Strength Wizard é um indicador muito poderoso que fornece uma solução completa para uma negociação bem-sucedida. O indicador calcula o poder deste ou daquele par forex usando os dados de todas as moedas em vários intervalos de tempo. Esses dados são representados em uma forma de índice de moeda fácil de usar e linhas de energia de moeda que você pode usar para ver o poder desta ou daquela moeda. Tudo o que você precisa é anexar o indicador ao gráfico que deseja negociar e o indicador mo
Scalper Vault
Oleg Rodin
5 (41)
O Scalper Vault é um sistema de negociação poderoso e completo, projetado para traders que buscam consistência em operações intraday. Este indicador de alta precisão funciona como um sistema de negociação autônomo, oferecendo análises de nível institucional tanto para o mercado Forex quanto para Opções Binárias. ENTRE EM CONTATO COMIGO APÓS A COMPRA PARA RECEBER DICAS DE NEGOCIAÇÃO E UM BÔNUS EXCLUSIVO! Ao eliminar suposições e análises manuais complexas, o Scalper Vault permite que você foque
Actualmente 30% OFF ! A melhor solução para qualquer novato ou comerciante especializado! Este software de painel de instrumentos está a funcionar em 28 pares de moedas. É baseado em 2 dos nossos principais indicadores (Advanced Currency Strength 28 e Advanced Currency Impulse). Dá uma grande visão geral de todo o mercado Forex. Mostra valores avançados de força da moeda, velocidade de movimento da moeda e sinais para 28 pares de divisas em todos os (9) períodos de tempo. Imagine como a sua n
Smart Trend Trading System é um indicador para MetaTrader 4 que reúne informações de tendência, sinais de entrada e saída e níveis de preço em um único gráfico. Ele combina mais de 10 ferramentas de trading em um único sistema, incluindo detecção de tendência, zonas de reversão, Smart Cloud, lógica de trailing stop, suporte e resistência, coloração de candles, alertas e análise multi-timeframe. O sistema foi desenvolvido para ajudar você a operar diferentes condições de mercado: Mercados em tend
Zoryk Gold mt4
Reda El Koutbane
5 (3)
O desconto termina em 24 horas — próximo preço $ 69 ZORYK — Sistema avançado de sinais e planejamento para XAUUSD no MetaTrader 4 Você conhece essa sensação. Você analisa o ouro, espera pela entrada e finalmente abre a operação. O preço começa a se mover contra você. Você fecha cedo demais, altera o Stop Loss ou hesita por alguns segundos. Logo depois, o mercado segue exatamente na direção que você esperava, mas sem você na operação. O problema nem sempre era a direção. O verdadeiro problem
Trend Lines PRO
Roman Podpora
5 (2)
LINHAS DE TENDÊNCIA PRO       Ajuda a entender onde o mercado está realmente mudando de direção. O indicador mostra inversões de tendência reais e pontos onde os principais participantes retornam ao mercado. Você vê     Linhas BOS     Análise de tendências e níveis-chave em prazos maiores — sem configurações complexas ou ruídos desnecessários. Os sinais não são repintados e permanecem no gráfico após o fechamento da barra. VERSÃO MT 5      -      Revela seu potencial máximo quando emparelhada co
AW Prime Oscillator
AW Trading Software Limited
5 (1)
Uma combinação de dois osciladores. O primeiro exibe os pontos de entrada, o segundo mostra a tendência atual. O indicador pode exibir sinais do oscilador por meio de setas em dois modos, todos os sinais do oscilador rápido ou sinais apenas na direção da tendência atual. Possui painel multi-timeframe e três tipos de notificações de sinal. Benefícios: Adequado para negociação diurna e de scalping Filtragem de tendências Configuração simples e sensível Painel multiperíodo Adequado para integração
Atomic Analyst
Issam Kassas
5 (14)
Atomic Analyst — MetaTrader 4 Para dúvidas sobre o produto, orientação de configuração ou suporte técnico, envie-me uma mensagem diretamente aqui no MQL5. O indicador transforma cálculos complexos do mercado em sinais visuais simples, candles coloridos, leituras de tendência, níveis de stop loss e várias zonas de take profit que os traders podem entender rapidamente e usar em condições reais de mercado. Principais usos de trading: Scalping e day trade: Desenvolvido para tomada de decisão rápida
SR Liquidity
Oleg Rodin
5 (2)
O SR Liquidity é um indicador de trading projetado para revelar as zonas ocultas onde a liquidez do mercado se concentra e o preço reage com maior intensidade. Essas áreas específicas de liquidez funcionam como níveis poderosos de suporte e resistência, oferecendo um mapa claro de onde é mais provável que o mercado reverta. Em vez de traçar linhas comuns de Suporte e Resistência, o SR Liquidity analisa o comportamento real dos preços para detectar as zonas onde se acumulam pressões de compra e v
O sistema PRO Renko é um sistema de negociação altamente preciso especialmente concebido para a negociação de gráficos RENKO. Trata-se de um sistema universal que pode ser aplicado a vários instrumentos de negociação. O sistema neutraliza eficazmente o chamado ruído de mercado, dando-lhe acesso a sinais de inversão precisos. O indicador é muito fácil de usar e tem apenas um parâmetro responsável pela geração de sinal. Você pode facilmente adaptar a ferramenta a qualquer instrumento de negocia
Este indicador examina a estrutura de preços de fractais de diferentes períodos para determinar possíveis pontos de reversão no mercado, proporcionando tempo aos traders posicionais que já possuem um modelo de avaliação fundamental ou técnico. Diferentemente de seu irmão mais novo, Reversal Fractals , esse indicador não perde reversões por causa do período selecionado e encontra fractais de reversão em zigue-zague, ignorando as reversões que não possuem impulso suficiente para iniciar um movime
M1 Sniper
Oleg Rodin
4.97 (30)
O M1 SNIPER é um sistema indicador de negociação fácil de usar. É um indicador de seta projetado para o período M1. O indicador pode ser usado como um sistema independente para scalping no período M1 e pode ser usado como parte do seu sistema de negociação existente. Embora este sistema de negociação tenha sido projetado especificamente para negociação no M1, ele também pode ser usado em outros períodos. Originalmente, desenvolvi este método para negociar XAUUSD e BTCUSD. Mas considero-o útil ta
RFI levels PRO
Roman Podpora
5 (2)
O indicador mostra com precisão os pontos de reversão e as zonas de retorno de preço onde o   Principais players . Você identifica onde novas tendências estão se formando e toma decisões com máxima precisão, mantendo o controle sobre cada negociação. VERSION MT5     -     Revela seu potencial máximo quando combinado com o indicador   TREND LINES PRO. O que o indicador mostra: Estruturas de reversão e níveis de reversão com ativação no início de uma nova tendência. Exibição dos níveis de   TAKE
Neo Wave PRO
Nikolay Raykov
5 (1)
Price & Time Market Structure Indicator A professional market structure tool that analyzes waves through both price and time — not price alone. Main Description NeoWave PRO is a professional market structure indicator for MetaTrader 4 designed for traders who want to move beyond traditional one-dimensional wave tools such as ZigZag, swing indicators, and basic high/low systems. Most wave indicators analyze only one thing: Price. But a real market wave is not only a price movement. A true wave de
Non repaint MT4
Yan Zhen Du
5 (1)
This is a professional chart indicator designed for traders focused on stability and clear price action. It helps filter market noise and provides clear visual entry and exit zones for your trading decisions. Core Features: Strictly Non-Repainting: The system is built with strict non-repaint logic. What you see on the chart is the true historical performance. Confirmed Signals: Signals are triggered and confirmed only after the candle closes . Once a trading arrow appears on a closed candle, it
Gann Time Clusters
Martin Eshleman
2.5 (2)
Gann Time Clusters Indicator This indicator is based on W. D. Gann's Square of 9 method for the time axis. It uses past market reversal points and applies the mathematical formula for Gann's Square of 9 and then makes projections into the future. A date/time where future projections line up is called a 'time cluster'. These time clusters are drawn as vertical lines on the right side of the chart where the market has not advanced to yet. A time cluster will result in a market reversal point (ex.
Route Lines Prices
Vitalyi Belyh
3 (1)
O indicador Route Lines Prices - foi concebido para identificar a direção dos preços. A sua interface simples contém múltiplos algoritmos para calcular o comportamento dos preços e a direção futura. Estes algoritmos incluem cálculos de volatilidade e suavização de preços com base nos períodos de tempo utilizados. O indicador possui um único parâmetro para alterar o valor de " Calculating price values ". O valor padrão de 1 fornece um cálculo automático equilibrado, que pode ser utilizado sem ne
CRT Candle Range Theory HTF MT4 - Ultimate CRT Indicator: Conceitos Avançados de ICT e Sistema de Negociação SnR Malaio Domine as pegadas dos criadores de mercado com o indicador mais avançado de Candle Range Theory. Desbloqueie o verdadeiro poder dos Smart Money Concepts (SMC) e opere com a precisão das instituições com o Ultimate CRT Indicator. Construído exclusivamente para traders sérios, este indicador automatiza a altamente eficaz Teoria CRT, um pilar central dos Conceitos ICT (Inner Circl
Advanced Supply Demand
Bernhard Schweigert
4.91 (302)
Atualmente com 30% de desconto! A melhor solução para qualquer Trader Novato ou especialista! Este indicador é uma ferramenta de negociação exclusiva, de alta qualidade e acessível porque incorporamos uma série de recursos proprietários e uma nova fórmula. Com esta atualização, você poderá mostrar fusos horários duplos. Você não só será capaz de mostrar um TF mais alto, mas também mostrar ambos, o TF do gráfico, MAIS o TF mais alto: MOSTRANDO ZONAS ANINHADAS. Todos os traders de Oferta e Demanda
Imbalance Pro
Ivan Stefanov
5 (4)
O indicador mede o desequilíbrio entre os touros e os ursos durante um período escolhido e mostra uma linha reta entre os dois pontos. Se os touros tiverem mais volume do que os ursos, a linha fica verde.  Se os ursos tiverem mais volume, a linha fica vermelha. A linha também mostra a diferença percentual no volume. O indicador mostra os mesmos dados numa janela separada. Também é possível ver o volume dividido. O indicador tem dois modos. Para este efeito, existe um botão no canto superio
ACTUALMENTE 40% DE DESCONTO!! A melhor solução para qualquer novato ou comerciante especializado! Este indicador é uma ferramenta comercial única, de alta qualidade e acessível, porque incorporámos uma série de características proprietárias e uma fórmula secreta. Com apenas UM gráfico, dá alertas para todos os 28 pares de moedas. Imagine como a sua negociação irá melhorar porque é capaz de identificar o ponto exacto de desencadeamento de uma nova tendência ou oportunidade de escalada! Constr
Super Signal – Skyblade Edition Sistema profissional de sinais de tendência sem repintar / sem atraso com taxa de acerto excepcional | Para MT4 / MT5 Funciona melhor em timeframes mais curtos, como 1 minuto, 5 minutos e 15 minutos. Principais características: Super Signal – Skyblade Edition é um sistema inteligente de sinais desenvolvido especificamente para operações com tendência. Utiliza uma lógica de filtragem em múltiplas camadas para detectar apenas movimentos direcionais fortes sustenta
Liquidity Scalper System: um sistema de trading baseado em liquidez no formato de indicador. A maioria dos indicadores mostra apenas uma seta, e depois o trader decide sozinho onde colocar o stop, onde está o alvo e se pode confiar no sinal. O Liquidity Scalper System cobre todo o ciclo da operação: encontra pools de liquidez, dá um sinal no seu rompimento, calcula imediatamente Entry, Stop Loss e três alvos, e mostra no painel as estatísticas e os resultados da validação em dados novos. O sist
Gann Made Easy
Oleg Rodin
4.84 (174)
Gann Made Easy é um sistema de negociação Forex profissional e fácil de usar, baseado nos melhores princípios de negociação usando a teoria do sr. W. D. Gann. O indicador fornece sinais precisos de COMPRA e VENDA, incluindo níveis de Stop Loss e Take Profit. Você pode negociar mesmo em movimento usando notificações PUSH. Entre em contato comigo após a compra para receber instruções de negociação e ótimos indicadores extras gratuitamente! Provavelmente você já ouviu muitas vezes sobre os métodos
Tokyo mt4 Indicator
Vasiliy Strukov
5 (9)
O Tokyo Indicator oferece uma visão geral visual e clara da direção da tendência, de possíveis sinais de negociação e das condições de mercado. Sua linha de tendência em degraus e codificada por cores diferencia as fases de alta (em azul) das fases de baixa (em magenta). Setas direcionais correspondentes destacam possíveis oportunidades de compra e venda quando a tendência exibida muda. Um painel integrado reúne o sinal atual, a tendência do mercado (viés), o momentum, a volatilidade e a qualid
Elliott Live é um indicador para MetaTrader 5 que marca automaticamente as ondas de Elliott, tanto no histórico quanto na vela atual. As ondas concluídas são desenhadas com linha contínua; a onda em formação, com linha pontilhada e um ponto de interrogação (por exemplo, "3?"), junto com os alvos de Fibonacci e o nível de invalidação. MT5-version:  https://www.mql5.com/en/market/product/200604 Como funciona Primeiro o indicador constrói os swings (ZigZag). Uma reversão é registrada quando o preç
Gold Channel   é um indicador baseado na volatilidade, desenvolvido com um algoritmo de tempo especifico para o par XAUUSD que consiste em encontrar possíveis correções no mercado. Este indicador mostra duas linhas exteriores, uma interior (linha de retração) e um sinal de seta, onde a teoria do canal consiste em ajudar a identificar condições de sobrecompra e sobrevenda no mercado. O preço do mercado cairá geralmente entre os limites do canal. Se os preços tocarem ou se moverem para fora do can
Follow Trend Steps Follow Trend Steps: See Your Price Zones Before the Market Moves Plan your trades around clear price zones, not guesswork. Follow Trend Steps draws clean, color-coded zones directly on your chart, showing where price has recently turned and where it may react again, so you can plan entries, exits and risk with confidence. Available for Meta Trader 4 and Meta Trader 5. Why traders use Follow Trend Steps Every chart is full of noise. Support and resistance lines are drawn diff
Este indicador mostra a força relativa de 8 moedas principais: USD, EUR, GBP, AUD, NZD, CAD, CHF e JPY. O valor da força é normalizado no intervalo 0-100: Um valor superior a 60 significa forte. Uma leitura abaixo de 40 indica fraqueza. O princípio básico Dadas oito moedas, USD,EUR,GBP,AUD,NZD,CAD,CHF,JPY, onde cada par de duas pode ser combinado, resultando num total de 28 pares, um algoritmo reverso é usado para extrair a força das oito moedas. desses 28 pares EURUSD,GBPUSD,AUDUSD,NZDUSD, USD
Mais do autor
Indicator Description If you need to know future volatility for trading, this indicator is what you need! With the Predictor of the ATR you trading system will be more perfect. This indicator predicts future volatility, and does it quite well. Prediction accuracy is up to 95% at a distance of up to 5 bars into the future (on the period H1). The average forecast accuracy is about 85%, the number of predicted bars is limited by your imagination only. There are five methods used for prediction. The
FREE
Predictor of the bars
Maxim Romanov
2.5 (2)
Indicator Description This is a one-of-a-kind indicator. It predicts future bars using the theory of cyclical behavior of prices and certain market stationarity. This indicator will help you predict 1 or more future bars, thus providing a picture of the possible development of the market situation. It is based on 5 prediction methods. The first method is the Fourier transform, while the other ones are represented by different variations of linear prediction methods. You can select which method w
FREE
Description I think, almost all traders dream about non-lagging MA. I have realized that dream in my indicator. It allows forecasting future MA values! The indicator can be used in four different ways: The first one - forecast for the desired amount of bars. Thus, you are able to evaluate future price behavior. The second one - generating non-lagging "averages". That can be implemented by moving MA back by the half of the averaging period and setting the forecast the necessary amount of bars ahe
FREE
As we know, МТ4 and МТ5 do not store tick history, which may be necessary to develop trading strategies and market analysis. I have developed a method allowing you to receive tick history very easily. The indicator gathers tick history in real time and writes it to XXXXXX2.hst file, where XXXXXX is a symbol name. This file can be used to create an offline chart or something else. If you use a trading robot, then launch the indicator and control your broker by examining the spread and quotes. All
FREE
If an Expert Advisor cannot make profit on any instrument or any timeframe, it is a bad Expert Advisor. This algorithm used the regularities inherent to any market. You can adjust this EA for working on virtually any instrument, or even on all of them at once, it all depends on your trading style. The algorithm determines the reversal points with a certain probability based on the statistical data. The market is considered to be a random process. A random process has a normal distribution of pro
FREE
Filtro:
trick 86
791
trick 86 2024.01.18 19:09 

O usuário não deixou nenhum comentário para sua avaliação

Maxim Romanov
13308
Resposta do desenvolvedor Maxim Romanov 2024.01.19 10:02
Hello. I do not currently endorse these products, which is why they are listed for free. If you want to make changes, I can send you the source code of the indicator.
votija.63
403
votija.63 2023.04.18 20:06 

nO fUNCIONA

Responder ao comentário