Scalping PullBack Signal
- Indicators
- Quang Huy Quach
- Version: 1.4
1. Overview
The Scalping PullBack Signal indicator is a powerful technical analysis tool designed to help traders identify scalping opportunities based on potential pullback and reversal signals. This tool is particularly useful on lower timeframes (below 15 minutes) but can also be applied on higher timeframes for longer-term trades.
This indicator integrates several key analytical components, providing a comprehensive view of trends and potential entry/exit points, helping you make quick and effective trading decisions.
2. Key Features
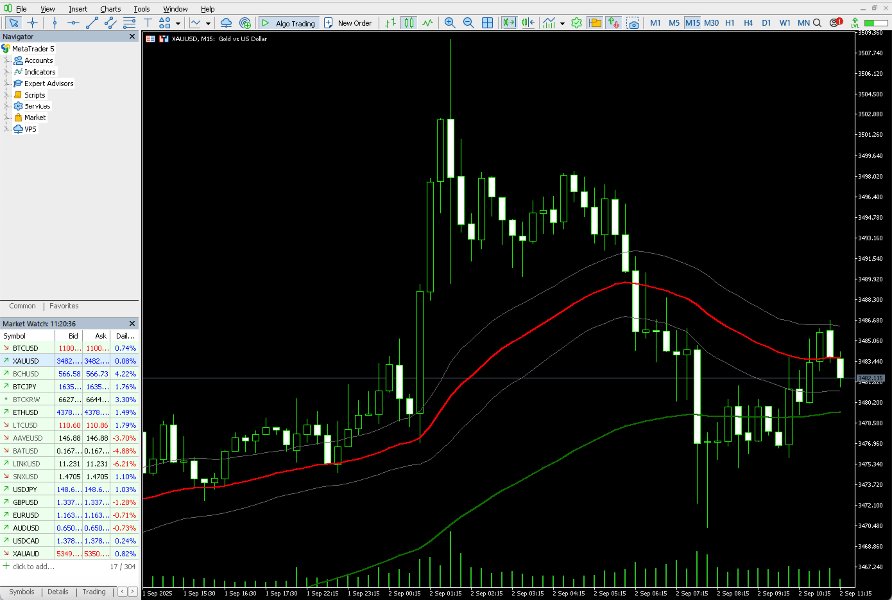
- EMA Ribbon: Displays three important EMAs (default 89, 200, 600) to help identify the main trend and dynamic support/resistance zones.
- Price Action Channel (PAC): Created by the 34-period EMA of high, low, and close prices, the PAC acts as a dynamic channel, indicating price areas where price action might change direction.
- Fractals: Identifies Fractal points (tops/bottoms) on the chart, helping to recognize potential support/resistance levels and market structure.
- HH, LH, LL, HL Finder: Automatically identifies Higher Highs, Lower Highs, Lower Lows, and Higher Lows, supporting trendline drawing and market structure shifts.
- Colored Bar Highlighting: Candlesticks are colored based on their closing price relative to the PAC (blue when closing above PAC, red when closing below PAC, gray when closing within PAC).
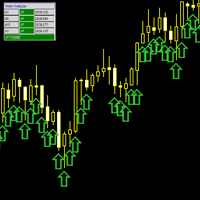
- Alert Arrows: Displays green (buy) and maroon (sell) arrows on the chart when potential pullback/reversal signals occur.
- Heikin Ashi Candle Option: Allows the indicator to perform calculations based on Heikin Ashi (HA) candle data for a smoother trend view, even if you are viewing a regular candlestick chart.
- Diverse Alert System: Provides alert options via pop-up, push notification, email, and sound when buy/sell signals are generated.
3. How It Works (Core Logic)
The indicator operates based on a combination of moving averages and price channels to identify trends and pullback points:
-
Trend Identification:
- Uptrend: When the fast EMA (89) and the PAC are above the medium EMA (200).
- Downtrend: When the fast EMA (89) and the PAC are below the medium EMA (200).
- Transition: When the above conditions are not met, the market is in a transition phase or ranging.
-
Pullback Definition: A pullback is defined as when the price starts from outside the PAC, then pulls back into the PAC and closes on the opposite side of the PAC centerline.
-
Signal Generation:
- Buy Signal: Occurs in an uptrend when the price pulls back into the PAC and then recovers, closing above the PAC centerline.
- Sell Signal: Occurs in a downtrend when the price pulls back into the PAC and then recovers, closing below the PAC centerline.
4. How to Interpret Signals & Apply in Trading
This indicator is designed as a decision-support tool, not an automated trading system. Always combine its signals with your own analysis and other tools.
-
Trading with the Trend:
- When the price is above the PAC (blue bars), you should only look for Buy opportunities when the price pulls back to the PAC.
- When the price is below the PAC (red bars), you should only look for Sell opportunities when the price pulls back to the PAC.
-
Signal Confirmation:
- When the price enters the PAC, look for mini trendlines by using Fractal and HH/LL/HL/LL points to guide your drawing.
- Buy/Sell signals appear when the pullback breaks the mini trendline you've drawn. This is a potential entry point for a scalping trade.
- Look for strong, momentum-driven continuation signals around the PAC's 34-period EMA.
-
Other EMAs: The 89, 200, 600 EMAs can be used to check for deeper pullbacks when the PAC's 34-period EMA is broken.
-
Risk Management: Scalping is a high-risk strategy. Always use strict risk management, setting appropriate stop-loss and take-profit levels.
5. Indicator Settings (Inputs)
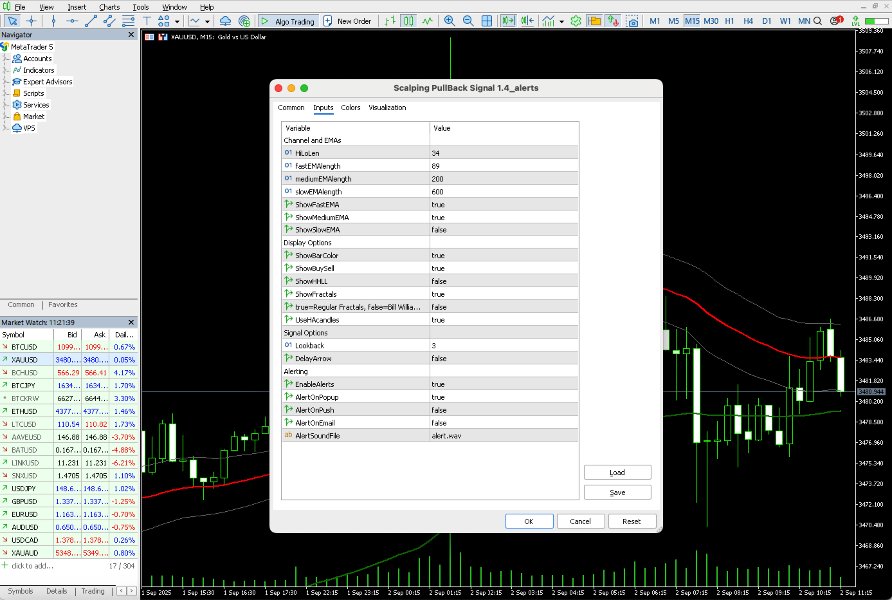
You can customize the indicator through its input parameters:
"Channel and EMAs" Group
- HiLoLen (default: 34): Length (period) of the EMA used to calculate the Price Action Channel (PAC).
- fastEMAlength (default: 89): Length of the fast EMA.
- mediumEMAlength (default: 200): Length of the medium EMA.
- slowEMAlength (default: 600): Length of the slow EMA.
- ShowFastEMA (default: true): Displays the fast EMA line.
- ShowMediumEMA (default: true): Displays the medium EMA line.
- ShowSlowEMA (default: false): Displays the slow EMA line.
"Display Options" Group
- ShowBarColor (default: true): Displays candlestick colors based on PAC.
- ShowBuySell (default: true): Displays Buy/Sell arrows.
- ShowHHLL (default: false): Displays HH/LH/LL/HL labels on the chart.
- ShowFractals (default: true): Displays Fractal points.
- filterBW (default: false): If true , displays only regular Fractals. If false , displays Fractals according to Bill Williams' definition (standard).
- UseHAcandles (default: true): Uses Heikin Ashi data for indicator calculations, even if the chart displays regular candlesticks. This helps smooth out signals.
"Signal Options" Group
- Lookback (default: 3): Maximum number of bars to check for pullback conditions (checks if price pulled back into PAC within this period).
- DelayArrow (default: false): If true , alert arrows will only appear on fully closed candlesticks.
"Alerting" Group
- EnableAlerts (default: true): Master switch to enable/disable all alert types.
- AlertOnPopup (default: true): Activates pop-up alerts on the MT5 terminal.
- AlertOnPush (default: false): Activates push notifications to the MT5 mobile app (requires MetaQuotes ID configuration).
- AlertOnEmail (default: false): Activates email alerts (requires SMTP server configuration).
- AlertSoundFile (default: "alert.wav"): Name of the sound file to play when an alert is triggered (file must be in MT5's Sounds folder).
6. Important Notes & Risk Disclaimer
- No Profit Guarantee: Trading in financial markets involves substantial risk and can lead to capital loss. Past performance is not a reliable indicator of future results. This indicator is an analytical support tool, not financial advice or a guarantee of profit.
- Support Tool: The Scalping PullBack Signal indicator is a decision-support tool. It does not replace your own market analysis, risk management, and trading discipline.
- Customization: Default values are provided for reference only. You should experiment and optimize input parameters to suit your trading style and chosen currency pairs/timeframes.
- Unimplemented Features:
- The colored chart background feature (as in the original Pine Script version) is not implemented in this MQL5 version due to performance considerations and complexity in managing graphical objects.
- The stricter "Regular Fractal" filter is not implemented; this version uses the standard Bill Williams fractal definition.
7. Installation Guide
To install this indicator in your MetaTrader 5:
- Open MetaTrader 5.
- Go to File -> Open Data Folder .
- Open the MQL5 -> Indicators folder.
- Copy the ScalpingPullBackToolR1.3.mq5 file into this folder.
- Close and reopen MetaTrader 5, or right-click on Indicators in the Navigator window and select Refresh .
- The indicator will appear in the Indicators list under the Custom section.
- Drag and drop the indicator onto the chart you wish to use.
Happy trading!

