ATR Dynamic Stop
- Indicators
- Quang Huy Quach
- Version: 1.17
1. Overview
The ATR Dynamic Stop (CE) is a powerful technical indicator designed to help traders identify and follow market trends. Its core function is to provide a dynamic trailing stop-loss based on price volatility, as measured by the Average True Range (ATR) indicator.
The main objectives of the ATR Dynamic Stop are:
- Profit Optimization: It helps you ride a strong trend by setting a reasonable stop-loss, preventing premature exits due to minor market noise and fluctuations.
- Risk Management: It provides a clear exit signal when the trend shows signs of reversal, helping to protect your capital and accumulated profits.
This indicator works effectively on all timeframes and with any trading instrument.
2. How It Works
The indicator plots two main lines on the chart, but only one is visible at any given time:
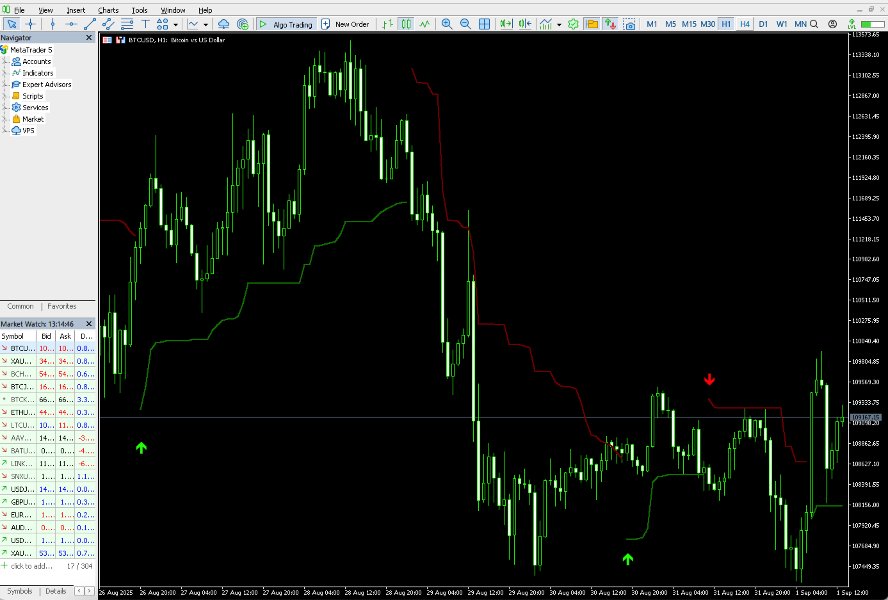
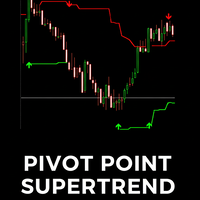
- Long Stop Line (Green): Drawn below the price when the market is in an uptrend. It is calculated by taking the highest high over a specific period and subtracting a multiple of the ATR value.
- Short Stop Line (Red): Drawn above the price when the market is in a downtrend. It is calculated by taking the lowest low over a specific period and adding a multiple of the ATR value.
As the price moves favorably with the trend, this line will follow it, much like a chandelier hanging from the ceiling (the highest high) or placed on the floor (the lowest low), hence the name ATR Dynamic Stop.
3. Interpretation and Trading Applications
The ATR Dynamic Stop provides clear and visual signals to help you make objective trading decisions.
A. Trend Identification
This is the most straightforward use:
- When the green line appears and the price moves above it -> The market is in an uptrend.
- When the red line appears and the price moves below it -> The market is in a downtrend.
B. Exit Signals (Primary Function)
This is the core and most powerful use of the indicator.
- Exit Long Position: When you are in a long position and the price crosses below the green Long Stop line, it is a strong signal that the uptrend has weakened and may be reversing. This is the time to consider closing the long position.
- Exit Short Position: When you are in a short position and the price crosses above the red Short Stop line, it signals that the downtrend has ended. This is the time to consider closing the short position.
C. Entry Signals
The change in the line's color can also be used as a potential entry signal.
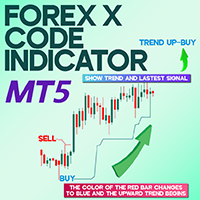
- Buy Signal: When the line changes from red to green, accompanied by a green Buy arrow. This indicates that sellers have lost momentum and a new uptrend may be starting.
- Sell Signal: When the line changes from green to red, accompanied by a red Sell arrow. This indicates that buyers have weakened and a new downtrend may be starting.
Important Note: Like any other indicator, the ATR Dynamic Stop is not a "holy grail". To increase the probability of success, you should combine signals from the ATR Dynamic Stop with other analysis methods, such as:
- Price Action analysis.
- Key support and resistance levels.
- Other trend-confirming indicators (e.g., Moving Averages, MACD).
4. Explanation of Input Parameters
The indicator provides a full range of options that you can customize to fit your trading style.
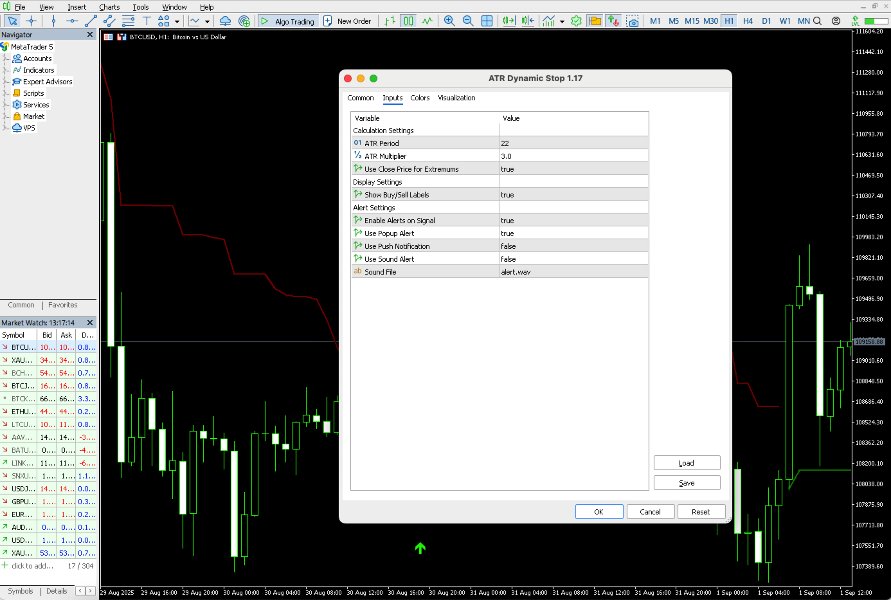
Calculation Settings
- ATR Period (Default: 22): The period used to calculate the ATR value.
- Increasing this value will make the stop line smoother and further from the price, making it less sensitive to volatility (suitable for following long-term trends).
- Decreasing this value will make the stop line track the price more closely and be more sensitive (suitable for short-term trading or catching smaller waves).
- ATR Multiplier (Default: 3.0): The multiplier for the ATR value.
- Increasing this value (e.g., 3.5, 4.0) will push the stop line further away from the price, giving the trend more "room to breathe" before signaling an exit.
- Decreasing this value (e.g., 2.0, 2.5) will pull the stop line closer to the price, creating a tighter stop-loss.
- Use Close Price for Extremums (Default: true):
- true (Enabled): The indicator will use the highest/lowest close price for calculations. This helps reduce the impact of sudden price wicks/spikes, making the stop line more stable.
- false (Disabled): The indicator will use the traditional highest High / lowest Low.
Display Settings
- Show Buy/Sell Labels (Default: true): Enables or disables the display of the Buy/Sell arrows on the chart.
Alert Settings
- Enable Alerts on Signal (Default: true): Enables or disables the entire alert functionality.
- Use Popup Alert (Default: true): Enable/disable popup alerts.
- Use Push Notification (Default: false): Enable/disable push notifications to the MT5 mobile app. (Requires configuration in MetaTrader).
- Use Sound Alert (Default: false): Enable/disable sound alerts.
- InpAlertSoundFile : The name of the sound file to be played.
5. Risk Disclaimer
Trading on financial markets carries a high level of risk and may not be suitable for all investors. The high degree of leverage can work against you as well as for you. Before deciding to trade, you should carefully consider your investment objectives, level of experience, and risk appetite.
The possibility exists that you could sustain a loss of some or all of your initial investment and therefore you should not invest money that you cannot afford to lose. You should be aware of all the risks associated with trading and seek advice from an independent financial advisor if you have any doubts. This indicator is an analysis tool and does not provide investment advice. All trading decisions are your own responsibility. Past performance is not indicative of future results.
