ATR Dynamic Stop

1. Overview

The ATR Dynamic Stop (CE) is a powerful technical indicator designed to help traders identify and follow market trends. Its core function is to provide a dynamic trailing stop-loss based on price volatility, as measured by the Average True Range (ATR) indicator.

The main objectives of the ATR Dynamic Stop are:

  • Profit Optimization: It helps you ride a strong trend by setting a reasonable stop-loss, preventing premature exits due to minor market noise and fluctuations.
  • Risk Management: It provides a clear exit signal when the trend shows signs of reversal, helping to protect your capital and accumulated profits.

This indicator works effectively on all timeframes and with any trading instrument.

2. How It Works

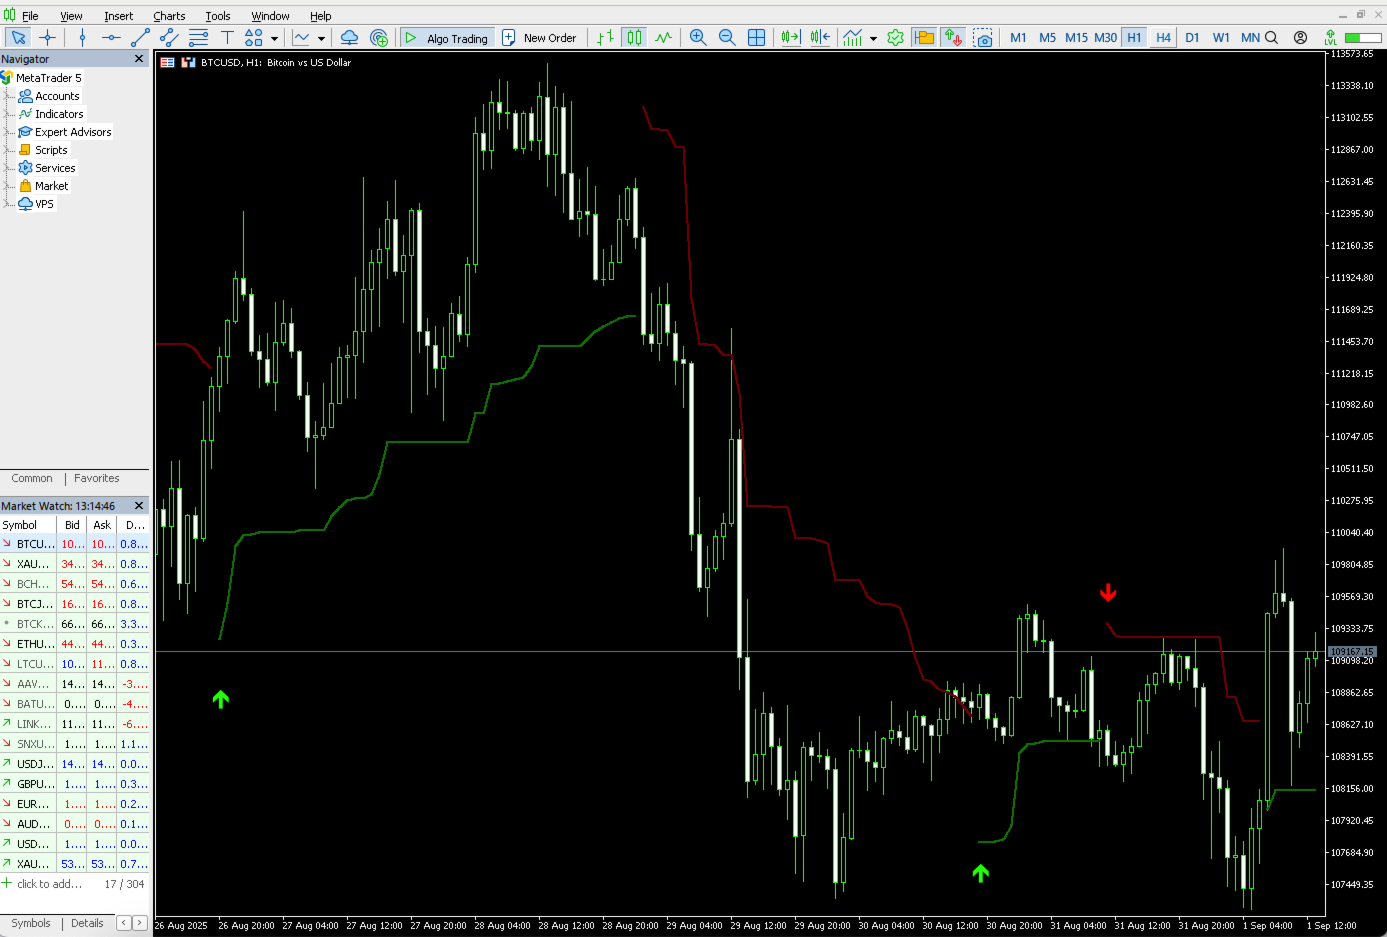
The indicator plots two main lines on the chart, but only one is visible at any given time:

  • Long Stop Line (Green): Drawn below the price when the market is in an uptrend. It is calculated by taking the highest high over a specific period and subtracting a multiple of the ATR value.
  • Short Stop Line (Red): Drawn above the price when the market is in a downtrend. It is calculated by taking the lowest low over a specific period and adding a multiple of the ATR value.

As the price moves favorably with the trend, this line will follow it, much like a chandelier hanging from the ceiling (the highest high) or placed on the floor (the lowest low), hence the name ATR Dynamic Stop.

3. Interpretation and Trading Applications

The ATR Dynamic Stop provides clear and visual signals to help you make objective trading decisions.

A. Trend Identification

This is the most straightforward use:

  • When the green line appears and the price moves above it -> The market is in an uptrend.
  • When the red line appears and the price moves below it -> The market is in a downtrend.

B. Exit Signals (Primary Function)

This is the core and most powerful use of the indicator.

  • Exit Long Position: When you are in a long position and the price crosses below the green Long Stop line, it is a strong signal that the uptrend has weakened and may be reversing. This is the time to consider closing the long position.
  • Exit Short Position: When you are in a short position and the price crosses above the red Short Stop line, it signals that the downtrend has ended. This is the time to consider closing the short position.

C. Entry Signals

The change in the line's color can also be used as a potential entry signal.

  • Buy Signal: When the line changes from red to green, accompanied by a green Buy arrow. This indicates that sellers have lost momentum and a new uptrend may be starting.
  • Sell Signal: When the line changes from green to red, accompanied by a red Sell arrow. This indicates that buyers have weakened and a new downtrend may be starting.

Important Note: Like any other indicator, the ATR Dynamic Stop is not a "holy grail". To increase the probability of success, you should combine signals from the ATR Dynamic Stop with other analysis methods, such as:

  • Price Action analysis.
  • Key support and resistance levels.
  • Other trend-confirming indicators (e.g., Moving Averages, MACD).

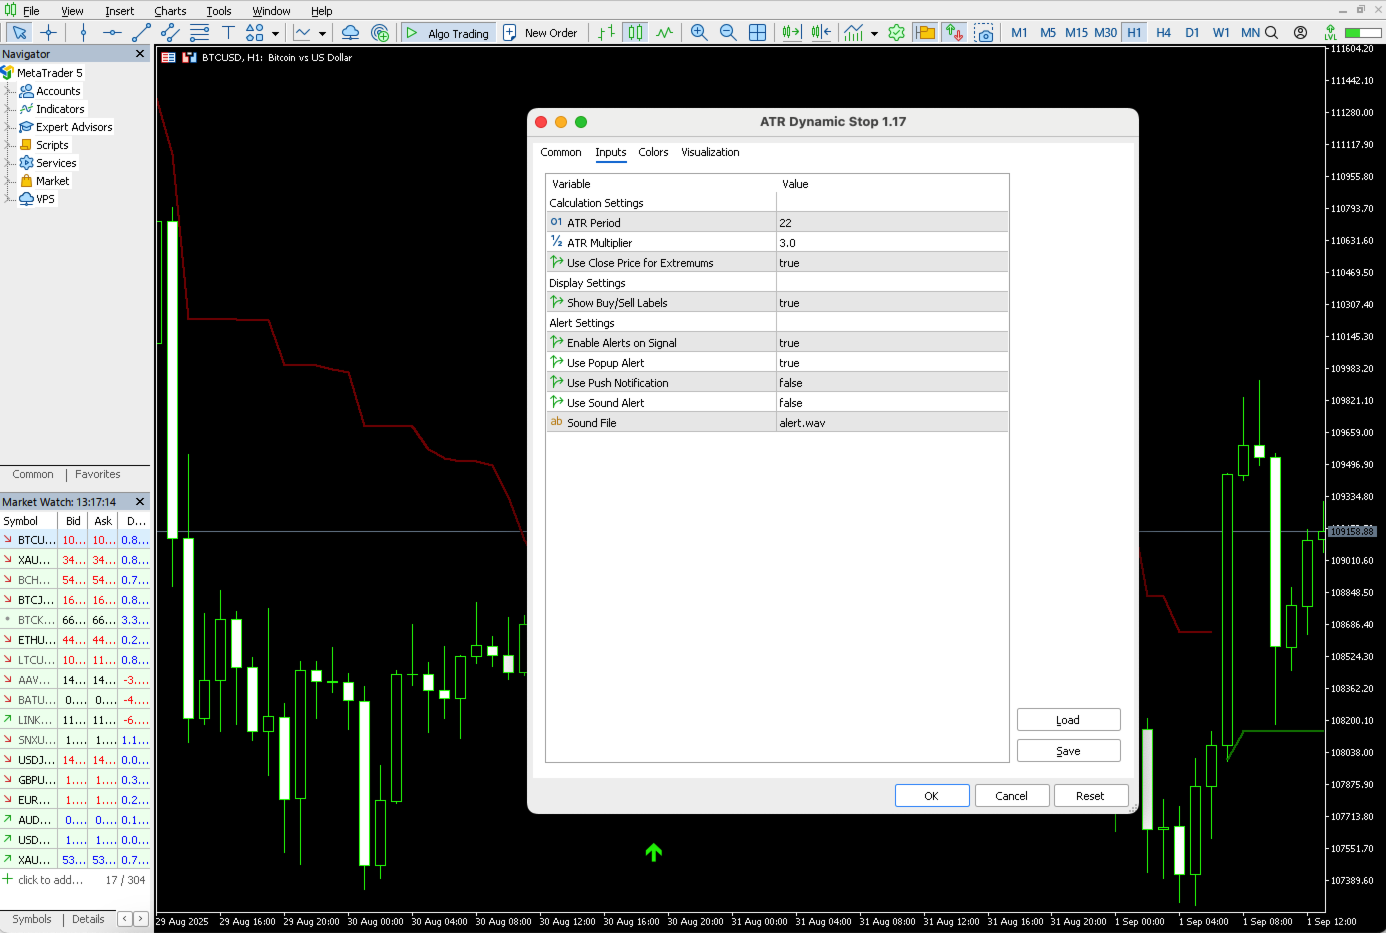
4. Explanation of Input Parameters

The indicator provides a full range of options that you can customize to fit your trading style.

Calculation Settings

  • ATR Period (Default: 22): The period used to calculate the ATR value.
    • Increasing this value will make the stop line smoother and further from the price, making it less sensitive to volatility (suitable for following long-term trends).
    • Decreasing this value will make the stop line track the price more closely and be more sensitive (suitable for short-term trading or catching smaller waves).
  • ATR Multiplier (Default: 3.0): The multiplier for the ATR value.
    • Increasing this value (e.g., 3.5, 4.0) will push the stop line further away from the price, giving the trend more "room to breathe" before signaling an exit.
    • Decreasing this value (e.g., 2.0, 2.5) will pull the stop line closer to the price, creating a tighter stop-loss.
  • Use Close Price for Extremums (Default: true):
    • true (Enabled): The indicator will use the highest/lowest close price for calculations. This helps reduce the impact of sudden price wicks/spikes, making the stop line more stable.
    • false (Disabled): The indicator will use the traditional highest High / lowest Low.

Display Settings

  • Show Buy/Sell Labels (Default: true): Enables or disables the display of the Buy/Sell arrows on the chart.

Alert Settings

  • Enable Alerts on Signal (Default: true): Enables or disables the entire alert functionality.
  • Use Popup Alert (Default: true): Enable/disable popup alerts.
  • Use Push Notification (Default: false): Enable/disable push notifications to the MT5 mobile app. (Requires configuration in MetaTrader).
  • Use Sound Alert (Default: false): Enable/disable sound alerts.
  • InpAlertSoundFile : The name of the sound file to be played.

5. Risk Disclaimer

Trading on financial markets carries a high level of risk and may not be suitable for all investors. The high degree of leverage can work against you as well as for you. Before deciding to trade, you should carefully consider your investment objectives, level of experience, and risk appetite.

The possibility exists that you could sustain a loss of some or all of your initial investment and therefore you should not invest money that you cannot afford to lose. You should be aware of all the risks associated with trading and seek advice from an independent financial advisor if you have any doubts. This indicator is an analysis tool and does not provide investment advice. All trading decisions are your own responsibility. Past performance is not indicative of future results.

Рекомендуем также
Free automatic Fibonacci is an indicator that automatically plots a Fibonacci retracement based on the number of bars you select on the BarsToScan setting in the indicator. The Fibonacci is automatically updated in real time as new highest and lowest values appears amongst the selected bars. You can select which level values to be displayed in the indicator settings. You can also select the color of the levels thus enabling the trader to be able to attach the indicator several times with differe
FREE
Развитие предыдущей версии индикатора  ZigZag WaveSize MT4 ZigZag WaveSize -  модифицированный стандартный индикатор ZigZag с добавлением информации о длине волны в пунктах, уровней и разной логики алертов Общие улучшения: Адаптация кода под MetaTrader 5 Оптимизирована работа с графическими объектами Новое: Горизонтальные уровни на экстремумах Выбор типа уровней: горизонт/лучи/отрезки Фильтр ликвидных уровней (не пробитых ценой) Буфер для пробоев: настройка чувствительности к ложным пробоям На
FREE
Hunt markets with Hunttern ZigZag . Easy to use with one parameter    You can use it for the following:       -Classic patterns       -Heads and shoulders       -Harmonic patterns       -Elliott Wave       -Support and resistance       -Supply and Demand Single parameter:      -Period (1-120) Features:        -Candle time        -Single parameter        -Light mode template This is version 1 of Hunttern ZigZag. We are very happy to receive feedback from you.
FREE
PZ Penta O MT5
PZ TRADING SLU
3.5 (4)
The Penta-O is a 6-point retracement harmonacci pattern which usually precedes big market movements. Penta-O patterns can expand and repaint quite a bit. To make things easier this indicator implements a twist: it waits for a donchian breakout in the right direction before signaling the trade. The end result is an otherwise repainting indicator with a very reliable trading signal. The donchian breakout period is entered as an input. [ Installation Guide | Update Guide | Troubleshooting | FAQ | A
FREE
Auto Fibonacci Retracement Indicator — Flexible and Reliable This isn’t just another Auto Fibonacci Retracement indicator. It’s one of the most flexible and dependable tools available . If you find it useful, please consider leaving a review or comment — your feedback means a lot! Check out my other helpful tools below: Smart Alert Manager   - Set up advanced alerts and send them to Mobile, Telegram, Discord, Webhook... Timeframes Trend Scanner    - Scan the trend of assets in difference timefr
FREE
DW Levels
Aiman Saeed Salem Dahbag
DW Levels – Weekly & Daily Key Levels for MetaTrader 5 DW Levels is a lightweight and precise MetaTrader 5 indicator designed to display the most important weekly and daily price levels directly on the chart. It helps traders quickly identify strong support and resistance zones based on previous week data and the last completed daily candle . Indicator Features Previous Week High (PWH) Previous Week Low (PWL) Last Daily Candle High Last Daily Candle Low All levels are calculated using completed
FREE
The Zigzag Price Arrow indicator is an enhanced version of the classic Zigzag indicator, combining the traditional zigzag pattern with advanced visual features. It not only identifies major market turning points but also provides clear trading signals through: • Directional arrows: Displays colored arrows (green for buy, magenta for sell) indicating potential trend directions. • Price labels: Shows the exact price values at each pivot point directly on the chart. • Improved visual clarity: Make
FREE
Donchian Pro
Paulo Henrique Faquineli Garcia
5 (3)
The Donchian Channel Channels are among the most popular tools of technical analysis, as they visually convey to the analyst the limits within which most price movement tends to occur. Channel users know that valuable information can be obtained at any time, whether prices are in the central region of a band or close to one of the border lines. One of the best known techniques to explore these concepts is Bollinger Bands. However, John Bollinger was not the only one to research the application
FREE
Necessary for traders: tools and indicators Waves automatically calculate indicators, channel trend trading Perfect trend-wave automatic calculation channel calculation , MT4 Perfect trend-wave automatic calculation channel calculation , MT5 Local Trading copying Easy And Fast Copy , MT4 Easy And Fast Copy , MT5 Local Trading copying For DEMO Easy And Fast Copy , MT4 DEMO Easy And Fast Copy , MT5 DEMO The homeopathic indicator is also called the CCI indicator. The CCI indicator was proposed
FREE
Follow The Line MT5
Oliver Gideon Amofa Appiah
4.6 (35)
This indicator obeys the popular maxim that: "THE TREND IS YOUR FRIEND" It paints a GREEN line for BUY and also paints a RED line for SELL. (you can change the colors). It gives alarms and alerts of all kinds. IT DOES NOT REPAINT and can be used for all currency pairs and timeframes. Yes, as easy and simple as that. Even a newbie can use it to make great and reliable trades. NB: For best results, get my other premium indicators for more powerful and reliable signals. Get them here: https://www.m
FREE
Basic Harmonic Pattern MT5
Mehran Sepah Mansoor
4.79 (87)
Этот индикатор определяет наиболее популярные гармонические паттерны, которые предсказывают точки разворота рынка. Эти гармонические паттерны представляют собой ценовые формации, которые постоянно повторяются на рынке Форекс и указывают на возможные будущие движения цены /   Бесплатная версия MT4 Кроме того, данный индикатор имеет встроенный сигнал входа в рынок, а также различные тейк-профиты и стоп-лоссы. Следует отметить, что хотя индикатор гармонических паттернов может сам по себе давать с
FREE
Индикатор подчёркивает те моменты, которые профессиональный трейдер видит в обычных индикаторах. VisualVol визуально отображает разные показатели волатильности в единой шкале и общем масштабе. Подчёркивает цветом превышение показателей объёма. Одновременно могут быть отображены Тиковый и Реальный Объем, Действительный диапазон, ATR, размер свечи и ретурнс (разница open-close). Благодаря VisualVol вы увидите рыночные периоды и подходящее время для разных торговых операций. Эта версия предназначен
FREE
Индикатор временных рамок Wormhole для MetaTrader 5 (MT5) — это не просто еще один инструмент для торговли, это ваше конкурентное преимущество на финансовых рынках. Разработанный как для начинающих, так и для профессиональных трейдеров, Wormhole изменяет подход к анализу данных и принятию решений, помогая вам всегда быть на шаг впереди. Почему вам нужен (бесплатный) индикатор Wormhole Перехитрите конкурентов: Возможность отображать две временные рамки на одном графике одновременно означает, что
FREE
Индикатор   "Haven Key Levels PDH PDL"   помогает трейдерам визуализировать ключевые уровни на графике. Он автоматически отмечает следующие уровни: DO (Daily Open)   — уровень открытия дня. NYM (New York Midnight)   — уровень полуночи Нью-Йорка. PDH (Previous Day High)   — максимум предыдущего дня. PDL (Previous Day Low)   — минимум предыдущего дня. WO (Weekly Open)   — уровень открытия недели. MO (Monthly Open)   — уровень открытия месяца. PWH (Previous Week High)   — максимум предыдущей недел
FREE
MACD Enhanced
Nikita Berdnikov
5 (3)
Представляем   MACD  Enhanced  – усовершенствованный индикатор MACD (Moving Average Convergence Divergence), который предоставляет трейдерам расширенные возможности для анализа тренда и момента на финансовых рынках. Индикатор использует разницу между быстрой и медленной экспоненциальными скользящими средними для определения импульса, направления и силы тренда, создавая четкие визуальные сигналы для потенциальных точек входа и выхода. Внимание!   Для достижения наилучших результатов рекомендуется
FREE
Bollinger Bands B
Flavio Javier Jarabeck
4.25 (4)
John Bollinger created this indicator in 2010 as a way to read the original indicator (Bollinger Bands) in a more "technical" way, shown as an oscillator. The typical range of the Bollinger Bands %B is 0 - 0.5 - 1.0, where "0" represents the lower band, the "0.5" the middle band, and "1" the upper band. The line on the indicator represents the Closing prices. As simple as that. SETTINGS Bollinger Bands period of analysis Standard Deviation multiplier Shift Price type to be analyzed If you like
FREE
Candle Detector By Mahefa R. General Description Candle Detector is an advanced technical indicator for MetaTrader 5 , designed to automatically detect and highlight the most important Japanese candlestick patterns directly on the price chart . It allows traders to quickly identify market reversal and continuation setups without visual clutter. The indicator recolors only the candles that match the selected pattern , ensuring a clear, accurate, and professional chart analysis . ️ How It Work
FREE
Fibonacci Moving Averages
Brendan Jonathan Stoyanowski-campbell
2 (1)
OVERVIEW The Fibonacci Moving Averages are a toolkit which allows the user to configure different types of Moving Averages based on key Fibonacci numbers. Moving Averages are used to visualise short-term and long-term support and resistance which can be used as a signal where price might continue or retrace. Moving Averages serve as a simple yet powerful tool that can help traders in their decision-making and help foster a sense of where the price might be moving next. The aim of this scrip
FREE
RSI abcd
Francisco Gomes Da Silva
3 (1)
RSI ABCD Pattern Finder: Technical Strategy 1. How the Indicator Works Combines the classic RSI with automatic detection of ABCD harmonic patterns . Key Components Standard RSI (adjustable period) Peak and Trough Markers (arrows) ABCD Patterns (green/red lines) Overbought (70) and Oversold (30) Filters 2. MT5 Setup period = 14 ; // RSI period size = 4 ; // Maximum pattern size OverBought = 70 ; // Overbought level OverSold = 30 ; // Oversold level Filter = USE_FILTER_ YES ; // Confirmation filte
FREE
Value Chart Candlesticks
Flavio Javier Jarabeck
4.69 (13)
The idea of a Value Chart indicator was presented in the very good book I read back in 2020 , " Dynamic Trading Indicators: Winning with Value Charts and Price Action Profile ", from the authors Mark Helweg and David Stendahl. The idea is simple and the result is pure genius: Present candlestick Price analysis in a detrended way! HOW TO READ THIS INDICATOR Look for Overbought and Oversold levels. Of course, you will need to test the settings a lot to find the "correct" one for your approach. It
FREE
Raymond Cloudy Day Indicator for MT5 – Pivot-Based Reversal and Trend Levels Raymond Cloudy Day Indicator is a pivot-based level indicator for MetaTrader 5 (MT5). It was developed by Ngo The Hung based on Raymond’s original idea and is designed to give a structured view of potential reversal zones, trend extensions and support/resistance levels directly on the chart. The default settings are optimised for XAUUSD on the H1 timeframe, but the indicator can be tested and adjusted for other symbols
FREE
Weis Waves
Flavio Javier Jarabeck
2.83 (18)
The original author is David Weis, an expert in the Wyckoff Method. The Weis Wave is a modern adaptation of the 1930's Wyckoff Method, another expert in Tape Reading techniques and Chart Analysis. Weis Waves takes market volume and stacks it into waves according to price conditions giving the trader valuable insights about the market conditions. If you want to learn more about this subject you can find tons of videos in YouTube. Just look for "The Wickoff Method", "Weis Wave" and "Volume Spread
FREE
This indicator is an automated version of the Fibonacci retracement (Fib) indicator. Deciding the best areas to use when drawing the fib can be tricky and this  indicator was made with that in mind. When you drop it on the chart it will automatically choose the best points to draw the fib with, but in case you aren't satisfied with those regions, you can adjust it as you wish.
FREE
Are you tired of drawing trendlines every time you're analyzing charts? Or perhaps you would like more consistency in your technical analysis. Then this is for you. This indicator will draw trend lines automatically when dropped on a chart. How it works Works similar to standard deviation channel found on mt4 and mt5. It has 2 parameters: 1. Starting Bar 2. Number of bars for calculation The   starting bar   is the bar which drawing of the trend lines will begin, while the   number of bars for c
FREE
Indicator and Expert Adviser  EA Available in the comments section of this product. Download with Indicator must have indicator installed for EA to work. Mt5 indicator alerts for bollinger band and envelope extremes occurring at the same time. Buy signal alerts occur when A bullish candle has formed below both the lower bollinger band and the lower envelope  Bar must open and close below both these indicators. Sell signal occur when A bear bar is formed above the upper bollinger band and upper
FREE
Spike Catch Pro 22:03 release updates Advanced engine for searching trade entries in all Boom and Crash pairs (300,500 and 1000) Programmed strategies improvements Mx_Spikes (to combine Mxd,Mxc and Mxe), Tx_Spikes,   RegularSpikes,   Litho_System,   Dx_System,   Md_System,   MaCross,   Omx_Entry(OP),  Atx1_Spikes(OP),   Oxc_Retracement (AT),M_PullBack(AT) we have added an arrow on strategy identification, this will help also in the visual manual backtesting of the included strategies and see ho
FREE
Bar Color Trend
Germano Chagas
4.38 (8)
Combining the best of Price Action , Directional Movement , and Divergence/Convergence analysis, Candle Color Trend is a easy and reliable way to identify trend direction. The indicator automatically paints the candles according to the assumption that an uptrend is defined by prices that form a series of higher highs and higher lows. In contrast, a downtrend is defined by prices that form a series of lower highs and lower lows. Additionally, ADX Wilder indicator is used to measure trend weakness
FREE
Auto Fib Retracements
Ross Adam Langlands Nelson
4.2 (5)
Automatic Fibonacci Retracement Line Indicator. This indicator takes the current trend and if possible draws Fibonacci retracement lines from the swing until the current price. The Fibonacci levels used are: 0%, 23.6%, 38.2%, 50%, 61.8%, 76.4%, 100%. This indicator works for all charts over all timeframes. The Fibonacci levels are also recorded in buffers for use by other trading bots. Any comments, concerns or additional feature requirements are welcome and will be addressed promptly. 
FREE
Fibonacci Trend Indicator for MT5 Unlock the power of Fibonacci analysis on your MetaTrader 5 charts! Our   Fibonacci Trend Indicator   automatically plots dynamic support and resistance levels so you can spot trends, reversals, and breakout opportunities at a glance. Features & Advantages Automatic Fibonacci Levels Instantly displays seven key Fibonacci retracement levels based on the highest and lowest prices from your chosen lookback period — no manual work required. Dynamic Trend Adaptatio
FREE
Statistical Arbitrage Spread Generator for Cointegration [MT5] What is Pair Trading? Pair trading is a market-neutral strategy that looks to exploit the relative price movement between two correlated assets — instead of betting on the direction of the market. The idea? When two assets that usually move together diverge beyond a statistically significant threshold, one is likely mispriced. You sell the expensive one, buy the cheap one , and profit when they converge again. It’s a statistica
FREE
С этим продуктом покупают
ARIPoint
Temirlan Kdyrkhan
1 (1)
ARIBot is a powerful trading companion designed to generate high-probability entry signals with dynamic TP/SL/DP levels based on volatility. Built-in performance tracking shows win/loss stats, PP1/PP2 hits, and success rates — all updated live. Key Features: Buy/Sell signals with adaptive volatility bands Real-time TP/SL/DP levels based on ATR Built-in MA Filter with optional ATR/StdDev volatility Performance stats panel (Success, Profit/Loss, PP1/PP2) Alerts via popup, sound, push, or email Cus
Если вы покупаете этот индикатор, вы получите мой профессиональный Trade Manager + EA БЕСПЛАТНО. Прежде всего стоит подчеркнуть, что эта торговая система является индикатором без перерисовки, без повторной отрисовки и без задержки, что делает ее идеальной как для ручной, так и для роботизированной торговли. Онлайн курс, руководство и загрузка пресетов. «Smart Trend Trading System MT5» - это комплексное торговое решение, созданное для новичков и опытных трейдеров. Он объединяет более 10 премиаль
Power Candles – Входные сигналы на основе силы для любого рынка Power Candles переносит проверенный анализ силы Stein Investments прямо на ценовой график. Вместо реакции только на цену каждая свеча окрашивается на основе реальной рыночной силы, позволяя мгновенно распознавать накопление импульса, ускорение силы и четкие смены тренда. Одна логика для всех рынков Power Candles автоматически работает со всеми торговыми инструментами . Индикатор определяет, является ли текущий символ валютной парой
Каждый покупатель этого индикатора получает дополнительно Бесплатно: Авторскую утилиту "Bomber Utility", которая автоматически сопровождает каждю торговую операцию, устанавливает уровни Стоп Лосс и Тейк профит и закрывает сделки согласно правилам этой стратегии, Сет-файлы для настройки этого индикатора на различных активах, Сет-файлы для настройки Bomber Utility в режимы: "Минимум Риска", "Взвешенный Риск" и "Стратегия Выжидания", Пошаговый видео-мануал, который поможет вам быстро установить, на
SuperScalp Pro – Продвинутая система скальпингового индикатора с множеством фильтров SuperScalp Pro — это продвинутая система скальпингового индикатора, объединяющая классический Supertrend и множество интеллектуальных подтверждающих фильтров. Индикатор эффективно работает на всех таймфреймах от M1 до H4 и особенно подходит для XAUUSD, BTCUSD и основных валютных пар. Может использоваться как самостоятельная система или гибко интегрироваться в существующие торговые стратегии. Индикатор включает б
Entry In The Zone и SMC Multi Timeframe — это инструмент для анализа рынка в реальном времени, разработанный на основе концепций Smart Money Concepts (SMC). Он создан для того, чтобы помочь трейдерам системно анализировать рыночную структуру и получать более ясное представление об общем направлении рынка. Система автоматически анализирует точки разворота, ключевые зоны и рыночную структуру на нескольких таймфреймах, отображая точки интереса (POI), сигналы без перерисовки и автоматические уровни
Azimuth Pro
Ottaviano De Cicco
5 (1)
АКЦИЯ НА ЗАПУСК Цена Azimuth Pro установлена на уровне 299$ для первых 100 покупателей. Финальная цена составит 499 $ . РАЗНИЦА МЕЖДУ РОЗНИЧНЫМИ И ИНСТИТУЦИОНАЛЬНЫМИ ВХОДАМИ — НЕ В ИНДИКАТОРЕ, А В МЕСТОПОЛОЖЕНИИ. Большинство трейдеров входят на произвольных ценовых уровнях, гонясь за импульсом или реагируя на запаздывающие сигналы. Институциональные игроки ждут, пока цена достигнет структурных уровней, где спрос и предложение действительно меняются. Azimuth Pro автоматически определяет эти у
Game Changer — это революционный трендовый индикатор, разработанный для использования с любым финансовым инструментом, который превратит ваш MetaTrader в мощный анализатор трендов. Индикатор не перерисовывается и не запаздывает. Он работает на любом таймфрейме и помогает определять тренд, сигнализирует о потенциальных разворотах, служит механизмом трейлинг-стопа и выдает оповещения в режиме реального времени для оперативной реакции рынка. Независимо от того, являетесь ли вы опытным трейдером, пр
FX Power: Анализируйте силу валют для более эффективной торговли Обзор FX Power — это ваш незаменимый инструмент для понимания реальной силы валют и золота в любых рыночных условиях. Определяя сильные валюты для покупки и слабые для продажи, FX Power упрощает принятие торговых решений и выявляет высоковероятные возможности. Независимо от того, хотите ли вы следовать за трендами или предсказывать развороты с использованием экстремальных значений дельты, этот инструмент идеально адаптируется под
Прежде всего стоит подчеркнуть, что этот торговый индикатор не перерисовывается, не перерисовывает и не отставает, что делает его идеальным как для ручной, так и для роботизированной торговли. Руководство пользователя: настройки, вводы и стратегия. Атомный аналитик - это индикатор ценового действия PA, который использует силу и импульс цены, чтобы найти лучший край на рынке. Оборудованный расширенными фильтрами, которые помогают убирать шумы и ложные сигналы, и повышают торговый потенциал. Испо
Smart Stop Indicator – Интеллектуальная точность стоп лоссов прямо на графике Обзор Smart Stop Indicator это специализированное решение для трейдеров, которые хотят устанавливать стоп лоссы чётко и методично, а не на интуитивной основе. Индикатор объединяет классическую логику прайс экшн (higher highs, lower lows) с современной системой распознавания пробоев, чтобы определить действительно логичный уровень стопа. В трендах, диапазонах или фазах резких движений он показывает оптимальные зоны SL
Прежде всего стоит подчеркнуть, что этот Торговый Инструмент является Неперерисовывающимся Нерепейнтинговым Индикатором, что делает его идеальным для профессиональной торговли. Онлайн-курс, руководство пользователя и демонстрация. Индикатор Концепций Умного Действия Цены - очень мощный инструмент как для новичков, так и для опытных трейдеров. Он объединяет более 20 полезных индикаторов в одном, комбинируя передовые торговые идеи, такие как анализ Inner Circle Trader и стратегии торговли концеп
Super Signal – Skyblade Edition Профессиональная система трендовых сигналов без перерисовки и без задержек с исключительным процентом выигрышей | Для MT4 / MT5 Лучше всего работает на младших таймфреймах, таких как 1 минута, 5 минут и 15 минут. Основные характеристики: Super Signal – Skyblade Edition — это интеллектуальная система сигналов, специально разработанная для трендовой торговли. Она использует многоуровневую фильтрацию, чтобы выявлять только сильные направленные движения, подкреплённы
Раскройте силу торговли трендами с помощью индикатора Trend Screener: вашего идеального решения для торговли трендами, основанного на нечеткой логике и мультивалютной системе! Повысьте уровень своей торговли по тренду с помощью Trend Screener, революционного индикатора тренда, основанного на нечеткой логике. Это мощный индикатор отслеживания тренда, который сочетает в себе более 13 инструментов и функций премиум-класса и 3 торговые стратегии, что делает его универсальным выбором для превращения
ARICoin is a powerful trading companion designed to generate high-probability entry signals with dynamic TP/SL/DP levels based on volatility. Built-in performance tracking shows win/loss stats, PP1/PP2 hits, and success rates all updated live. Key Features: Buy/Sell signals with adaptive volatility bands Real-time TP/SL/DP levels based on ATR Built-in MA Filter with optional ATR/StdDev volatility Performance stats panel (Success, Profit/Loss, PP1/PP2) Alerts via popup, sound, push, or email Cust
ARIScalp is a powerful trading companion designed to generate high-probability entry signals with dynamic TP/SL/DP levels based on volatility. Built-in performance tracking shows win/loss stats, PP1/PP2 hits, and success rates all updated live. Key Features: Buy/Sell signals with adaptive volatility bands Real-time TP/SL/DP levels based on ATR Built-in MA Filter with optional ATR/StdDev volatility Performance stats panel (Success, Profit/Loss, PP1/PP2) Alerts via popup, sound, push, or email Cus
Представляю Вам отличный технический индикатор GRABBER, который работает, как готовая торговая стратегия "Все включено"! В одном программном коде интегрированы мощные инструменты для технического анализа рынка, торговые сигналы (стрелки), функции алертов и Push уведомлений.  Каждый покупатель этого индикатора получает дополнительно БЕСПЛАТНО:  Grabber Утилиту для автоматического управления открытыми ордерами, Пошаговый видео-мануал : как установить, настроить и торговать, Авторские сет-файлы дл
Gold Sniper Scalper Pro — это профессиональный индикатор для MetaTrader 5, разработанный для помощи трейдерам в определении точек входа и эффективном управлении рисками. Индикатор предоставляет комплексный набор аналитических инструментов, включая систему обнаружения сигналов, автоматическое управление Entry/SL/TP, анализ объемов и статистику эффективности в режиме реального времени. Руководство пользователя для понимания системы   |   Руководство пользователя на других языках ОСНОВНЫЕ ФУНКЦИИ
FX Levels: Исключительно точные уровни поддержки и сопротивления для всех рынков Краткий обзор Ищете надежный способ определить уровни поддержки и сопротивления для любых инструментов—валют, индексов, акций или сырьевых товаров? FX Levels сочетает традиционный «Lighthouse» метод с современным динамическим подходом, обеспечивая почти универсальную точность. Благодаря сочетанию опыта реальных брокеров и автоматических ежедневных плюс «в реальном времени» обновлений, FX Levels поможет вам выявлят
AriX
Temirlan Kdyrkhan
1 (4)
AriX Indicator for MT5 A powerful trend-following and signal-evaluation tool AriX is a custom MT5 indicator that combines Moving Averages and ATR-based risk/reward logic to generate clear buy/sell signals. It visualizes dynamic SL/TP levels, evaluates past trade outcomes, and displays win/loss statistics in a clean on-chart panel. Key features include: Buy/Sell signals based on MA crossovers ATR-based SL/TP1/TP2/TP3 levels with visual lines and labels Signal outcome tracking with real-time stat
Berma Bands
Muhammad Elbermawi
5 (7)
Индикатор Berma Bands (BBs) является ценным инструментом для трейдеров, стремящихся определить и извлечь выгоду из рыночных тенденций. Анализируя взаимосвязь между ценой и BBs, трейдеры могут определить, находится ли рынок в фазе тренда или диапазона. Посетите [ Блог Berma Home ], чтобы узнать больше. Berma Bands состоят из трех отдельных линий: Upper Berma Band, Middle Berma Band и Lower Berma Band. Эти линии наносятся вокруг цены, создавая визуальное представление движения цены относительно об
Свинг-трейдинг - это первый индикатор, предназначенный для обнаружения колебаний в направлении тренда и возможных разворотов. Он использует базовый подход свинговой торговли, широко описанный в торговой литературе. Индикатор изучает несколько векторов цен и времени для отслеживания направления совокупного тренда и выявляет ситуации, когда рынок перепродан или перекуплен и готов к исправлению. [ Руководство по установке | Руководство по обновлению | Устранение неполадок | FAQ | Все продукты ] П
TPSproTrend PRO определяет момент, когда рынок действительно меняет направление, и формирует точку входа в начале движения. Вы входите в рынок тогда, когда цена только начинает двигаться, а не после того, как движение уже прошло.  Индикатор   не перерисовывает сигналы, автоматически отображает точки входа, Stop Loss и Take Profit, делая торговлю понятной, наглядной и структурированной. ИНСТРУКЦИЯ RUS   -   VERSION MT4   Основные преимущества Сигналы без перерисовки.  Все сигналы фиксированные. Е
Shock Pullback
Suleiman Alhawamdah
5 (1)
Проще говоря, вы можете начать торговлю, когда рядом с текущей свечой начинают появляться белые цифры — так называемые «пипсы». Белые «пипсы» указывают на то, что сделка на покупку или продажу в данный момент активна и движется в правильном направлении, что обозначается их белым цветом. Когда движение белых пипсов прекращается и превращается в статичный зелёный цвет, это сигнализирует об окончании текущего импульса. Зелёный цвет цифр представляет собой общий заработанный профит в «пипсах», незав
FX Dynamic: Отслеживайте волатильность и тренды с помощью настраиваемого ATR-анализа Обзор FX Dynamic — это мощный инструмент, который использует расчёты среднего истинного диапазона (ATR) для предоставления трейдерам непревзойдённой информации о дневной и внутридневной волатильности. Настраивая понятные пороги волатильности (например, 80%, 100% и 130%), вы можете быстро определять потенциальные возможности для прибыли или получать предупреждения, когда рынок выходит за типичные рамки. FX Dyna
Индикатор Trend Forecaster использует уникальный авторский алгоритм для определения точек входа в сделку по пробойной стратегии. Индикатор определяет ценовые скопления и анализирует движение цены возле уровней и показывает сигнал, когда цена пробивает уровень. Индикатор Trend Forecaster подходит для любых финансовых активов: валюты (Форекс), металлы, акции, индексы, криптовалюты. Также индикатор можно настроить для работы на любых тайм-фреймах, однако в качестве рабочего тайм-фрейма все же реком
Получите БЕСПЛАТНЫЙ AUX индикатор и поддержку EA  Прямая загрузка — Нажмите здесь [ D.I.C.E ] The DICE Indicator Divergence in Chaos Environment — это специализированный инструмент MT5, созданный для трейдеров, использующих Теорию волн Эллиотта в рамках методов Trading Chaos. Он выявляет скрытые и обычные дивергенции в ценовом движении, синхронизированные с хаотичной рыночной средой, описанной Биллом Уильямсом. Ключевые особенности Дивергенция, согласованная с волнами Эллиотта: определяет бычьи
Market Structure Patterns
Samuel Manoel De Souza
4.47 (19)
Available for   MT4   and   MT5 . Join the Market Structure Patterns channel to download materials available for study and/or additional informations. Related posts: Market Structure Patterns - Introdução Market Structure Patterns   is an indicator based on   smart money concepts   that displays   SMC/ICT   elements that can take your trading decisions to the next level. Take advantage of the   alerts ,   push notifications   and   email messages   to keep informed from when an element is form
Этот индикатор является уникальным, качественным и доступным инструментом для торговли, включающим в себя наши собственные разработки и новую формулу. В обновленной версии появилась возможность отображать зоны двух таймфреймов. Это означает, что вам будут доступны зоны не только на старшем ТФ, а сразу с двух таймфреймов - таймфрейма графика и старшего: отображение вложенных зон. Обновление обязательно понравится всем трейдерам, торгующим по зонам спроса и предложения. Важная информация Для макс
- Real price is 80$ - 45% Discount (It is 45$ now) Contact me for extra bonus   indicator, instruction or any questions! - Lifetime update free - Non-repaint - Related product: Gann Gold EA - I just sell my products in Elif Kaya Profile, any other websites are stolen old versions, So no any new updates or support. Advantages of  M1 Scalper Pro  Profitability: M1 Scalper Pro is highly profitable with a strict exit strategy. Frequent Opportunities: M1 Scalper Pro  takes advantage of numerous smal
Другие продукты этого автора
Trend Lines v2 MT5 is an intelligent auto trendline indicator that instantly detects key dynamic support and resistance zones. Built on pivot high/low structure, it delivers a clear and accurate view of market trends across all timeframes. Features Fully automatic trendline drawing based on precise pivot points. Filters out noise – only clean and reliable trendlines are shown. Control the number of lines to keep your chart neat and easy to read. Flexible customization: colors, line thickness, ra
FREE
Indicator Guide: Key Price Levels & Structure Shifts 1. Description The indicator is a technical analysis tool for the MetaTrader 5 platform. It is designed to automatically identify specific price movements and to highlight corresponding price zones based on preceding price action. This provides a visualization of key price areas according to the indicator's internal logic. 2. Visual Elements & Their Identification The indicator identifies and draws several types of visual elements on the chart
FREE
The "Breakout Finder" is a technical indicator designed to automatically identify potential price breakouts and breakdowns on a chart. The highlight of this indicator is its robust signal filtering system, which helps traders avoid false signals (fakeouts) and focus on higher-probability trading opportunities. Key Features Automatic Pivot Point Detection: The indicator automatically identifies significant pivot highs and lows on the chart to establish potential support and resistance levels. Bre
FREE
The Supertrend indicator is a trend-following technical analysis tool designed to help traders identify the direction of market trends and potential entry/exit points. It operates based on price data and Average True Range (ATR) to create a dynamic signal line that changes color depending on the current trend. Green color: Indicates an uptrend. Red color: Indicates a downtrend. Supertrend is a useful indicator for both short-term and long-term trading, helping to filter out market noise and focu
FREE
The Linear Regression Channel is a powerful technical analysis tool that helps visually identify the prevailing trend and potential price zones. Essentially, the indicator performs two main functions: It draws a trendline through the center of price action over a specified period. This line is calculated using the linear regression method, which results in the best possible "line of best fit" for the price data. From this center line, the indicator plots two parallel lines above and below, creat
FREE
The "Support Resistance Dynamic" indicator is a powerful technical analysis tool for the MetaTrader 5 platform, designed to automatically identify and plot dynamic Support and Resistance zones on price charts. This indicator helps traders easily recognize important price levels, potential reversal points, or breakout areas, thereby enabling more informed trading decisions. 2. Key Features Dynamic S/R Identification : Automatically identifies support and resistance zones based on an advanced Pivo
FREE
1. Overview The Scalping PullBack Signal indicator is a powerful technical analysis tool designed to help traders identify scalping opportunities based on potential pullback and reversal signals. This tool is particularly useful on lower timeframes (below 15 minutes) but can also be applied on higher timeframes for longer-term trades. This indicator integrates several key analytical components, providing a comprehensive view of trends and potential entry/exit points, helping you make quick and e
FREE
The Pivot Point Supertrend indicator is a technical analysis tool designed for the MetaTrader 5 (MT5) platform. It combines two popular analytical methods: Pivot Points: Uses significant historical price highs and lows to identify potential support and resistance zones. These points are objective and stable. Supertrend: A well-known trend-following indicator that helps identify the current market trend and provides dynamic stop-loss levels. Indicator's Goal: By using the stability of Pivot Point
FREE
The MultiFrameRSIIndicator is a powerful MetaTrader 5 (MT5) indicator that leverages the Relative Strength Index (RSI) to analyze trends across multiple timeframes. This indicator synchronizes RSI-based trend signals from up to nine timeframes (M1, M5, M15, M30, H1, H4, D1, W1, MN1) and presents them with clear visual feedback, including a colored RSI line, signal arrows, and a customizable dashboard. Ideal for traders seeking momentum-based trend confirmation. Features Multi-Timeframe Analysis
FREE
The MultiFrameTrendAnalyzer is a versatile MetaTrader 5 (MT5) indicator designed to provide multi-timeframe trend analysis using Moving Average (MA) crossovers. This indicator synchronizes trend signals across multiple timeframes (M1, M5, M15, M30, H1, H4, D1, W1, MN1) and displays them with intuitive visual cues, including a colored trend line, signal arrows, and a customizable dashboard. Features Multi-Timeframe Analysis : Evaluates trends across up to nine timeframes, allowing traders to conf
FREE
The MTF (Multi-Timeframe) Candles indicator is a powerful tool that allows you to display candles from a higher timeframe (e.g., H1, H4, D1) directly on a lower timeframe chart (e.g., M5, M15, M30). The Problem It Solves: Instead of constantly switching back and forth between charts to analyze the main trend and detailed price action, this indicator merges both perspectives into one. You can instantly see the "big picture" while staying focused on trading signals on your current timeframe. Core
FREE
Welcome to Ultimate MA MTF , a multi-functional Moving Average (MA) indicator converted from the original TradingView version by ChrisMoody and upgraded with many powerful features. This is not just a typical MA line. It is a comprehensive technical analysis tool designed to provide traders with deep insights into trends, volatility, and potential trading signals, all within a single indicator. Key Features 8 Moving Average Types: Full support for the most popular MA types (SMA, EMA, WMA, HullMA
FREE
1. Introduction Smart Volume S/R Pro is a powerful technical analysis tool designed for the MetaTrader 5 platform. Unlike traditional Support & Resistance (S/R) indicators that rely on price peaks and troughs, this indicator automatically identifies critical S/R zones based on a core factor: Trading Volume . Core Principle: Price levels that witnessed exceptionally high trading volume in the past will often become significant psychological zones, where the price is likely to react strongly (eith
FREE
TMA Overlay Indicator for MT5 - User Guide 1. Introduction TMA Overlay is a versatile technical analysis indicator for the MetaTrader 5 platform. The indicator's goal is to provide traders with a comprehensive overview of the trend, potential entry signals, and key trading sessions, all integrated into a single chart. This is not a trading system, but a comprehensive analysis tool designed to help you make more informed decisions. 2. Core Indicator Components The indicator consists of multiple c
FREE
The "Volume Range Profile with Fair Value" (VRPFV) indicator is a powerful volume analysis tool designed to help traders better understand market structure and identify key price areas where significant institutional activity occurs. Instead of just looking at volume on individual candlesticks, VRPFV analyzes the distribution of volume by price level within a specific time range, providing deep insights into the "footprint" of smart money. VRPFV consists of the following core components: Upper &
FREE
The WaveTrend Oscillator indicator is an enhanced version of the classic WaveTrend Oscillator, a momentum indicator. It is designed to identify overbought/oversold conditions and provide potential trend reversal signals. The core difference in this version is the application of a data "normalization" algorithm. This ensures the indicator's oscillation lines remain balanced around the zero line, causing the indicator window to always stay naturally centered. This is especially useful when trading
FREE
The Multi-Frame MACD Indicator is a robust MetaTrader 5 (MT5) indicator that utilizes the Moving Average Convergence Divergence (MACD) to analyze trends across multiple timeframes. This indicator synchronizes MACD-based trend signals from up to nine timeframes (M1, M5, M15, M30, H1, H4, D1, W1, MN1) and presents them with clear visual cues, including a colored MACD line, signal arrows, and a customizable dashboard. Perfect for traders seeking momentum and trend reversal insights. Features Multi-
FREE
1. Introduction The CM_Ultimate_RSI_MTF is a powerful and versatile custom indicator for MetaTrader 5, designed to enhance your Relative Strength Index (RSI) analysis. It provides multi-timeframe (MTF) capabilities, visual signals, and customizable alerts, making it an invaluable tool for traders seeking to identify overbought/oversold conditions, trend strength, and potential entry/exit points across various timeframes. 2. Key Features Multi-Timeframe (MTF) Analysis: Allows you to view RSI from
FREE
1. Overview The Ichimoku Kinko Hyo (or Ichimoku Cloud) is a comprehensive, all-in-one technical analysis indicator designed to provide a deep understanding of market trends, momentum, and dynamic support and resistance levels. This indicator provides a clean, standard implementation of the five core Ichimoku lines. Its key feature is a non-intrusive Status Dashboard that gives you an at-a-glance summary of the current market situation according to the Ichimoku system, allowing for quick and effi
FREE
Multi-Period EMA is a convenient indicator that displays multiple Exponential Moving Averages (EMAs) on a single chart. It is designed to help traders easily identify market trends and key crossover points without the need to add multiple individual EMA indicators. Key Features: Multiple EMAs in one: Simplifies chart analysis by combining several EMA lines into one indicator. Fully customizable: Easily change the period (default 20, 50, 100, 200), color, and thickness of each EMA line. Clean in
FREE
Volume Flow Indicator (VFI) - User Manual 1. General Introduction The Volume Flow Indicator (VFI) is an advanced technical oscillator designed to measure the strength and sustainability of a price trend by incorporating both price and volume data. Developed based on the concepts of On-Balance Volume (OBV) but with significant improvements, the VFI provides deeper insight into money flow and the conviction behind price movements. This indicator is not an automated trading system but a powerful an
FREE
The Vix_Fix indicator, or "Vix Fix," is a tool designed to identify potential market bottoms. It operates on the principle of measuring extreme fear or pessimism among the crowd, which are moments when the market often has a high probability of reversing to the upside. Main Purpose: To help traders find high-probability BUY (Long) entry points by identifying when the market is "oversold." How it Works In simple terms, the Vix Fix measures the distance between the current bar's Low and the Highes
FREE
MultiFrame Pivot: A Multi-Timeframe Analysis Tool MultiFrame Pivot is an analysis indicator designed to provide an overview of the market based on Pivot Points across multiple timeframes. The indicator synthesizes information from different timeframes to give you a more comprehensive view of important price levels. KEY FEATURES: Multi-Timeframe Analysis: MultiFrame Pivot allows you to simultaneously monitor the price's status relative to Pivot Points (PP), Support 1 (S1), and Resistance 1 (R1)
FREE
1. Introduction The Market Squeeze Momentum Indicator (SQZMOM_LB) is a powerful technical analysis tool designed to help traders identify periods of low market volatility (the "squeeze" phase) and predict the direction and strength of price momentum after the squeeze ends. This indicator combines the principles of Bollinger Bands and Keltner Channels to detect changes in market volatility, along with a momentum oscillator to measure buying/selling pressure. 2. Key Components of the Indicator The
FREE
Fibonacci Bollinger Bands (FBB) Indicator - User Manual 1. Introduction Fibonacci Bollinger Bands (FBB) is a technical analysis indicator that combines three tools: Bollinger Bands , Fibonacci Ratios , and the Volume-Weighted Moving Average (VWMA) . The purpose of this indicator is to provide a multi-dimensional view of the market by helping to identify: Dynamic support and resistance zones. The general market trend. Volatility levels and potential accumulation phases (squeezes). Price breakouts
FREE
MultiFrame MA: A Multi-Timeframe Trend Indicator MultiFrame MA is a trend analysis indicator designed to provide a comprehensive market overview across various timeframes. Instead of relying on a single timeframe, this tool synthesizes information from multiple charts, giving users a holistic and reliable perspective. KEY FEATURES: Multi-Timeframe Analysis: The indicator analyzes data from various timeframes, from M1 up to Monthly, to help users identify trend confluence at different levels. MA
FREE
This indicator is a trading strategy designed to find high-probability entry points by combining two very popular indicators: Bollinger Bands (BB) and the Relative Strength Index (RSI) . The core idea is "dual confirmation" : a trade signal is only considered valid when both indicators agree. This helps filter out many of the false signals that occur when using just a single indicator, thereby increasing the reliability of each entry. Bollinger Bands are used to identify relative price value zon
FREE
The Smart Trend Tracker (OTT) is a technical analysis tool designed to help traders identify the direction and strength of a market trend. This indicator functions as an optimized moving average that adapts to market volatility, thereby providing dynamic support and resistance levels. The primary goal of the OTT is to smooth out price action and offer visual cues about potential changes in the trend. Core Components of the Indicator When you add the indicator to your chart, you will see two main
FREE
MultiFrame Volume Trend (MFVI) is a powerful VWAP-based indicator that displays volume trends across multiple timeframes in a clean, easy-to-read dashboard directly on your chart. Instantly capture the overall market direction in just seconds. Features Multi-timeframe VWAP analysis from M1 to MN1. Dashboard panel shows the trend state of each timeframe at a glance. Plots VWAP line and buy/sell arrows directly on the chart. Fully customizable: colors, line width, panel position, arrow symbols. Bu
FREE
The EMA Navigator Pro is an advanced version of the popular EMA indicator, designed to provide superior flexibility and multi-timeframe analysis capabilities. This indicator not only displays EMA lines but also offers a powerful alert system to ensure you never miss a crucial signal. Key Features: Multi-Timeframe Support: You can assign a separate timeframe to each individual EMA line, allowing you to analyze long-term (e.g., D1) and short-term (e.g., H1) trends on the same chart. Automatic Cro
FREE
Фильтр:
Нет отзывов
Ответ на отзыв