All in one smart Smc indicator Ict mmxm Mt5

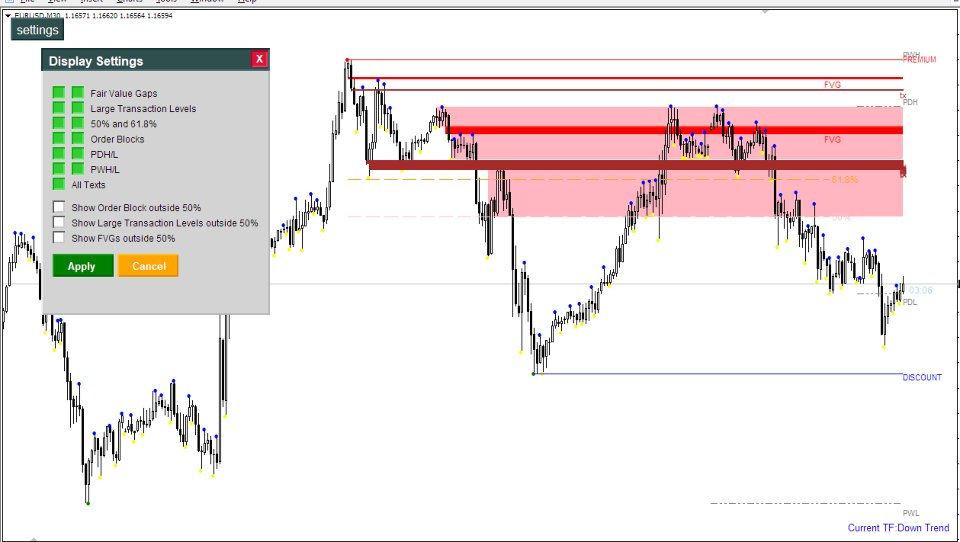
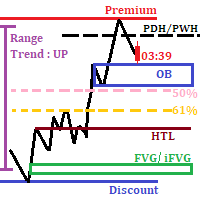
Features List 1:

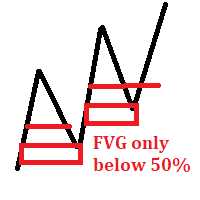
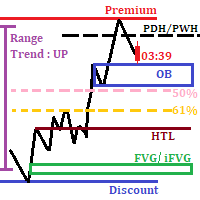
  • FVG->iFVG
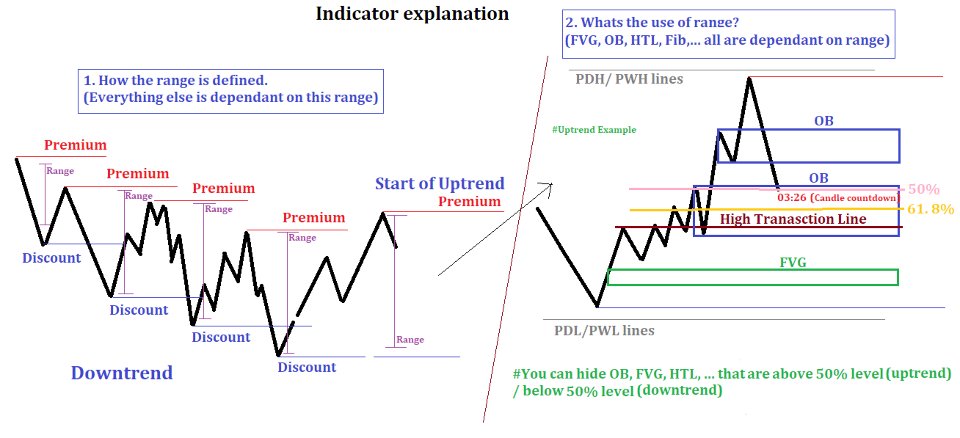
  • Order Block
  • High Transaction Line (Personal strategy)
  • Premium Discount
  • 50% and 61%
  • Previous day high low
  • Previous week high low
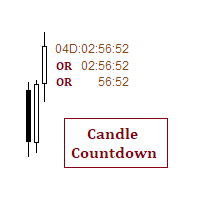
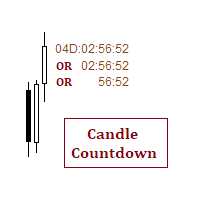
  • Candle end countdown

Feature List 2 : (Implemented based on feedback from community groups)

  • trend identification
  • Hide FVG, Order Block, Large Transaction line below 50% equilibrium.
  • Hide all/Individual texts/features

FUTURE Feature List (Will be implemented only if at least 5 people request for it.)

  • Asia, London, NY lq zones
  • Alerts for features price touch
  • Multi-timeframe
  • Textbox that saves your notes
  • Your requests/Your entry techniques(Private jobs can also be fulfilled). 

After making the purchase, message me so I can provide you one of my high probability entry modules that are based on High transaction line.

Thank you :) Always open to feedback and criticism if it helps me provide you more value.

(I have been trading forex for last 6 years and i publish every indicator that i build for my personal use so everyone can benefit)

- Rahul 

Recommended products
SMC Precision AI – Institutional Smart Money Concept Indicator for MetaTrader 5 Unlock the edge of institutional trading with SMC Precision AI – an advanced AI-powered Smart Money Concept (SMC) indicator built for serious traders who want precision, clarity, and high-probability trade setups. Key Features:Smart Money Concepts (SMC) – Identifies key liquidity zones, order blocks, mitigation zones, and market structure shifts used by institutions. AI-Powered Signals – Enhanced by real-time AI l
Profile Map MT5
Dmitriy Sapegin
5 (5)
Market Profile helps the trader to identify the behavior if major market players and define zones of their interest. The key feature is the clear graphical display of the range of price action, in which 70% of the trades were performed. Understanding of the location of volume accumulation areas can help traders increase the probability of success. The tool can be used as an independent system as well as in combination with other indicators and trading systems. this indicator is designed to suit
Was: $249  Now: $149   Market Profile defines a number of day types that can help the trader to determine market behaviour. A key feature is the Value Area, representing the range of price action where 70% of trading took place. Understanding the Value Area can give traders valuable insight into market direction and establish the higher odds trade. It is an excellent addition to any system you may be using. Inspired by Jim Dalton’s book “Mind Over Markets”, this indicator is designed to suit the
VWAP Indicator MT5
Kyra Nickaline Watson-gordon
Description : VWAP (Volume-Weighted Average Price) is the ratio of the value traded to total volume traded over a particular time horizon. It is a measure of the average price at which pair is traded over the trading horizon. Read More. All Symbols and All Timeframes are supported. Indicator Inputs :     VWAP Mode : Mode of VWAP Calculation. Options can be selected : Single,Session,Daily,Weekly,Monthly     Volumes : Real Volumes,Tick Volumes     Price Type : Used price for calculating. O
This indicator allows you to enjoy the two most popular products for analyzing request volumes and market deals at a favorable price: Actual Depth of Market Chart Actual Tick Footprint Volume Chart This product combines the power of both indicators and is provided as a single file. The functionality of Actual COMBO Depth of Market AND Tick Volume Chart is fully identical to the original indicators. You will enjoy the power of these two products combined into the single super-indicator! Below is
Initial Balance MT5
Ricardo Almeida Branco
The Initial Balance (Initial Balance / Initial Balance) is a concept related to the study of volume (to learn more, study about Market Profile and Auction Market Theory. You can find some videos in English when searching for "Initial Balance Market Profile"). The IB defines a range in which prices were negotiated in the first hour of trading.The amplitude of the range is important and the break in the range defined by the Initial Balance may have occurred due to the movement of several players
The indicator builds current quotes, which can be compared with historical ones and on this basis make a price movement forecast. The indicator has a text field for quick navigation to the desired date. Options: Symbol - selection of the symbol that the indicator will display; SymbolPeriod - selection of the period from which the indicator will take data; IndicatorColor - indicator color; Inverse - true reverses quotes, false - original view; Next are the settings of the text field, in w
BoxChart MT5
Evgeny Shevtsov
5 (7)
The market is unfair if only because 10% of participants manage 90% of funds. An ordinary trader has slim changes to stand against these "vultures". This problem can be solved. You just need to be among these 10%, learn to predict their intentions and move with them. Volume is the only preemptive factor that faultlessly works on any timeframe and symbol. First, the volume appears and is accumulated, and only then the price moves. The price moves from one volume to another. Areas of volume accumu
VR Grid Mt5
Vladimir Pastushak
3.25 (8)
The VR Grid indicator is designed to create a graphical grid with user-defined settings. Unlike the standard grid , VR Grid is used to build circular levels . Depending on the user's choice, the step between the round levels can be arbitrary. In addition, unlike other indicators and utilities, VR Grid maintains the position of the grid even when the time period changes or the terminal is rebooted. You can find settings, set files, demo versions, instructions, problem solving, at [blog] You can
FREE
Pullback Hunter
Anton Polkovnikov
PULLBACK HUNTER What is every trader's cherished dream? To see without delay the places where the reversal will happen. This, of course, is from the category of magic, though... nothing is impossible. But for now I've prepared for you an indicator that marks in real time the end of corrections to the current movement or in short - catches pullbacks.What is the main point? Many people practice rebounds when the price moves in the direction of the open position. And they do them on the formation o
Blahtech Supply Demand MT5
Blahtech Limited
4.54 (13)
Was: $299  Now: $149  Supply Demand uses previous price action to identify potential imbalances between buyers and sellers. The key is to identify the better odds zones, not just the untouched ones. Blahtech Supply Demand indicator delivers functionality previously unavailable on any trading platform. This 4-in-1 indicator not only highlights the higher probability zones using a multi-criteria strength engine, but also combines it with multi-timeframe trend analysis, previously confirmed swings
This product is designed for the MT5 platform and offers two key features: VWAP (Volume Weighted Average Price) calculation and Volume Profile analysis. Advantages: VWAP Calculation: The product calculates the VWAP, which is a popular indicator used by traders to determine the average price of a security based on its trading volume. It helps identify potential buying or selling opportunities by comparing the current price to the average price weighted by volume. Volume Profile Analysis: The prod
BS Vwap 5 Bands
Bruno Gomes Falcao Seixas
The BS Vwap 5 Bands indicator is an advanced tool that integrates price and volume data, providing a comprehensive view of market dynamics. Designed with a focus on performance and tested under real trading conditions, this indicator aims to deliver valuable insights to traders. Its innovative approach combines VWAP with five distinct bands, revealing whether the price is aligned with the "fair price" and indicating overbought or oversold conditions. Additionally, the indicator offers visual cus
This indicator is based on the discrete Hartley transform. Using this transformation allows you to apply different approaches when processing financial time series. A distinctive feature of this indicator is that its readings refer not to one point on the chart, but to all points of the indicator period. When processing a time series, the indicator allows you to select various elements of the time series. The first possibility of filtering is built on this approach - all unnecessary high-freque
Advanced MT5 Indicator: Precision-Powered with Pivot Points, MAs & Multi-Timeframe Logic Unlock the full potential of your trading strategy with this precision-engineered MetaTrader 5 indicator —an advanced tool that intelligently blends Pivot Points , Adaptive Moving Averages , and Multi-Timeframe Analysis to generate real-time Buy and Sell signals with high accuracy. ########    If you want to test on Real Market, Let me know. I will give the Demo file to run on Real Account.   ###########
Leveler MT5
Tuomas Tirroniemi
Leveler –   Draws support and resistance grid levels, and key bar-based zones. Core Features: Support/Resistance Grid (Round Numbers) Leveler includes a dual-layer grid system with pre-configured round number levels. Each symbol can be assigned a custom phase size based on market characteristics—larger phase sizes for high-volume markets, smaller for low-volume ones. The indicator supports   32 symbols , and each symbol must be named exactly as listed in your broker’s Market Watch. Fully Config
SimpleprobMT5
Augusto Martins Lopes
Probability Indicator Description The Probability Indicator is a tool designed for traders who want to identify buying and selling opportunities based on the analysis of previous candles. It calculates the probability of rise ( CALL ) and fall ( PUT ) based on the number of candles analyzed and displays arrows on the chart to signal possible entry points. Features Candle Analysis : Analyzes a configurable number of candles to calculate the probability of rise and fall. Visual Signals : Displays
VolumeProfile MT5
Robert Hess
4.14 (7)
Description: The Volume Profile displays detailed informations of historical trading activities at certain price levels (Market Profile). Locate the areas with the best prices in the market and get an advantage over other market participants. Features: Customizable Market Profile Shows the "fair" Value Area with 70% of all Volume Shows critical low volume zones Shows VPOC, VAL and VAH Points integrated resource management to reduce the load while working with multiple charts Works on all timefr
Max Min Delta Indicator - Market Volume Imbalance Analysis Gain Deeper Insights into Market Volume Imbalance with Delta Analysis What is the Max Min Delta Indicator? The Max Min Delta Indicator is a powerful market volume analysis tool that visually represents maximum and minimum delta values using a histogram. It helps traders identify market strength, weakness, absorption, and aggressive buying/selling activity with precision. Key Features Histogram Visualization: Displays Max Delta (Green) an
Forex Volume MT5
KEENBASE SOFTWARE SOLUTIONS
KT Forex Volume shows the buying and selling volume of a currency pair in the form of a colored histogram. The volume is made of buying and selling transactions in an asset. In FX market: If the buying volume gets bigger than the selling volume, the price of a currency pair would go up. If the selling volume gets bigger than the buying volume, the price of a currency pair would go down. Features Avoid the bad trades by confirming them using the tick volume data. It helps you to stay on the side
https://c.mql5.com/31/761/best-trend-indicator-logo-200x200-8493.png The indicator uses a solid line of red and green to reflect the myriad changes in market prices. The green line indicates a period of rising market prices and the red line indicates a period of falling market prices. Solid line color change indicates that the market has changed and the market is likely to reverse! It is recommended that you use this indicator on your daily K-chart. This indicator is not suitable for you to do
VWAP Daily
Anton Polkovnikov
Weighted average price indicator or VWAP. The well-known standard VWAP with the beginning of the day is added with the function of selecting the periodization. It can be calculated both every day and on other periods. Also the indicator allows to exclude the volume from the calculation, which will allow using it on the cryptocurrencies and forex. There is an alert for a VWAP price crossing. There are 1 and 2 standard deviation. Settings: Volume: turning volume on and off in the calculation mecha
Adjustable Consecutive Fractals  looks for 2 or more fractals in one direction and sends out a on screen alert, sound alert and push notification, for strong reversal points . Adjustable Consecutive Fractals, shows the fractals on chart along with a color changing text for buy and sell signals when one or more fractals appear on one side of price. Adjustable Consecutive Fractals is based Bill Williams Fractals . The standard Bill Williams fractals are set at a non adjustable 5 bars, BUT withe th
Symbols and Timeframes Switcher on Chart
Peshwan Jaafer Muhammad Tahir Ali
Description: This indicator adds customizable buttons for symbols (currency pairs) and timeframes directly onto the chart. It allows traders to quickly switch between different symbols and timeframes by simply clicking on the respective buttons. The indicator also includes a toggle button to show or hide all the symbol and timeframe buttons, providing flexibility in chart customization. Key Features: Symbol Buttons: Automatically generates buttons for symbols from the Market Watch or allows man
AW Candle Patterns
AW Trading Software Limited
The AW Candle Patterns indicator is a combination of an advanced trend indicator combined with a powerful candle pattern scanner. It is a useful tool for recognizing and highlighting the thirty most reliable candlestick patterns. In addition, it is a current trend analyzer based on colored bars with a   plug-in multi-timeframe trend panel that can be resized and positioned. A unique ability to adjust the display of patterns depending on the trend filtering. Advantages: Easily identifies candle p
Better Volume MT5
Illia Zhavarankau
1 (1)
Description: The indicator of tick volumes Better Volume MT5 allows you to assess the general mood of the market and quite accurately catch the moments of the formation of large movements. The indicator is a color histogram in an additional window. In the calculation of Better Volume MT5 the Price Action combinations are taken into account, the values of the volumes with the height of columns and color marking are displayed. Input parameters: MAPeriod - period for calculating the moving average
The SMC Venom Model BPR indicator is a professional tool for traders working within the Smart Money (SMC) concept. It automatically identifies two key patterns on the price chart: FVG   (Fair Value Gap) is a combination of three candles, in which there is a gap between the first and third candles. It forms a zone between levels where there is no volume support, which often leads to a price correction. BPR   (Balanced Price Range) is a combination of two FVG patterns that form a “bridge” - a zon
Z Score Plus MT5
Eduardo Da Costa Custodio Santos
In finance, Z Scores are measures of the variability of an observation and can be used by traders to help determine market volatility. Z scores tell Traders whether a score is typical for a specified dataset or is atypical. Z scores also enable analysts to adapt scores from multiple datasets to make scores that can be more accurately compared to each other. # In practice, we have the ZScore with zero point and oscillations between 2 and 3 for ultra high high points and oscillations between -2 an
Quick deals EA
Aleksandr Slavskii
Горячие клавиши плюс клик левой кнопки мыши на графике. Советник открывает сделки, выставляет лимитные и стоповые ордера, удаляет ордера и закрывает позиции, также  делает реверс  открытых позиций, выставляет прописанные в настройках стоп лосс и тейк профит. (реверс только на неттинговых счетах) При запуске советника можно посмотреть подсказку как действует советник при нажатии клавиши + клик на графике. Правее последнего бара, ниже цены Ctrl+ЛКМ  - OpenSell Правее последнего бара, выше цены C
1. What is this         Rising volatility and falling volatility are not the same, whether it is academic research or actual testing has shown this point.         The original ATR indicator is calculated by putting up and down fluctuations together. This indicator is to calculate separately the upward volatility and the downward volatility, which can better help you study the market. 2. Indicator description          There are two modes for the calculation of this indicator, as shown in the fo
Buyers of this product also purchase
Divergence Bomber
Ihor Otkydach
4.98 (61)
Each buyer of this indicator also receives the following for free: The custom utility "Bomber Utility", which automatically manages every trade, sets Stop Loss and Take Profit levels, and closes trades according to the rules of this strategy Set files for configuring the indicator for various assets Set files for configuring Bomber Utility in the following modes: "Minimum Risk", "Balanced Risk", and "Wait-and-See Strategy" A step-by-step video manual to help you quickly install, configure, and s
Grabber System MT5
Ihor Otkydach
5 (15)
Let me introduce you to an excellent technical indicator – Grabber, which works as a ready-to-use "All-Inclusive" trading strategy. Within a single code, it integrates powerful tools for technical market analysis, trading signals (arrows), alert functions, and push notifications. Every buyer of this indicator also receives the following for free: Grabber Utility for automatic management of open orders Step-by-step video guide: how to install, configure, and trade with the indicator Custom set fi
Trend Screener Pro MT5
STE S.S.COMPANY
4.87 (90)
Unlock the Power of Trends Trading with the Trend Screener Indicator: Your Ultimate Trend Trading Solution powered by Fuzzy Logic and Multi-Currencies System! Elevate your trading game with the Trend Screener, the revolutionary trend indicator designed to transform your Metatrader into a powerful Trend Analyzer. This comprehensive tool leverages fuzzy logic and integrates over 13 premium features and three trading strategies, offering unmatched precision and versatility. LIMITED TIME OFFER : Tre
Gold Stuff mt5
Vasiliy Strukov
4.92 (189)
Gold Stuff mt5 is a trend indicator designed specifically for gold and can also be used on any financial instrument. The indicator does not redraw and does not lag. Recommended time frame H1. Contact me immediately after the purchase to get   personal bonus!  You can get a free copy of our Strong Support and Trend Scanner indicator, please pm. me! Settings  and manual   here  Please note that I do not sell my EA's or special sets on telegram, it is only available on Mql5 and my set files are on
Trend indicator AI mt5
Ramil Minniakhmetov
5 (7)
Trend Ai indicator  mt5 is great tool that will enhance a trader’s market analysis by combining trend identification with actionable entry points and reversal alerts.  This indicator empowers users to navigate the complexities of the forex market with confidence and precision Beyond the primary signals, Trend Ai indicator identifies secondary entry points that arise during pullbacks or retracements, enabling traders to capitalize on price corrections within the established trend. Important Advan
Quantum TrendPulse
Bogdan Ion Puscasu
5 (13)
Introducing Quantum TrendPulse , the ultimate trading tool that combines the power of SuperTrend , RSI , and Stochastic into one comprehensive indicator to maximize your trading potential. Designed for traders who seek precision and efficiency, this indicator helps you identify market trends, momentum shifts, and optimal entry and exit points with confidence. Key Features: SuperTrend Integration: Easily follow the prevailing market trend and ride the wave of profitability. RSI Precision: Detect
Support And Resistance Screener Breakthrough unique Solution With All Important levels analyzer and Markets Structures Feature Built Inside One Tool ! Our indicator has been developed by traders for traders and with one Indicator you will find all Imporant market levels with one click. LIMITED TIME OFFER : Support and Resistance Screener Indicator is available for only 50 $ and lifetime. ( Original price 125$ ) (offer extended) The available tools ( Features ) in our Indicator are :  1. HH-LL S
AriX
Temirlan Kdyrkhan
1 (1)
AriX Indicator for MT5 A powerful trend-following and signal-evaluation tool AriX is a custom MT5 indicator that combines Moving Averages and ATR-based risk/reward logic to generate clear buy/sell signals. It visualizes dynamic SL/TP levels, evaluates past trade outcomes, and displays win/loss statistics in a clean on-chart panel. Key features include: Buy/Sell signals based on MA crossovers ATR-based SL/TP1/TP2/TP3 levels with visual lines and labels Signal outcome tracking with real-time stat
***  Entry In The Zone and SMC Multi Timeframe is a real-time market analysis tool developed based on the Smart Money Concepts (SMC) framework. It automatically analyzes reversal points and key zones across multiple timeframes, with a focus on providing no repaint signals and highlighting Points of Interest (POI). Additionally It also features an Auto Fibonacci Level System that automatically draws Fibonacci lines to help detect pullback and reversal points instantly. Most importantly, the sign
ARIPoint
Temirlan Kdyrkhan
ARIBot is a powerful trading companion designed to generate high-probability entry signals with dynamic TP/SL/DP levels based on volatility. Built-in performance tracking shows win/loss stats, PP1/PP2 hits, and success rates — all updated live. Key Features: Buy/Sell signals with adaptive volatility bands Real-time TP/SL/DP levels based on ATR Built-in MA Filter with optional ATR/StdDev volatility Performance stats panel (Success, Profit/Loss, PP1/PP2) Alerts via popup, sound, push, or email Cus
How many times have you bought a trading indicator with great back-tests, live account performance proof with fantastic numbers and stats all over the place but after using it, you end up blowing your account? You shouldn't trust a signal by itself, you need to know why it appeared in the first place, and that's what RelicusRoad Pro does best! User Manual + Strategies + Training Videos + Private Group with VIP Access + Mobile Version Available A New Way To Look At The Market RelicusRoad is the
Matrix Arrow Indicator MT5
Juvenille Emperor Limited
5 (14)
Matrix Arrow Indicator MT5  is a unique 10 in 1 trend following   100% non-repainting  multi-timeframe indicator that can be used on all symbols/instruments:   forex,   commodities,   cryptocurrencies,   indices,   stocks .  Matrix Arrow Indicator MT5  will determine the current trend at its early stages, gathering information and data from up to 10 standard indicators, which are: Average Directional Movement Index (ADX) Commodity Channel Index (CCI) Classic Heiken Ashi candles Moving Average
FX Volume MT5
Daniel Stein
4.84 (19)
FX Volume: Experience Genuine Market Sentiment from a Broker’s Perspective Quick Overview Looking to elevate your trading approach? FX Volume provides real-time insights into how retail traders and brokers are positioned—long before delayed reports like the COT. Whether you’re aiming for consistent gains or simply want a deeper edge in the markets, FX Volume helps you spot major imbalances, confirm breakouts, and refine your risk management. Get started now and see how genuine volume data can
TPSproTREND PrO MT5
Roman Podpora
4.64 (14)
Entry points at the bar close,  without redrawing .  Trend scanner  across all assets,  MTF - mode  and much more in one tool. We recommend using it together with   RFI LEVELS. ИНСТРУКЦИЯ RUS   /   INSTRUCTIONS  ENG         /         VERSION MT4   Main functions: Accurate entry signals WITHOUT REPAINTING! Once a signal appears, it remains valid! This is a significant distinction from repainting indicators that might provide a signal and then alter it, potentially leading to deposit losses. Now,
ACB Breakout Arrows MT5
KEENBASE SOFTWARE SOLUTIONS
5 (1)
The ACB Breakout Arrows indicator provides a crucial entry signal in the market by detecting a special breakout pattern. The indicator constantly scans the chart for a settling momentum in one direction and provide the accurate entry signal right before the major move. Get multi-symbol and multi-timeframe scanner from here - Scanner for ACB Breakout Arrows MT 5 Key features Stoploss   and Take Profit levels are provided by the indicator. Comes with a MTF Scanner dashboard which tracks the brea
Owl Smart Levels MT5
Sergey Ermolov
3.93 (30)
MT4 version  |   FAQ The Owl Smart Levels Indicator is a complete trading system within the one indicator that includes such popular market analysis tools as Bill Williams' advanced fractals , Valable ZigZag which builds the correct wave structure of the market, and Fibonacci levels which mark the exact levels of entry into the market and places to take profits. Detailed description of the strategy Instructions for working with the indicator Advisor-assistant in trading Owl Helper Private User
Algo Pumping
Ihor Otkydach
4.74 (19)
PUMPING STATION – Your Personal All-inclusive strategy Introducing PUMPING STATION — a revolutionary Forex indicator that will transform your trading into an exciting and effective activity! This indicator is not just an assistant but a full-fledged trading system with powerful algorithms that will help you start trading more stable! When you purchase this product, you also get FOR FREE: Exclusive Set Files: For automatic setup and maximum performance. Step-by-step video manual: Learn how to tr
PZ Swing Trading MT5
PZ TRADING SLU
5 (5)
Protect against whipsaws: revolutionize your swing trading approach Swing Trading is the first indicator designed to detect swings in the direction of the trend and possible reversal swings. It uses the baseline swing trading approach, widely described in trading literature. The indicator studies several price and time vectors to track the aggregate trend direction and detects situations in which the market is oversold or overbought and ready to correct. [ Installation Guide | Update Guide | Tro
TPSpro RFI Levels MT5
Roman Podpora
4.47 (17)
Reversal zones - levels / Active zones of a major player INSTRUCTIONS RUS   /   INSTRUCTIONS   ENG   /   Version MT4 EVERY BUYER OF THIS INDICATOR       GET ADDITIONALLY   FOR FREE   : 3 months       access to trading signals from the service       RFI SIGNALS       — ready-made entry points according to the TPSproSYSTEM algorithm. 3 months       access to training materials with regular updates - immersion in strategy and professional growth. 24/5 support on weekdays and access to a closed tra
Trend Forecaster
Alexey Minkov
5 (7)
The Trend Forecaster indicator utilizes a unique proprietary algorithm to determine entry points for a breakout trading strategy. The indicator identifies price clusters, analyzes price movement near levels, and provides a signal when the price breaks through a level. The Trend Forecaster indicator is suitable for all financial assets, including currencies (Forex), metals, stocks, indices, and cryptocurrencies. You can also adjust the indicator to work on any time frames, although it is recommen
Top indicator for MT5   providing accurate signals to enter a trade without repainting! It can be applied to any financial assets:   forex, cryptocurrencies, metals, stocks, indices .  Watch  the video  (6:22) with an example of processing only one signal that paid off the indicator! MT4 version is here It will provide pretty accurate trading signals and tell you when it's best to open a trade and close it. Most traders improve their trading results during the first trading week with the help of
Introduction to X3 Chart Pattern Scanner X3 Cherart Pattern Scanner is the non-repainting and non-lagging indicator detecting X3 chart patterns including Harmonic pattern, Elliott Wave pattern, X3 patterns, and Japanese Candlestick patterns. Historical patterns match with signal patterns. Hence, you can readily develop the solid trading strategy in your chart. More importantly, this superb pattern scanner can detect the optimal pattern of its kind. In addition, you can switch on and off individu
First of all Its worth emphasizing here that this Trading System is Non-Repainting   , Non Redrawing and Non Lagging Indicator Which makes it ideal from both manual and robot trading .  Online course, manual and download presets. The Smart Trend Trading System MT5 is a comprehensive trading solution tailored for new and experienced traders . It combines over 10 premium indicators and features more than 7 robust trading strategies , making it a versatile choice for diverse market conditions . Tre
FX Levels MT5
Daniel Stein
5 (7)
FX Levels: Exceptionally Accurate Support & Resistance for All Markets Quick Overview Looking for a reliable way to pinpoint support and resistance levels across any market—currencies, indices, stocks, or commodities? FX Levels merges our traditional “Lighthouse” method with a forward-thinking dynamic approach, offering near-universal accuracy. By drawing from real-world broker experience and automated daily plus real-time updates, FX Levels helps you identify reversal points, set profit targe
FX Power MT5 NG
Daniel Stein
5 (17)
FX Power: Analyze Currency Strength for Smarter Trading Decisions Overview FX Power is your go-to tool for understanding the real strength of currencies and Gold in any market condition. By identifying strong currencies to buy and weak ones to sell, FX Power simplifies trading decisions and uncovers high-probability opportunities. Whether you’re looking to follow trends or anticipate reversals using extreme delta values, this tool adapts seamlessly to your trading style. Don’t just trade—trade
Easy Breakout MT5
Mohamed Hassan
4.6 (5)
After your purchase, feel free to contact me for more details on how to receive a bonus indicator called VFI, which pairs perfectly with Easy Breakout for enhanced confluence!    Easy Breakout MT5   is a powerful price action trading system built on one of the most popular and widely trusted strategies among traders: the   Breakout strategy ! This indicator delivers crystal-clear Buy and Sell signals based on breakouts from key support and resistance zones. Unlike typical breakout indicators
Magic Histogram MT5
Evgeny Belyaev
5 (1)
The   Magic Histogram MT5   indicator is a universal tool, suitable for scalping and medium-term trading. This indicator uses an innovative formula and allows you to determine the direction and strength of the trend.   Magic Histogram MT5   is not redrawn, so you can evaluate its efficiency using history data. It is most suitable for M15, M30, H1 and H4. Magic Histogram  for the MetaTrader 4 terminal :  https://www.mql5.com/en/market/product/23610 Indicator Benefits Excellent indicator signals!
Gartley Hunter Multi
Siarhei Vashchylka
5 (11)
Gartley Hunter Multi - An indicator for searching for harmonic patterns simultaneously on dozens of trading instruments and on all possible timeframes. Manual (Be sure to read before purchasing) | Version for MT4 Advantages 1. Patterns: Gartley, Butterfly, Shark, Crab. Bat, Alternate Bat, Deep Crab, Cypher 2. Simultaneous search for patterns on dozens of trading instruments and on all possible timeframes 3. Search for patterns of all possible sizes. From the smallest to the largest 4. All fou
IQ Gold Gann Levels a non-repainting, precision tool designed exclusively for XAUUSD/Gold intraday trading. It uses W.D. Gann’s square root method to plot real-time support and resistance levels, helping traders spot high-probability entries with confidence and clarity. William Delbert Gann (W.D. Gann) was an exceptional market analyst, whose trading technique was based on a complex blend of mathematics, geometry, astrology, and ancient mathematics which proved to be extremely accurate. Download
This dashboard shows the latest available   harmonic patterns   for the selected symbols, so you will save time and be more efficient /   MT4 version . Free Indicator:   Basic Harmonic Pattern Comparison of "Basic Harmonic Pattern" vs. "Basic Harmonic Patterns Dashboard" Indicators Feature Basic Harmonic Pattern Basic Harmonic Patterns Dashboard Functionality Detects and displays harmonic patterns on a single chart Searches multiple symbols and timeframes for harmonic patterns, displays res
More from author
Supply demand zone with added Alerting system. Why this supply demand indicator is different? Zones are not traditional zones. these are KIRI zones. these are high probability zones where market reacts no matter how much. Most people including me have been missed out of trade because we somehow got distracted. no worries, i have added an alert to our zones now. (Metatrader doesn't show alerts in strategy tester) Most people dont know when to enter the market when it comes to zone based trading.
EURUSD EA tested over 25 years from 2000 till today Pure price + time + quant mathematics. Please make " Enable Auto-algo selection based on broker " this flag to true before you test. You will not find a single EA on this platform that has been tested for such big data, all EAs here are martingales that fails no matter what and when they fail you lose it all. Message me if you need any help or if you are not able to regenerate the same results. Indicator setting :  Make sure you have enabled t
EURUSD EA tested over 25 years from 2000 till today Pure price + time + quant mathematics. Please make " Enable Auto-algo selection based on broker " this flag to true before you test. You will not find a single EA on this platform that has been tested for such big data, all EAs here are martingales that fails no matter what and when they fail you lose it all. Message me if you need any help or if you are not able to regenerate the same results. Indicator setting :  Make sure you have enabled th
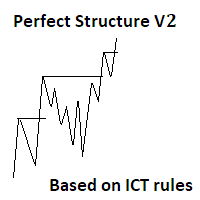
Here is the V3 of perfect market structure. Whats new? Coded based on ICT rules. No more trend confusions...-- Added labels to show current trend No more timeframe juggling and missing out important points, -- Now You can add indicator multiple times to mark multi timeframe market  structure on the same chart window( 1D market structure on 4H or may be 4H market  structure on 15 min timeframe and more.....) No more waiting in large range as sometimes market makes huge ranges and starts making im
3 Trading Strategies to Exploit Market Structure (Without Overcomplicating It) Trading isn’t about predicting the future—it’s about spotting patterns, managing risk, and acting when odds favor you. Below are two timeless strategies (and one hybrid) that align with how markets   actually   move, not how we wish they would. Some of the strategies you can trade with the indicator [ Note] Higher timeframe should be 15x of the lower timeframe, for eg. htf 15min, ltf 1min. 1. The Breakout Trap: Trad
This is the finest structure marking you will ever find in any market. indicator is coded considering the actual structure any trader would use. indicator is coded based on actual candle breaks and not coded based on any pivot or predefined values or specific number of candles high and low. please check out the screenshot. if you want me to fine tune it according to your needs then i am open for it. Thank you :) Always open to feedback and criticism if it helps me provide you more value. - Rahul
V2 of the Perfect structure. What's Inherited from v1? This is the finest structure marking you will ever find in any market. Indicator is coded considering the actual structure any trader would use. Indicator is coded based on actual candle breaks and not coded based on any pivot or predefined values or specific number of candles high and low. Please check out the screenshot. What's new in V2? AI based approach for High accuracy by calculating maximum bars with rapid switch algorithm. Dual tim
Zone + Trend Reversal System There are many many situations you may want to use this indicator and you may not want to. Please refer the doc attached in the comment section for complete guidance. Check comments for manual. Keep in mind, Once you make the purchase please reach out to me when you are in the testing phase so i could answer your queries when you are stuck and confused because most of the time we fail because we keep going in a wrong direction without asking for the help. Read the m
RD Range System V3
Rahul Shrikrishna Dani
About the indicator  You have price range limit (red lines) that is calculated based on previous range.  You have signal (yellow star) that indicates the end of swing. When price hits the price range upper or lower limit and generates swing end signal (yellow star) then you trade for reversal. Now there are rules, you can't just simply trade, read the manual i have attached in the comments. Note that, Indicator works with all pairs and with every timeframe. While testing in strategy tester it t
FVG that is only marked above(downtrend)/below(uptrend) 50% retracement with ICT market structure. Strategy 1: False Break + FVG Confluence Setup: structure breaks -> market goes to fvg -> returns back and continue its journey marking it as a false break. fvg above 50% retracement is a very strong unfilled area which always reacts to price. Entry Rules: Enter when price hits the FVG after the false break Wait for structure to change (downtrend close : when red candle closes below swing low and
SMT aka correlation divergence between EURUSD and Strategy: False Break + SMT Setup: Structure breaks -> market structure creates smt -> structure breaks and returns to 50% level. SMT makes it a high probability trade. for low risk high reward use 1H:5Min, 4H:15Min, 1D:1H timeframes, one to find false break, other to find out SMT and structure break.  stop loss should always be at the top of the structure start(in lower timeframe when price touches false break and breaks the structure) and not a
Features List 1: FVG->iFVG Order Block High Transaction Line (Personal strategy) Premium Discount 50% and 61% Previous day high low Previous week high low Candle end countdown Feature List 2 : (Implemented based on feedback from community groups) trend identification Hide FVG, Order Block, Large Transaction line below 50% equilibrium. Hide all/Individual texts/features FUTURE Feature List (Will be implemented only if at least 5 people request for it.) Asia, London, NY lq zones Alerts for featur
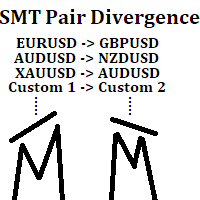
Pair correlation divergence. Define your pair in indicator setting with this format : SYMBOL1:SYMBOL2,SYMBOL3:SYMBOL4 Already Defined Symbols : EURUSD:GBPUSD,AUDUSD:NZDUSD,USDCHF:EURUSD,USDCAD:Crude,XAUUSD:AUDUSD Symbol name should match the exact case as you see it in left panel where all symbols are listed. (Indicator will not work on strategy tester, strategy tester fail to load different symbols data internally, watch video for functional usage) CAUTION   : If you drag any symbol on screen
Its an indicator that will show you Previous day high Previous day low Previous week high Previous week low You can set how many days of history you would like to see for previous day high low and previous week high low Currently 30 days of PDH/L will be marked 4 weeks of PWH/L will be marked You can change it from indicator settings. Dates are shown at marking lines to identify which date does that marking belongs to. Thank you :) Always open to feedback and criticism if it helps me provide yo
This indicator is about candle countdown timer You can change timer color 3 colors can be set for different time range You can set font size, you can set font name If you need anything extra, ping me, I will add that functionality. Thank you :) Always open to feedback and criticism if it helps me provide you more value. - Rahul  My other indicators you may like [I have been trading forex for last 6 years and i publish every indicator that i build for my personal use so everyone can benefit]
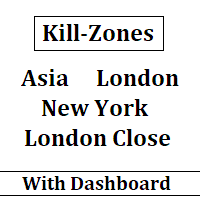
Session Kill zones with panel for quick changes. Asia Killzone London Killzone New York Killzone London Close Killzone In this indicator GMT+2 timings are used that are most common among many brokers. read the image attached in the screenshots to know more about sessions adjustments Session timings can be changed according to your broker timings and day light savings. Thank you :) Always open to feedback and criticism if it helps me provide you more value. - Rahul  My other indicators you may l
Perfect Structure V2 Mt5
Rahul Shrikrishna Dani
V2 of the Perfect structure. What's Inherited from v1? This is the finest structure marking you will ever find in any market. Indicator is coded considering the actual structure any trader would use. Indicator is coded based on actual candle breaks and not coded based on any pivot or predefined values or specific number of candles high and low. Please check out the screenshot. What's new in V2? AI based approach for High accuracy by calculating maximum bars with rapid switch algorithm. Dual tim
3 Trading Strategies to Exploit Market Structure (Without Overcomplicating It) Trading isn’t about predicting the future—it’s about spotting patterns, managing risk, and acting when odds favor you. Below are two timeless strategies (and one hybrid) that align with how markets   actually   move, not how we wish they would. Some of the strategies you can trade with the indicator [ Note] Higher timeframe should be 15x of the lower timeframe, for eg. htf 15min, ltf 1min. 1.  The Breakout Trap: Trad
Pair correlation divergence. Define your pair in indicator setting with this format : SYMBOL1:SYMBOL2,SYMBOL3:SYMBOL4 Already Defined Symbols : EURUSD:GBPUSD,AUDUSD:NZDUSD,USDCHF:EURUSD,USDCAD:Crude,XAUUSD:AUDUSD Symbol name should match the exact case as you see it in left panel where all symbols are listed. CAUTION  : If you drag any symbol on screen and indicator doesn't paint(live mode, not strategy tester) then just  Right click-> indicators list-> select divergence indicator-> edit-> ok-
Its an indicator that will show you Previous day high Previous day low Previous week high Previous week low You can set how many days of history you would like to see for previous day high low and previous week high low Currently 30 days of PDH/L will be marked 4 weeks of PWH/L will be marked You can change it from indicator settings. Dates are shown at marking lines to identify which date does that marking belongs to. Thank you :) Always open to feedback and criticism if it helps me provide yo
This indicator is about candle countdown timer You can change timer color 3 colors can be set for different time range You can set font size, you can set font name If you need anything extra, ping me, I will add that functionality. Thank you :) Always open to feedback and criticism if it helps me provide you more value. - Rahul  My other indicators you may like [I have been trading forex for last 6 years and i publish every indicator that i build for my personal use so everyone can benefit]
Session Kill zones with panel for quick changes. Asia Killzone London Killzone New York Killzone London Close Killzone In this indicator GMT+2 timings are used that are most common among many brokers. read the image attached in the screenshots to know more about sessions adjustments Session timings can be changed according to your broker timings and day light savings. Thank you :) Always open to feedback and criticism if it helps me provide you more value. - Rahul  My other indicators you may l
Filter:
No reviews
Reply to review