All in one smart Smc indicator Ict mmxm Mt5
- Indicatori
- Versione: 1.7
- Aggiornato: 2 settembre 2025
- Attivazioni: 5

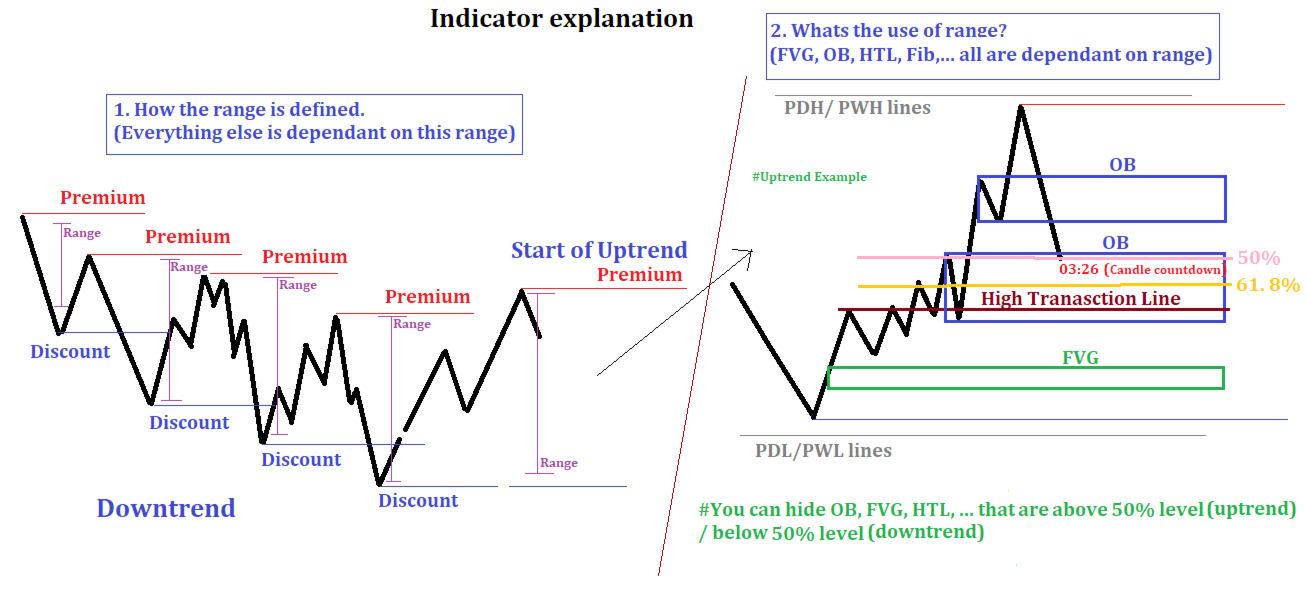
Features List 1:
- FVG->iFVG
- Order Block
- High Transaction Line (Personal strategy)
- Premium Discount
- 50% and 61%
- Previous day high low
- Previous week high low
- Candle end countdown
Feature List 2 : (Implemented based on feedback from community groups)
- trend identification
- Hide FVG, Order Block, Large Transaction line below 50% equilibrium.
- Hide all/Individual texts/features
FUTURE Feature List (Will be implemented only if at least 5 people request for it.)
- Asia, London, NY lq zones (Implemented)
- Define minimum retracement percentage to consider a swing as valid swing (Implemented)
- Alerts for features price touch
- Multi-timeframe
- Textbox that saves your notes
- Your requests/Your entry techniques(Private jobs can also be fulfilled).
This indicator is also converted to signal indicator
Thank you :) Always open to feedback and criticism if it helps me provide you more value.
- Rahul
My other indicators you may like
Advanced Multi SMT pair divergence indicator 38$
Advanced internal/external structure detections 38$