Candle Range Theory CRT
- Indicators
- Derrick Akampurira
- Version: 1.0
- Activations: 5
The range of a candlestick refers to the distance between its high and low. This concept applies consistently across all timeframes—from lower to higher. Each candlestick contains four essential data points: the open, high, low, and close. The body of the candle is formed between the open and close, while the wicks (or shadows) reflect the price movements beyond the body, revealing deeper market dynamics.
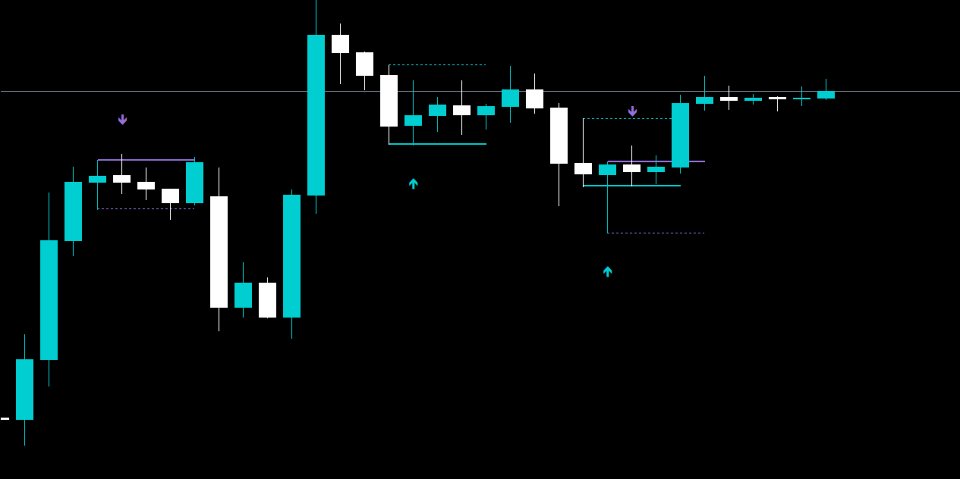
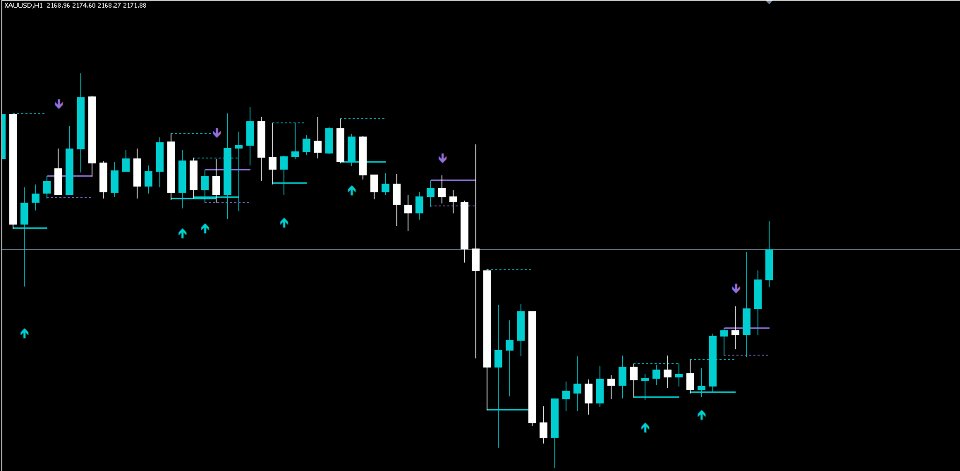
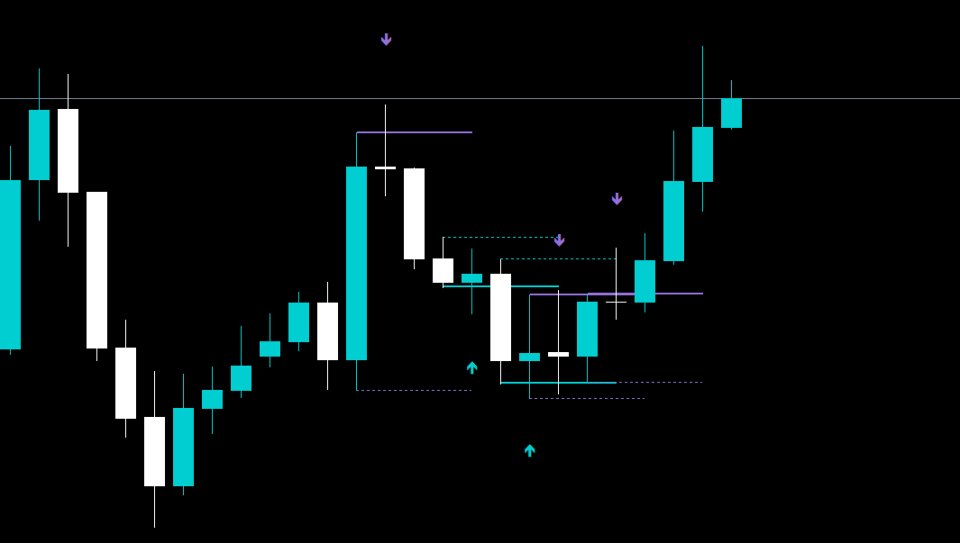
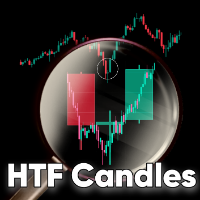
Candle Range Theory (CRT) is a powerful framework for understanding price behavior. It is based on the principle that each candlestick represents a range of price action. A higher timeframe (HTF) candlestick, when observed on a lower timeframe (LTF), unfolds as a range where price has moved between its high and low. This range is not random; rather, it follows structured patterns of market behavior.
Within these ranges, price may sweep liquidity, break out, or retest levels—movements that are often visible in candlestick patterns. These behaviors reveal the market's intent—whether it is accumulating, manipulating, or distributing. By studying how price behaves within a range, traders can derive probabilities and anticipate the market’s next move.
It’s important to note that ranges are dynamic. A single HTF candle can display varied range behavior on the LTF. However, for a trade setup to be high-probability, the range should ideally exhibit clear phases of accumulation, manipulation, and distribution. Standard or "clean" ranges tend to be less predictable. This is why combining CRT with the ICT "Power of Three" concept—accumulation, manipulation, and distribution—adds significant strength to the analysis.
