Is 3 Hull Spread
- Indicators
-
Oleksandr Medviediev
 Let Algo Shine 🙂
I have been trading FX for over 22 years, with focus on automation (started in 2004, MT3 at that time). - Version: 1.4
- Updated: 16 December 2021
- Activations: 20
3-Hull-Spread - professional cross-instrument stat.arb (Statistical Arbitrage) Indicator of the SPREAD of 3 (three) different instruments via building visual iChannel (see the equation below) that is changing its Width proportionally to the input from each instrument ("Statistical Arbitrage" based on Hull MA =HMA).
Core principle: price lines following the prices of "their" symbols after each discrepancy, constantly tending to return to the total of "synthetic" central. In other words, a system of 3 "related" instruments//pairs constantly strives to revert to their mean (so called "mean-reversion" effect).
- Works on any Instrument/TF (must open Charts/TF for all instruments used)
- Synchronization in place. After current bar is closed -- No re-paint / No re-draw
- "SetIndexBuffer" available for all variables (can be used in EA)
- Autodetect 4- and 5-digit prices
The following formulas have been used to build iChannel:
- iChannel = (S1-M) + (S2-M) + (S3-M) (red and green dots)
- Middle-line М = "synthetic" central (S1 + S2 + S3)/3 (yellow dotted line)
- Price-line Symbol-1: chart where Indicator is turned on)
- Price-line Symbol-2 (reversal=true/false - for instruments with negative correlation)
- Price-line Symbol-3 (reversal=true/false - for instruments with negative correlation)
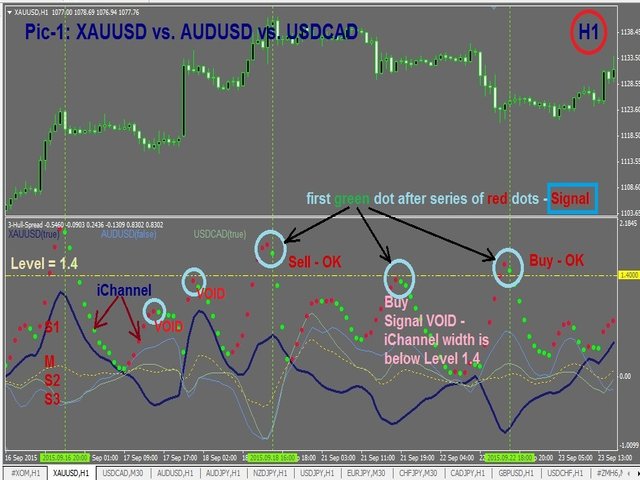
This formula allows to combine various instruments on one chart (see Fig. 1), for example:
- XAUUSD ~1100
- AUDUSD ~0.7
- USDCAD ~1.33
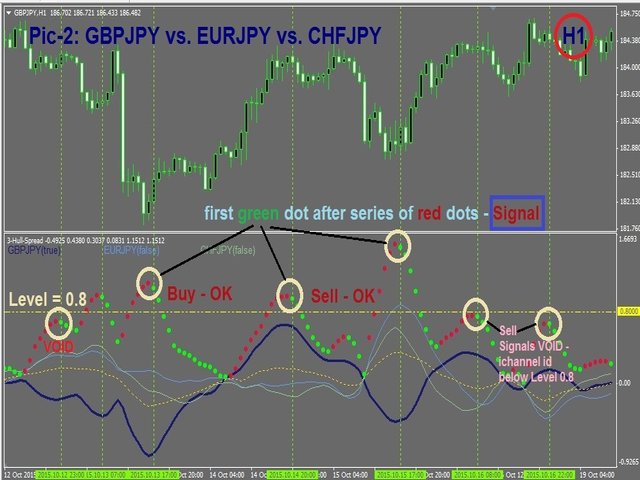
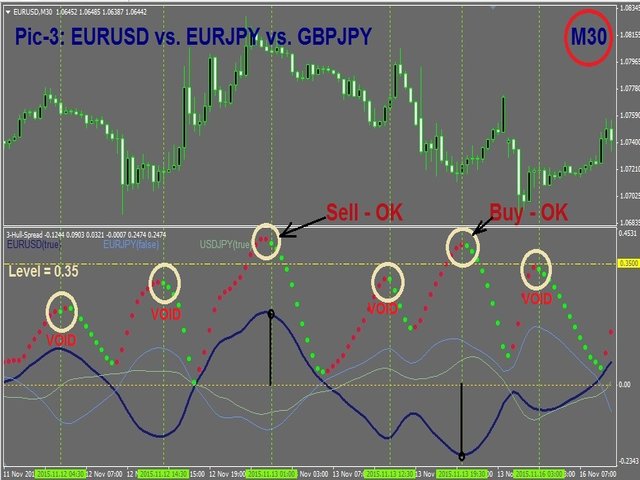
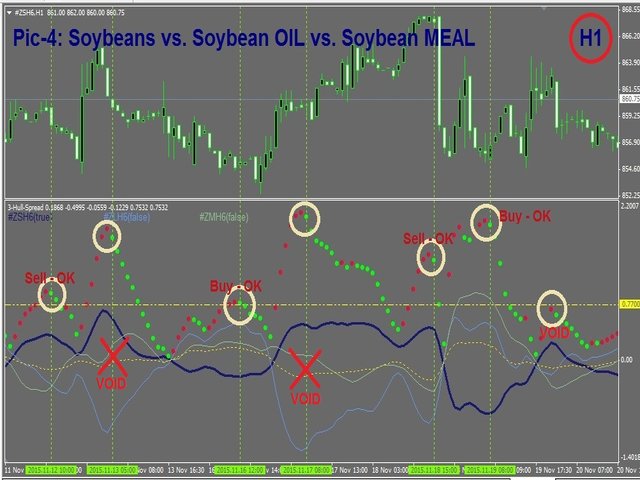
Conditions for Entry/Signal:
#1. Width of iChannel started to narrow (first green dot after series of red dots)
#2. Width of iChannel > Level
#3. Price Line S1 is on one side of Middle-line М, аnd Price Lines S2 and S3 - are on the opposite side of Middle-line М -- as following:
- Signal BUY Symbol-1: S1<M S2>M S3>M -- NOTE: iChannel width (red and green dots) is changing wider or narrower
- Signal SELL Symbol-1: S1>M S2<M S3<M -- NOTE: iChannel width (red and green dots) is changing wider or narrower
Parameters
- Inp_Fast_HMA - period of Fast moving average
- Inp_Slow_HMA - period of Slow moving average
- Inp_MA_Method - parameter of Hull MA
- Inp_MA_PriceType - parameter of Hull MA
- Inp_Symbol_1 - Symbol-1 (by default GBPJPY)
- Inp_Symbol_2 - Symbol-2 (by default EURJPY)
- Inp_S2_revers - =True in case Symbol-2 has negative correlation to Symbol-1
- Inp_Symbol_3 - Symbol-3 (by default CHFJPY)
- Inp_S3_revers - =True in case Symbol-3 has negative correlation to Symbol-1
Other Useful Information
Typical EXAMPLES of highly correlated 3-way instruments:
- GOLD vs. gold-forming currency pairs AUDUSD, USDCAD and NZDUSD
- GOLD vs. Crude/WTI and Brent/BRN
- Stocks vs. Indices (S&P500, NASDAQ, DJIA etc.)
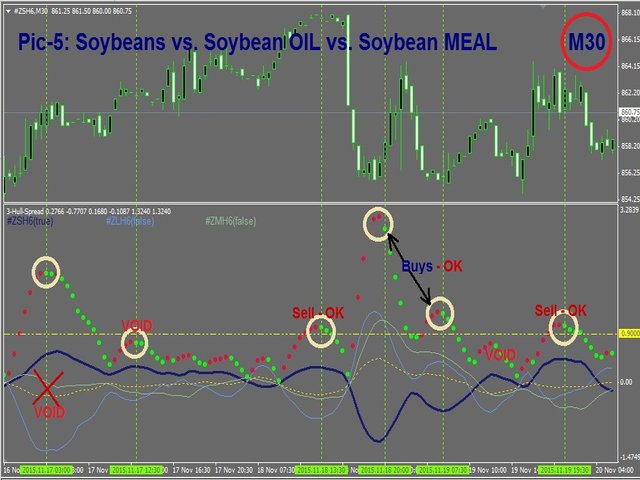
- Soybean Meal March 2016 (ZMH16) vs Soybean Oil March 2016 (ZLH16) vs Soybeans March 2016 (ZSH16), etc.
Complete list of 120 classic 3-way combinations of currency pairs - see link in the Comments section.
NOTE: for classic 3-way combinations (where participating 3 currencies only) - Middle-line М will be always a straight line.
Отличный индюк. Спасибо! Занимает какое то время разобраться как он работает и что показывает, но сейчас с уверенностью могу сказать что это моя лучшая покупка на маркете