Is 3 Hull Spread
- 指标
- 版本: 1.4
- 更新: 16 十二月 2021
- 激活: 20

3-Hull-Spread - 通过构建可视化 iChannel(参见下面的公式)来显示 3(三)种不同工具的专业跨工具指标,该通道根据每个工具的输入按比例改变其宽度(“统计套利”基于 船体MA=HMA)。
核心原则:价格线在每次出现差异后跟随“它们”符号的价格,不断趋向于回到“合成”中心的总和。 换句话说,由 3 个“相关”工具//对组成的系统不断努力恢复其平均值(所谓的“均值回归”效应)。
适用于任何仪器/TF(必须打开所有使用的仪器的图表/TF)
同步到位。 当前栏关闭后 -- 不重新绘制/不重新绘制
“SetIndexBuffer”适用于所有变量(可在 EA 中使用)
自动检测 4 位数和 5 位数价格
以下公式用于构建 iChannel:
iChannel = (S1-M) + (S2-M) + (S3-M)(红点和绿点)
中线 М =“合成”中央 (S1 + S2 + S3)/3(黄色虚线)
在哪里
价格线符号-1:指标打开的图表)
价格线符号-2(反转=真/假 - 对于具有负相关性的工具)
价格线符号-3(反转=真/假 - 对于具有负相关性的工具)
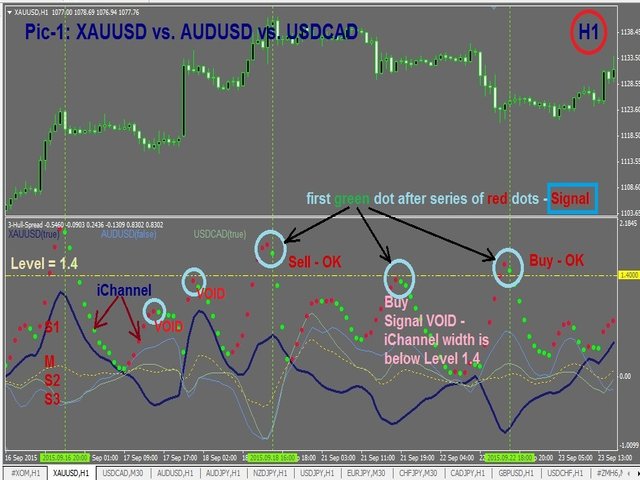
该公式允许在一张图表上组合各种工具(见图 1),例如:
黄金美元 ~1100
澳元兑美元 ~0.7
美元加元 ~1.33
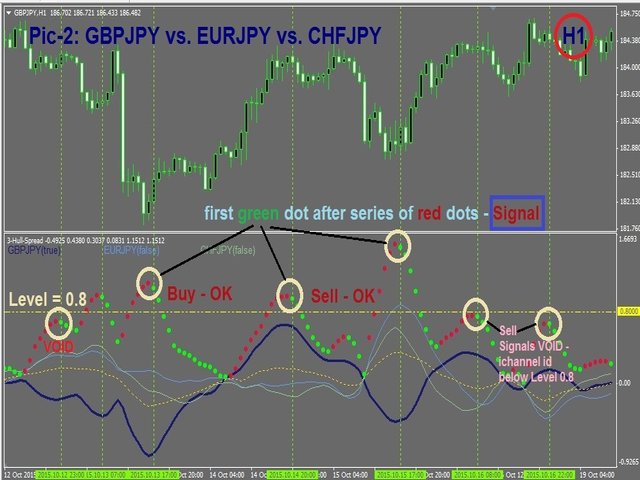
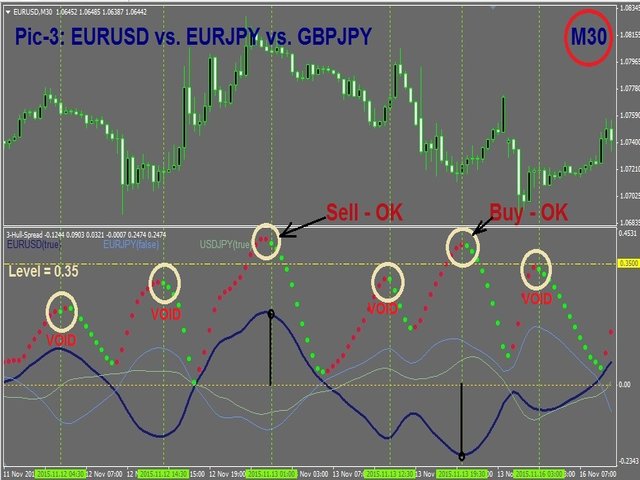
信号条件:
#1. iChannel 的宽度开始变窄(一系列红点之后的第一个绿点)
#2. iChannel 的宽度 > 电平
#3。 价格线 S1 位于中线 М 的一侧,价格线 S2 和 S3 - 位于中线 М 的另一侧 - 如下:
信号买入符号-1:S1<M S2>M S3>M -- 注意:iChannel 宽度(红点和绿点)正在变宽或变窄
信号卖出符号-1:S1>M S2<M S3<M -- 注意:iChannel 宽度(红点和绿点)正在变宽或变窄
参数
Inp_Fast_HMA - 快速移动平均线周期
Inp_Slow_HMA - 慢速移动平均线周期
Inp_MA_Method - Hull MA 的参数
Inp_MA_PriceType - Hull MA 的参数
Inp_Symbol_1 - Symbol-1(默认为 GBPJPY)
Inp_Symbol_2 - 交易品种 2(默认为 EURJPY)
Inp_S2_revers - =True,如果 Symbol-2 与 Symbol-1 具有负相关性
Inp_Symbol_3 - 符号 3(默认为 CHFJPY)
Inp_S3_revers - =True,如果 Symbol-3 与 Symbol-1 具有负相关性
其他有用的信息
高度相关的三向仪器的典型示例:
黄金与黄金形成货币对 AUDUSD、USDCAD 和 NZDUSD
黄金 vs. 原油/WTI 和布伦特/BRN
股票与指数(S&P500、纳斯达克、道琼斯指数等)
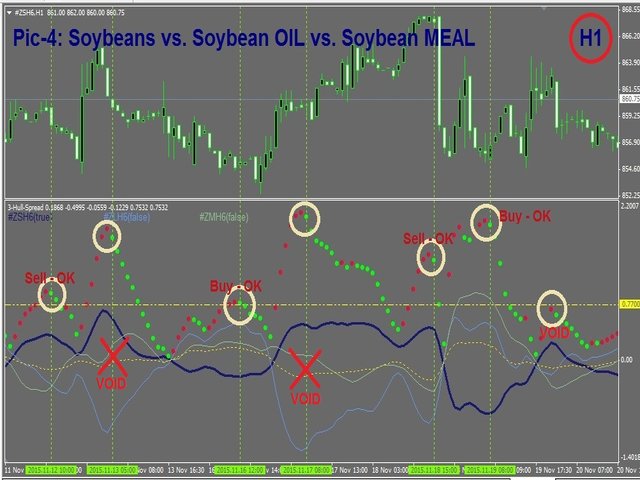
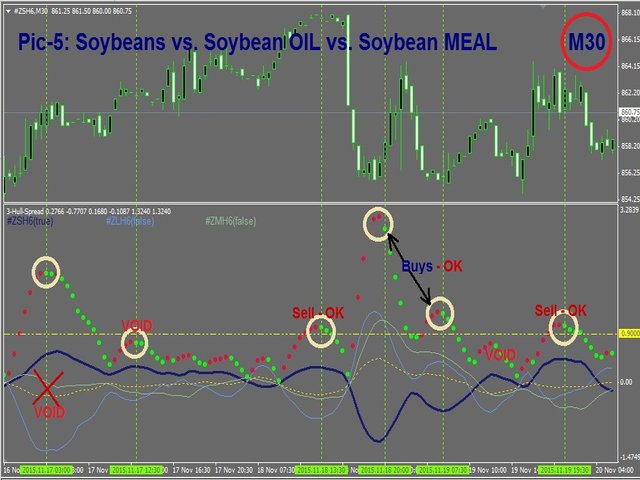
2016 年 3 月豆粕 (ZMH16) 对比 2016 年 3 月豆油 (ZLH16) 对比 2016 年 3 月大豆 (ZSH16) 等
120 种经典 3 向货币对组合的完整列表 - 请参阅评论部分中的链接。
注意:对于经典的三向组合(仅参与 3 种货币)- 中线 М 将始终是一条直线。
Отличный индюк. Спасибо! Занимает какое то время разобраться как он работает и что показывает, но сейчас с уверенностью могу сказать что это моя лучшая покупка на маркете