Is 3 Hull Spread
- Indikatoren
-
Oleksandr Medviediev
 Let Algo Shine 🙂
Ich betreibe seit über 22 Jahren Devisenhandel mit Schwerpunkt auf Automatisierung (Start 2004, damals MT3).
- Jede Transaktion ist ein Handel, außer Liebe.
- Natürliche menschliche Tendenzen sind unrentabel. - Version: 1.4
- Aktualisiert: 16 Dezember 2021
- Aktivierungen: 20
3-Hull-Spread - professioneller instrumentenübergreifender stat.arb (Statistical Arbitrage) Indikator für den SPREAD von 3 (drei) verschiedenen Instrumenten über den Aufbau eines visuellen iChannel (siehe untenstehende Gleichung), der seine Breite proportional zu den Eingaben der einzelnen Instrumente ändert ("Statistical Arbitrage" basierend auf Hull MA =HMA).
Kernprinzip: Preislinien, die den Preisen "ihrer" Symbole nach jeder Abweichung folgen und ständig dazu neigen, zur Summe der "synthetischen" Mitte zurückzukehren. Mit anderen Worten, ein System aus 3 "verwandten" Instrumenten/Paaren ist ständig bestrebt, zu seinem Mittelwert zurückzukehren (so genannter"mean-reversion" Effekt).
- Funktioniert mit jedem Instrument/TF (muss Charts/TF für alle verwendeten Instrumente öffnen)
- Die Synchronisation ist vorhanden. Nachdem der aktuelle Balken geschlossen wurde -- Kein Re-Paint / Kein Re-Draw
- "SetIndexBuffer" für alle Variablen verfügbar (kann in EA verwendet werden)
- Autodetect 4- und 5-stellige Preise
Die folgenden Formeln wurden verwendet, um iChannel zu erstellen:
- iChannel =(S1-M) + (S2-M) + (S3-M) (rote und grüne Punkte)
- Mittlere Linie М = "synthetische" Mitte (S1 + S2 + S3)/3 (gelb gepunktete Linie)
- Kurslinie Symbol-1: Chart, in dem der Indikator eingeschaltet ist)
- Kurslinie Symbol-2(Umkehrung=wahr/falsch - für Instrumente mit negativer Korrelation)
- Kurslinie Symbol-3(Umkehrung=wahr/falsch - für Instrumente mit negativer Korrelation)
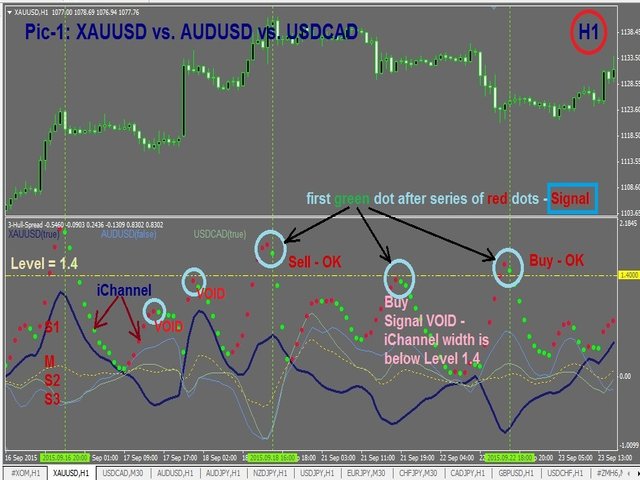
Diese Formel erlaubt es, verschiedene Instrumente auf einem Chart zu kombinieren (siehe Abb. 1), zum Beispiel:
- XAUUSD ~1100
- AUDUSD ~0,7
- USDCAD ~1,33
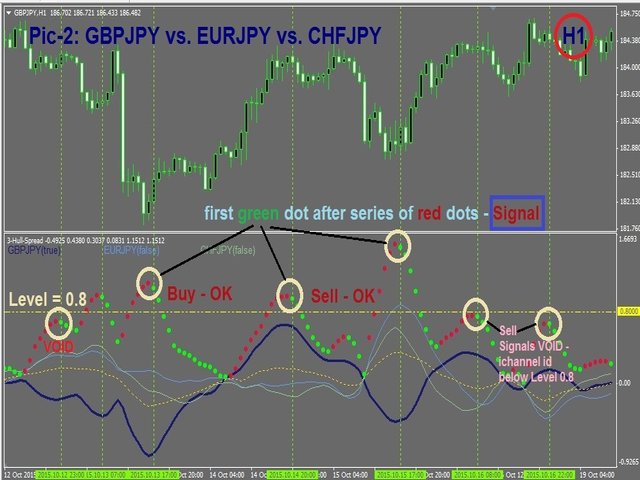
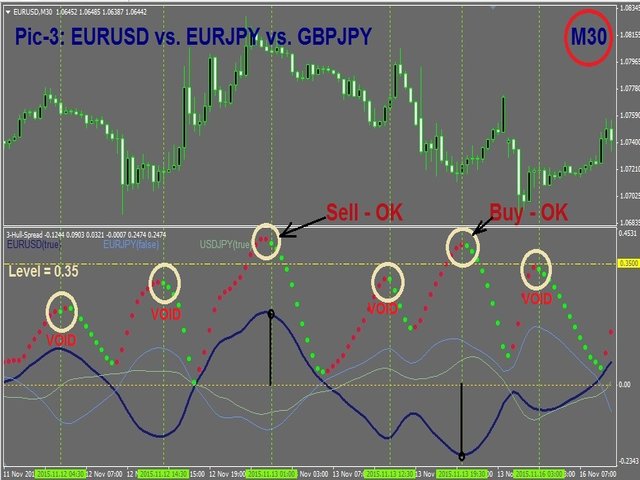
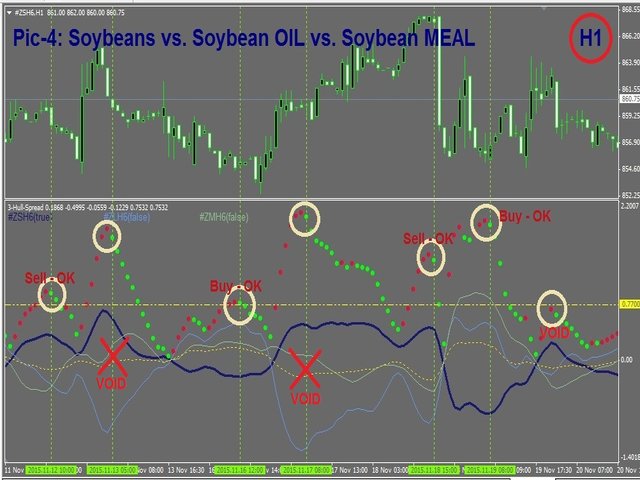
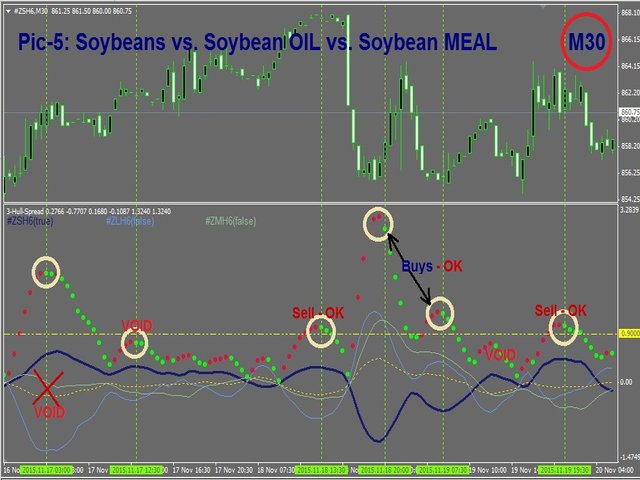
Bedingungen für den Einstieg/Signal:
#1. Breite des iChannel begann sich zu verengen (erster grüner Punkt nach einer Reihe von roten Punkten)
#2. Breite des iChannel > Level
#3. Die Kurslinie S1 befindet sich auf einer Seite der Mittellinie М, und die Kurslinien S2 und S3 - befinden sich auf der gegenüberliegenden Seite der Mittellinie М -- wie folgt:
- Signal KAUFEN Symbol-1: S1<M S2>M S3>M -- HINWEIS: Die Breite des iKanals (rote und grüne Punkte) wird breiter oder schmäler
- Signal SELL Symbol-1: S1>M S2<M S3<M -- HINWEIS: iChannel-Breite (rote und grüne Punkte) ändert sich breiter oder schmaler
Parameter
- Inp_Fast_HMA - Zeitraum des schnellen gleitenden Durchschnitts
- Inp_Slow_HMA - Zeitraum des langsamen gleitenden Durchschnitts
- Inp_MA_Methode - Parameter des Hull-MA
- Inp_MA_PriceType - Parameter des Hull-MA
- Inp_Symbol_1 - Symbol-1 (standardmäßig GBPJPY)
- Inp_Symbol_2 - Symbol-2 (standardmäßig EURJPY)
- Inp_S2_revers - =True, falls Symbol-2 eine negative Korrelation zu Symbol-1 hat
- Inp_Symbol_3 - Symbol-3 (standardmäßig CHFJPY)
- Inp_S3_revers - =True, wenn Symbol-3 eine negative Korrelation zu Symbol-1 hat
Andere nützliche Informationen
Typische BEISPIELE für hoch korrelierte 3-Wege-Instrumente:
- GOLD vs. goldbildende Währungspaare AUDUSD, USDCAD und NZDUSD
- GOLD vs. Rohöl/WTI und Brent/BRN
- Aktien vs. Indizes (S&P500, NASDAQ, DJIA usw.)
- Sojabohnenmehl März 2016 (ZMH16) vs. Sojabohnenöl März 2016 (ZLH16) vs. Sojabohnen März 2016 (ZSH16), etc.
Vollständige Liste von 120 klassischen 3-Wege-Kombinationen von Währungspaaren - siehe Link im Abschnitt Kommentare.
HINWEIS: Bei klassischen 3-Wege-Kombinationen (an denen nur 3 Währungen teilnehmen) ist die Mittellinie М immer eine gerade Linie.
Отличный индюк. Спасибо! Занимает какое то время разобраться как он работает и что показывает, но сейчас с уверенностью могу сказать что это моя лучшая покупка на маркете