Watch the Market tutorial videos on YouTube
How to buy а trading robot or an indicator
Run your EA on
virtual hosting
virtual hosting
Test аn indicator/trading robot before buying
Want to earn in the Market?
How to present a product for a sell-through
New Technical Indicators for MetaTrader 4 - 24

The Gann Hi-Lo indicator is a powerful tool for trend analysis.
This modified version colors the signal line and chart candles according to the trend direction.
In an uptrend, the candles and the line appear in a bullish color, while in a downtrend, they are displayed in a bearish shade.
This makes it easier to visually identify trend changes and provides traders with clear guidance.
Thanks to the simple interpretation of the indicator, traders can quickly react to market movements and make wel
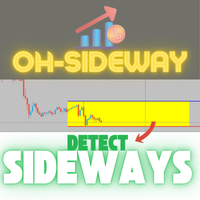
The indicator continuously calculates the current ATR value and displays it on the chart. If an adjustable threshold is undershot, a channel is automatically drawn to indicate a possible sideways movement. As soon as this threshold is exceeded again, the channel is removed from the chart. This is intended to show that the current market movements are weak and the channel shows a possible direction of a sideways movement in the market.
In addition to the threshold, the scaling of the ATR value
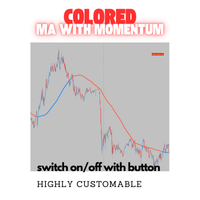
The indicator generates buy and sell signals based on a combination of a modified moving average with a trend momentum algorithm.
To ensure clarity on the chart, this indicator can be switched on and off using a freely positionable button.
Note: If you use this indicator multiple times, e.g. to display different MA periods, then you must change the "button label (ID)" in addition to the period to ensure it works. The label when pressed should also be changed accordingly for a clear overview.
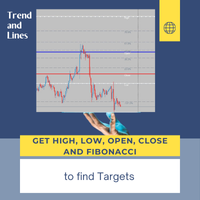
This indicator draws lines at the open, close, high and low price of the last chart candle from the set timeframe.
In addition, a label shows whether it was an up or down candle.
The standard settings follow the original idea of getting the price data from the daily timeframe for day trading/scalping, but
since this indicator is fully customizable, you can also set a different timeframe.
Based on the drawn price lines, you can then also display Fibonacci levels.
This function can also be
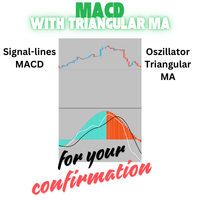
This indicator uses the signal lines of the MACD and uses Triangular MA as Oscillator. It is a good addition to trading decisions and part of the OH strategy.
Optimal trade confirmation occurs when the signal lines of the MACD coincide with the trend color of the Triangular Oscillator.
Of course everything important can be changed.
This indicator is part of the OH-Strategy, you can view other indicators of this strategy if you click on my name as a seller.
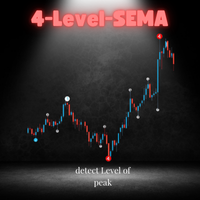
Well known to most, this indicator identifies the chart peaks and assigns the level of the peak. By classifying the peaks into levels, not only is a possible consolidation indicated but also the possible strength up to the highest level that indicates that a trend reversal is likely.
While most SEMA indicators work with 3 levels, this indicator has 4 levels.
This indicator is part of the OH-Strategy. You can view other indicators of this strategy if you click on my name as a seller.

ForexFire Renkotrader Recognize profitable entries & trade with confidence! Highlights: Precise signals – Identifies reversal candles in the trend EMA filter - Uses Ema`s for reliable signals Intelligent signal limiting - Only qualified signals are displayed Easy to use – Perfect for beginners & professionals Visual support - arrows in the chart + SL display in the chart Notifications – Receive alerts & push notifications This is how the indicator works: Long Signal:

Trendfollow Indicator - with Stoploss and Trailingstop Accurate Signals – Identifies trend reversal candles Filter – for better trend detection Intelligent signal limitation - Only qualified signals in the trend direction are displayed Easy to use – Perfect for beginners & professionals Visual support – arrows in the chart + display in real time Notifications – Receive alerts & push notifications The indicator also provides the initial stoploss. As the position progresses, this is us
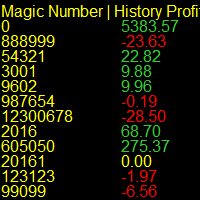
Running multiple EA's on your account and confused by who's winning and who's loosing? Try this indicator that report's in real time on the Magic Numbers in your account by reading the History_trades along with the Open_trades. Note: Manual trades are grouped under Magic Number "0". For a better visual report, run it on a symbol that you don't execute trades on, switch the history bars to "Line Charts" and set it's color to Black.
FREE

Master alert is an indicator based on deep mathematical and statistical calculations. It generates two types of signals; Buy signals Sell signals It uses the following indicators to generate signals; Adx CCI SAR MACD MA WPR MOM When the indicator shows 6 or more of the above indicators with the same buy signal on the dashboard the market is trending up. It is a good time to place buy order. When the indicator shows 6 or more of the as above signals with the same sell signals the market is trendi
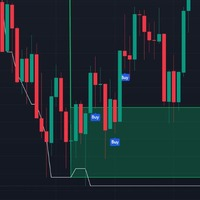
MACDx RSI Supply And Demand Indicator is a dynamic trading indicator designed to identify potential reversal zones in financial markets by combining the momentum insights of the Relative Strength Index (RSI) with order block (supply/demand) levels derived from a MACD-based custom tool. It visually highlights bullish and bearish zones on the chart, offering clear entry signals through directional arrows. Ideal for swing traders and reversal strategists, this tool aims to capture price reversals

Range indicator is a mt4 indicator that shows various levels to enter and Exit a trade. Once you have installed the indicator in the terminal you will see on the trading dashboard various values which include; Support level in pips from the current price, Resistance level in pips from the current price, Stop loss level in pips from the current price to exit if market conditions change
Range bound is a mt4 indicator that shows various levels to enter the market. It uses MACD as the primary reference indicator. When MACD oscillator is showing buy or sell signals these are displayed on your trading dashboard but as levels to buy or sell on the main chart. The indicator shows blue signals and red signals That are support and resistance levels. In short this indicator shows ranges where your trades should be safe from market changes against your order.
Volonacci Indicator It is an indicator that combines Fibonacci and volume to determine the price direction This indicator helps you identify Fibonacci angles according to the strategy The Volonacci indicator is indeed an interesting combination of Fibonacci levels and volume. This indicator uses Fibonacci tools to identify potential support and resistance levels, and enhances this by using volume to confirm the strength behind the price action.
MT5 Version https://www.mql5.com/en/market/produc

Arrow up down is a mt4 indicator that shows various levels to enter the market. It consists of two signals; Buy signal Sell signal Buy signals are shown as blue arrows on the chart once you install the indicator. Sell signals are shown as red signals on the chart. The indicator uses other underlying indicators like moving average together with statistical calculations to generate signals.

RSI bands indicator is a mt4 indicator that shows various levels to enter trades based on market conditions. It consists of the below buffers; Yellow buffer Blue buffer White buffer When the yellow buffer is above blue buffer the market is trending up good place to open buy order. When the blue buffer is above yellow buffer the market is trending downwards good time to place sell order. Also another alternative scenario is when yellow buffer is above upper white band buffer indicates strong uptr

Rsi with Bollinger bands is a mt4 indicator that shows various levels to enter trades in the market based on conditions. It consists of two main buffers; Yellow buffer that is the current price Grey buffer that shows overbought and oversold levels. When the yellow buffer crosses 70 zone in grey buffer market is trending upwards. When the yellow buffer crosses below 30 zone in the grey buffer the market is showing a strong downtrend. The overbought and oversold levels are customizable in the ind

very simple indicator to help with fast risk management during volatility.
~Displays: - stop loss in points of your choice. - take profit in points of your choice. - what lot size to risk on the trade relative percentage.
~Values that can be changed: - take profit points. - stop loss points. - risk in percentage. - color of lines. - width of lines. - linestyle. - buy / sell trade.
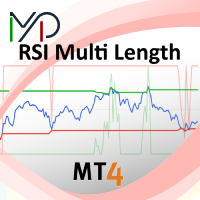
This indicator provides insights into Relative Strength Index (RSI) values over multiple timeframes. It highlights the percentage of RSIs across varying periods that are classified as overbought or oversold, and also calculates the average of these RSIs. The percentage of overbought or oversold RSIs is further utilized to define adaptive thresholds for these levels. Settings: Maximum Length: Specifies the longest RSI period used in the calculations. Minimum Length: Specifies the shortest RSI pe
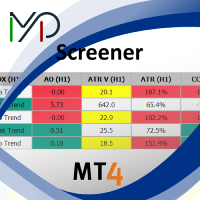
The MP Screener is a powerful and user-friendly tool designed for traders who need to filter and analyze multiple symbols based on various technical criteria. Whether you are a scalper, day trader, or swing trader, this screener helps you quickly identify the best trading opportunities in the market by scanning multiple timeframes and indicators in real time. With the MP Screener, traders can streamline their market analysis, making it easier to focus on profitable setups while saving time. Unl

Spread & Candle Close Timer Indicator for MT4 Optimize your trading with this lightweight and efficient indicator, designed to display the real-time spread and candle close countdown directly on your MT4 chart. Features: Live Spread Monitoring – Instantly see market conditions. Candle Close Timer – Stay prepared for the next price movement. Simple & Non-Intrusive Design – No unnecessary settings, just clear and accurate data. Ideal for scalpers, day traders, and those who need real-time exec

Levels price is a mt4 indicator that shows various levels to enter the market based on indicator calculations. The indicator consists of the following buffers; Red buffer Blue buffer Purple buffer The blue buffer is the resistance level where price is expected to bounce back. The red buffer is the support level based on the current market price. There is also a purple buffer below red buffer that can indicate the current support and resistance levels have been breached when price crosses this p

Mt support and resistance is an indicator that shows various levels to buy or sell based on prevailing market conditions. The main basis of the indicator is support levels and resistance levels. It consists of; Red buffer Blue buffer Purple buffer The blue buffer is resistance level where price is supposed to return back. The red buffer is the support level where price should bounce back.

Previous day levels is a mt4 indicator that shows various levels to buy or sell in the market based on prevailing market conditions. The main theory behind this indicator is support and resistance levels. The indicator uses previous day values in calculations to get the support and resistance levels for the next day period. This indicator consists of two purple buffers. The top buffer is the resistance level and the bottom buffer is the support level.

Principle of Operation 1. Data Retrieval:
The indicator gathers real-time data on the trading instrument, including: Minimum and maximum lot sizes Tick value Spread Number of digits Account data (balance, currency) 2. Connection Check:
If there is no connection to the broker, a message is displayed on the chart, and no further calculations are performed. 3. Optimal Lot Size Calculation: Risk Determination: The indicator considers the specified risk value (e.g., 2% of the account balance) and

Binary Win 60 Description of the Binary Win 60 Indicator for MT4 Binary Win 60 is a professional tool for binary options trading, designed to operate on the M5 (5-minute) timeframe. The indicator is ideal for trading popular currency pairs, such as: AUDCAD, AUDNZD, CHFJPY, EURCAD, EURAUD, EURCHF, EURGBP, EURNZD, GBPAUD, GBPJPY, GBPUSD, USDJPY. Key Features: Clear arrow signals: Green arrow — Buy option signal. Red arrow — Sell option signal. Instant alerts: When a signal appears, the in

Wall Street Indicator – Your Key to Trading Success! Tired of tools that promise the world but fail to deliver results? Designed for MT4, the Wall Street Indicator is the ultimate solution to elevate your trading to the next level. This indicator has been meticulously developed to provide clear, reliable, and precise signals. Here's why the Wall Street Indicator is the perfect choice for both beginners and experienced traders: Unmatched Performance – Proven Results 1-year detailed backtest: With

1.Supply and demand are one of the core strategies used in trading. It focuses on the ancient laws of supply and demand, as well as the trends of prices in a free flowing market. The basis of this strategy is that the quantity of available tools and the demand for tools from buyers determine the price. It marks on the chart the areas where demand overwhelms supply (demand regions), driving prices up, or where supply overwhelms demand (supply regions), driving prices down. Most supply and demand
FREE
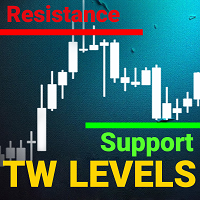
support resistance levels indicator mt4: This tool is a multi-timeframe indicator that identifies and plots support and resistance lines, as well as Fibonacci levels, on a chart with the same accuracy as the human eye. TW support and resistance levels for forex has complex algorithm that scans the chart to identify previous levels of price stabilization and rebounds, recording the number of touches.
Are you tired of manually drawing support and resistance levels and Fibonacci retracements? Ch
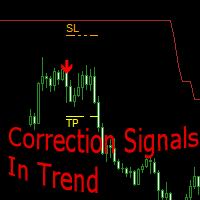
Correction Signals In Trend - a technical indicator that analyzes the market dynamics, helps the trader determine the trend direction and find points for opening orders.
The indicator follows the trend in the format of support and resistance lines and shows an upward or downward trend.
In the trend direction, after the end of the correction, a search for signals is performed. Arrows indicate potential moments for trading operations.
For each signal, the recommended SL and TP levels are displayed

The Volume Bar POC Indicator is an innovative tool that provides precise visualization of key price levels (Point of Control, POC) based on tick volume trades. This indicator analyzes each price point within individual candles and displays the most significant levels, which can be used as strong support and resistance zones. Ideal for both intraday and long-term trading strategies. How does the Volume Bar POC Indicator work? The indicator uses an advanced process to calculate the POC during the
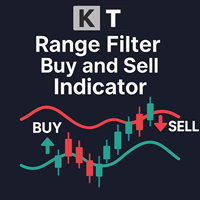
The KT Range Filter Buy and Sell simplifies minor price movements and fluctuations, transforming them into a smoother, more defined trend. While QQE smoothing is typically applied to RSI, It applies the concept directly to price, offering a unique and effective approach to market analysis.
It features a three-band structure, consisting of a main averaging line flanked by an upper and a lower band. These bands are calculated using a range multiplier, providing a clear visual representation of p
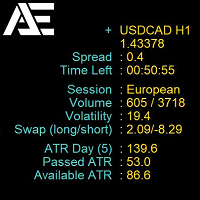
Market Info Display is a universal indicator that displays important market information organized in a user—friendly interface directly on the chart. Its functions are designed to efficiently display data that helps traders make informed decisions. It provides data on the current spread, time to candle close, current trading session, volume, volatility, daily price change, and ATR (Daily volatility).
The indicator supports multilingual settings (Russian and English), which makes it convenient

Trend Master ZA Indicator Unlock the power of trend analysis with the Trend Master ZA Indicator, a sophisticated tool designed for traders who seek to combine multiple technical strategies into one seamless solution. Built with advanced features and customization options, this indicator provides deep insights into market trends and price action dynamics.
Key Features: Trend Analysis with Bollinger Bands : Utilize the power of Bollinger Bands to identify market trends, with customizable period a
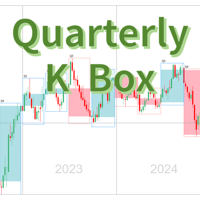
Quarter K Box Indicator Description Product Name Quarter K Box Indicator Product Overview The Quarter K Box Indicator is a technical analysis tool specifically designed for forex, stock, and futures traders. It displays the range of quarterly candlesticks (high, low, open, and close) on monthly, weekly, daily, and smaller timeframe charts . By drawing clear background boxes, this indicator helps traders quickly identify quarterly trends and key support/resistance zones in the market. Whether y

The Stochastic RSI (StochRSI) is a technical indicator that combines the characteristics of the Relative Strength Index (RSI) with the Stochastic Oscillator, resulting in a more sensitive tool that generates a higher number of trading signals. Developed by Tushar Chande and Stanley Kroll, the indicator was designed to overcome a perceived limitation of the traditional RSI: the low frequency of overbought and oversold levels activation (commonly 80 and 20), especially in less volatile assets. How
FREE

This is an indicator that seeks to show consolidation zones .
Discover the Power of Prediction with the Limiar Latus Indicator ! An innovative indicator designed for traders seeking to identify and anticipate crucial turning points in sideways market movements. Key Features: Predicting Changes: Utilizes advanced algorithms to detect sideways patterns, allowing you to anticipate significant movements before they happen. Clear Visual Analysis: With intuitive rectangles representing con

The Grand Signal indicator is a unique tool that not only provides an understanding of market behavior but also precisely identifies trend entry points after intraday correction limits, with accuracy down to a five-minute candlestick! It includes individual settings for each currency pair. After purchasing, be sure to message me directly for instructions! Telegram: @Lapinsania or here in the Market! I
Extreme Breakout Signal is a trading strategy based on price breaking through key support or resistance levels. It indicates potential trend shifts, allowing traders to capture new upward or downward movements.
Parameter extreme radius: extreme radius(Different parameters can be set for different periods) Key Principles Support & Resistance : Prices often reverse near these levels; breaking them may signal a new trend. Confirmation : Use volume or other indicators to verify the breakout's valid

"The upgraded version of the Gold heat map. The indicator is more effective on the gold chart, where daily opportunities will appear clearly before you. Levels14Golden , introduces the integration of supports, resistances, and time, along with significant enhancements."
1. **Heatmap for Price Dynamics**: A heatmap has been added to indicate the intensity of price movements, ranging from **45 to 630 degrees**. - **Major Levels**: Marked in **blue**, as shown in the video. - **Sec

The KT Dynamic Price Oscillator (DPO) offers a specialized approach to analyzing the trend, momentum, and volatility of financial instruments. It excels at identifying trend continuations, overbought or oversold conditions, and potential reversal points with precision. It is specifically designed to assist traders in identifying short-term price cycles and potential reversals by effectively filtering out long-term trends.
How to use the DPO
Trend Confirmation: The DPO acts as a reliable confir
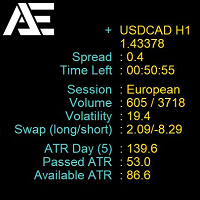
На графике EURUSD это БЕСПЛАТНО. Версия со всеми символами! Свяжитесь со мной по любым вопросам
Market Info Display — это универсальный индикатор, отображающий важную рыночную информацию, организованную в удобном интерфейсе прямо на графике. Его функции рассчитаны на эффективное отображение данных, которые помогают трейдерам принимать взвешенные решения. Он предоставляет данные о текущем спреде, времени до закрытия свечи, текущей торговой сессии, объеме, волатильности, изменении цены за де
FREE

If you're familiar with trading using Dinapoli levels, then this indicator is definitely worth your attention. It automatically plots key levels such as COP (Change of Polarity), OP (Objective Price), and XOP (Extended Objective Price) on your charts, regardless of the timeframe you choose to work with.
One of the standout features of this indicator is its ability to generate alerts. Whenever a new ABC pattern is automatically identified and plotted by the indicator, you will receive a notifica

Trump Arrow is for trading the trends of the markets. It uses convergence and divergence. Use it during active times to get behind a trend and follow it with MA filters or other strategies you have. The indicator works well for small time frames just and it suggests using 15 min. Others work too but for day trading 5-15 is best. 1 hr charts if you want to filter for longer term trends.

Session Liquidity is the most anticipated trading strategy among the ICT trader. With this indicator you could frame the trade by simply deploying it on the chart. By simply inputting the Asian Opening Time, New York Opening Time, and choose the color option and display option you like then you will get the session laid down for you on the chart. You can choose between showing session as box or horizontal line. I personally trade this strategies for quite sometimes.

Waterfall Trading Indicator Overview The Waterfall Trading Indicator is a powerful momentum detection tool designed to identify high-probability trading opportunities across multiple timeframes. Built on pure price action analysis, this indicator provides clear, non-repainting signals that are especially effective for binary options and forex trading. Key Features Non-Repainting Signals : Based on real-time price action, ensuring reliable trade signals Multi-Timeframe Compatibility : Effective a

MT4 Version https://www.mql5.com/en/market/product/129411 MT5 Version https://www.mql5.com/en/market/product/129412
Dashboard Scanner Kalman – Multi-Pair, Multi-Timeframe Scanner All-in-One Scanner for Smart Trend Detection Using Kalman Filter Technology Dashboard Scanner Kalman is an advanced scanner based on the modified Kalman Filter Trend Levels algorithm, designed to monitor trend direction, signal levels, and trend strength across multiple timeframes and multiple symbols simultan

DYJ BoS MT4 Indicator: A Smart Way to Identify Market Structure Shifts The DYJ BoS MT4 Indicator is designed to automatically detect and highlight key market structure shifts, including: Break of Structure (BoS): This occurs when the price experiences a significant movement, breaking previous structural points. Trendline Break Confirmation: The indicator marks potential up trend and down trend lines (UP & DN) , representing continuous higher highs and lower lows. When the price breaks
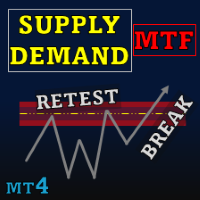
Special offer : ALL TOOLS , just $35 each! New tools will be $30 for the first week or the first 3 purchases ! Trading Tools Channel on MQL5 : Join my MQL5 channel to update the latest news from me Supply Demand Retest and Break Multi Timeframe , this tool plots supply and demand zones based on strong momentum candles, allowing you to identify these zones across multiple timeframes using the timeframe selector feature. With retest and break labels, along with customizable valid

Bull and Bear Strength Indicator Overview:
The Bull and Bear Strength Indicator is a versatile and intuitive tool designed to give traders a decisive edge. It captures the balance of power between bulls and bears, providing actionable insights into market sentiment and momentum for any timeframe or instrument. The Bull and bears strength indicator allows you to see the areas where momentum and volume has peaked. It highlights areas of strength within a range. A truly simple indicator with p
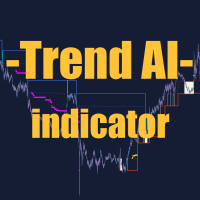
Trend AI Indicator Description:
Trend AI Indicator is a powerful market analysis tool that uses artificial intelligence to identify trends and key levels. The indicator automatically adapts to changing market conditions, providing accurate data for decision-making. Key Features: Trend Identification: The indicator uses machine learning algorithms to accurately determine the direction of the trend (uptrend, downtrend, sideways). Key Levels: Automatically builds support and resistance levels
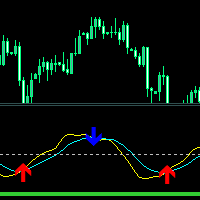
Crossing Line Indicator - An indicator designed for early detection of impulse movements in the direction of the trend.
Contains an oscillator built on the RVI indicator using smoothing and behavior modification. Two thin lines at the intersection of which a moment of price change occurs, the consequence of which may be an impulse or intensive movement.
The indicator for determining the trend direction is built on weighted MA indicators. A thick light green line, if it is below the central leve
FREE
Heatmap Indicator for Advanced Volume Analysis This indicator provides a visual representation of market volume activity, helping users interpret volume dynamics with greater clarity. Features 1. Heatmap Visualization Volume intensity is displayed using a color scale: • Blue: Low activity • Green: Moderate activity • Orange: High activity • Red: Elevated volume 2. Customizable Interface • Adjustable color scheme based on user preferences • Optional real-time percentage display • Functional lay
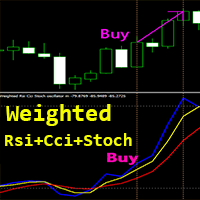
Crypto_Forex Indicator "Weighted Rsi Cci Stoch Oscillator" for MT4, No Repaint. This unique indicator combines 3 in 1: RSI, CCI and Stochastic for calculation! Precise momentum trading opportunities with this software - see examples on pictures. Indicator consist of 3 lines : Weighted Rsi Cci Stoch Oscillator itself ( Blue color ); Fast MA of oscillator ( Yellow color ); Slow MA of oscillator ( Red color ); Zone above 50 - overbought zone (Do not BUY there). Zone below -
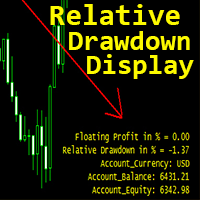
Crypto_Forex Indicator "Relative Drawdown Display" for MT4, useful trading tool. This is MUST HAVE indicator for traders who use grid trading systems!!! Relative Drawdown Display indicator shows current Relative DD or Floating Profit in % on your account. PC and Mobile Alerts are built-in with adjustable Trigger level. Indicator also indicates account Balance and Equity. It is possible to locate indicator values in any corner of the chart : 0 - for top-left corner, 1 - top-ri
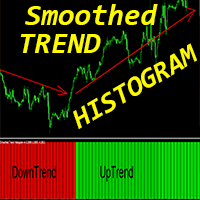
Crypto_Forex Indicator "Smoothed Trend Histogram " for MT4 , No Repaint. Smoothed Trend Histogram indicator is much more efficient than any standard Moving Averages cross. It is especially focused for big trends detection. Indicator has 2 colors: Red for bearish downtrend and Green for bullish uptrend (colors can be changed in settings). With Mobile and PC alerts. It is great idea to combine this indicator with any other trading methods: Price Action, Scalping, Momentum trading, other

Overview:
The Coloured Parabolic SAR Indicator is a visually enhanced trading tool designed to make trend-following and trade identification easier. This customizable indicator provides clear visual cues with color-coded signals for bullish (buy) and bearish (sell) trends directly on your MT4 chart. Key Features: Color-Coded Signals : Lime green "o" symbol for Buy signals. Red "o" symbol for Sell signals. Customizable Inputs : Adjustable Step and Maximum parameters to fine-tune the Parabolic SA
FREE
This is an indicator that seeks to show support and resistance zones in channels through expansion .
Abraxis Indicator Discover our innovative Abraxis Indicator , a powerful tool designed for traders seeking to refine their chart analysis and maximize their trading opportunities. This indicator was developed to operate efficiently across different timeframes, allowing you to adjust your strategies according to your needs. Key Features Calculation of Lines Based on Previous Pil

One of the key elements in trading is identifying zones or levels that allow traders to make buy or sell decisions during trading. أحد العناصر الأساسية في التداول هو تحديد المناطق أو المستويات التي تسمح للمتداولين باتخاذ قرارات الشراء أو البيع أثناء التداول. The indicator displays Fibonacci levels يعرض المؤشر مستويات فيبوناتشي drawing levels based on historical daily or weekly data. مستويات الرسم بناءً على البيانات التاريخية اليومية أو الأسبوعية. Daily levels update with each new day’s opening
When time converges with price in a critical zone, it creates a pivotal area that simplifies decision-making. This is precisely the functionality of this indicator, as it integrates time and price to highlight a robust zone you can rely on.
Key Features of the Indicator: • Dynamic Time-Price Zones: The indicator draws a time-price zone determined by the user, based on customizable settings available in the configuration. • Customizable Day Selection: A dedicated field allows you to choose th

Adjustable Volume Profile Indicator The Adjustable Volume Profile is a custom MetaTrader 4 (MT4) indicator designed to visually display the volume distribution of a financial instrument across a specific price range and time period. This indicator allows traders to analyze the volume profile based on either real volume or tick volume, helping to identify key levels of support, resistance, and market activity.
Key Features: Customizable Timeframe: The indicator can be set to any available timefr

Golden Trend Pulse — trend indicator developed specifically for Gold, also applicable to the Cryptocurrency and Stock markets. The indicator is designed for precise determination of market trends using advanced analytical methods. The tool combines multifactor analysis of price dynamics and adaptive filtering of market noise, ensuring high accuracy in identifying key entry and exit points. Thanks to its intelligent system, the indicator effectively handles market variability, minimizing false s

When geometric shapes meet with time and price, they give more confidence in the chart The indicator plots daily and weekly price triangles So that the weekly is kept until the end of the trading week While the Daily is changing with each opening The size of the triangles varies based on the previous data They will be an aid in decision-making, especially on both sides of the Triangle * Contains options to activate and disable triangles * Merge weekly and daily triangles together, each c

Dynamic Center of Gravity Indicator Revolutionary Price Action Trading System Harness the power of price momentum with the Dynamic Center of Gravity indicator - an advanced price action trading tool designed for serious traders. This innovative indicator identifies powerful gravity zones that attract rapid price movements, creating high-probability trading opportunities when momentum breaks free from these zones. Key Features Pure price action analysis - no lagging indicators Works effectively a

Evolutionize Your Trading with the UT Alert Bot Indicator for MQL4 The UT Alert Bot Indicator is your ultimate trading companion, meticulously designed to give you an edge in the fast-paced world of financial markets. Powered by the renowned UT system, this cutting-edge tool combines advanced analytics, real-time alerts, and customizable features to ensure you never miss a profitable opportunity. Whether you’re trading forex, stocks, indices, or commodities, the UT Alert Bot Indicator is your k
FREE

Good dial indicator "Pigment"
Pointer indicator "Pigment"
This product is great for binary options.
Showed itself well on M5 M15 timeframes.
Multicurrency also works well in news releases.
Does not draw and the signal appears on the current candle
Blue arrow buy
red arrow sell
You can also set the signal frequency to your liking:
In the settings, simply change the Period, the default is Period 3.
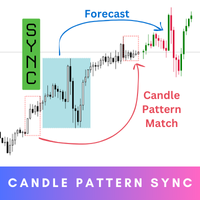
Candle Pattern Sync is your ultimate tool for precision and insight in trading. Step into the future of trading with this innovative indicator that’s designed to help you understand market behavior by analyzing historical patterns and giving you an idea of what might come next. While the forecasts provide valuable probabilities based on history, they’re not guarantees – think of them as a powerful guide to inform your decisions, not a definitive answer. MT5 Version - https://www.mql5.com/en/mar

Enter/Exit indicator Try trading on signal change BUY/SELL to Sell SELL/BUY to buy or exit by signal change. Very good for trading news. - - - - - - - - - - Please leave positive comments. - - - - - - - - - - - - - - - - - - - - - - - - - - - - - - - - - - - - - - - - - - - - - - - - - - - - - - - - - Info: CalculatedBars = Indicator Calculated Bars; AlertConfirmation = true On false Off LongBarPoints = maximum point value for signal long bar size. Buffer0[] = Arrow Up; Buffer1[] = Arrow Down;
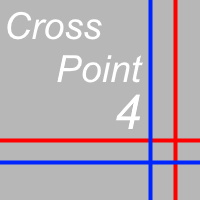
CrossPoint4 is an indicator that helps novice traders.
In addition to the standard "Crosshair" function (Ctrl + F), CrossPoint4 will show you how to set the StopLoss and TakeProfit levels correctly, taking into account the minimum allowable level, calculate the number of points between two points and convert this into the currency of the account, taking into account the expected lot of the transaction.
Sometimes, when opening a deal, a novice trader completely forgets about the spread. After

The Colored MACD indicator is a versatile and powerful tool designed to enhance your technical analysis by providing an intuitive visualization of market momentum and trend changes. Built on the foundation of the popular Moving Average Convergence Divergence (MACD) indicator, this version introduces color-coded histograms to easily distinguish between bullish and bearish momentum. Key Features: Color-Coded Visualization : The indicator features a lime-colored histogram when the MACD is above the
FREE
The MetaTrader Market is the only store where you can download a free demo trading robot for testing and optimization using historical data.
Read the application overview and reviews from other customers, download it right to your terminal and test a trading robot before you buy. Only on the MetaTrader Market you can test an application absolutely free of charge.
You are missing trading opportunities:
- Free trading apps
- Over 8,000 signals for copying
- Economic news for exploring financial markets
Registration
Log in
If you do not have an account, please register
Allow the use of cookies to log in to the MQL5.com website.
Please enable the necessary setting in your browser, otherwise you will not be able to log in.