Watch the Market tutorial videos on YouTube
How to buy а trading robot or an indicator
Run your EA on
virtual hosting
virtual hosting
Test аn indicator/trading robot before buying
Want to earn in the Market?
How to present a product for a sell-through
New Technical Indicators for MetaTrader 4 - 9
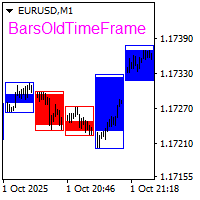
The BarsOldTimeFrame indicator is designed to analyze bar formation on a higher timeframe, projecting bars from it onto the current timeframe.
The indicator draws higher timeframe bars on the current chart as rectangles with filled candlestick bodies and transparent shadows. The higher timeframe and fill colors for bullish and bearish bar bodies are selected in the settings.

Rainbow Price Visualizer v1.21 See where the market really breathes.
Turns your MT4 chart into an ultra-precise heatmap that highlights price zones favored by big players. Why it matters 300 price levels at 0.2‑pip resolution — microscopic detail. 8 visual themes (Rainbow, Fire, Ocean…) for instant readibility. Smart opacity: low noise fades, real zones pop. Lightweight rendering with automatic cleanup. Fully customizable: saturation, opacity, resolution, history depth. Bands project into the f
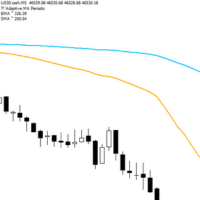
Adaptive Flow MAs is a moving average indicator designed to naturally adjust to market movements. Unlike traditional averages, it dynamically adapts its periods based on recent volatility and the current trend. The EMA closely follows rapid price swings to capture every impulse, while the SMA remains smoother, providing a stable and reliable reference. With a clean display showing the current adaptive periods, this tool helps traders feel the “flow” of the market without visual clutter. It’s cr
FREE
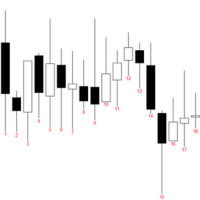
indicator that numbers the bars (candles) in a custom trading session.
The indicator allows: Defining the session start time (StartHour and StartMinute) Displaying numbers only on odd bars (if AfficherUniquementImpairs is true) Displaying numbers on the last N days (NbJours) Customizing the color and font size of the text The indicator will loop through the bars of the last N days and, for each day, start counting from the session start time.
It will display the bar number (starting at 1) belo
FREE
The Four Pillars: Your All-in-One Trading Powerhouse! Tired of juggling multiple indicators and missing out on perfect entries? The Four Pillars is the ultimate solution, merging four proven market analysis tools into one powerful, easy-to-use indicator. Get crystal-clear, high-conviction Buy and Sell signals directly on your chart, filtered for maximum accuracy. Stop guessing and start trading with confidence! Key Advantages & Features Precision Signals, Zero Clutter: This indicator combine
FREE
SignalFusion 5 Total market view in one chart. Monitor multiple pairs in real time, convert data into clear decisions, and spot opportunities for scalping, day trading, and swing. Works with majors like EUR/USD and GBP/USD and also exotics. Adds immediate value to any trader’s toolkit. 5 integrated indicators. Combines five signals into a single optimized list and runs by default with 9 pairs . Switching symbols is direct from parameters. After purchase, download for MT4/MT5 and use instan
FREE
Understood! I will reformat the marketing description without the tables, keeping the persuasive tone and clearly listing the parameters and benefits. Precision Entry Arrows: Never Miss a High-Probability Trade Again! Stop guessing and start trading with confidence. The Precision Entry Arrows indicator is a sophisticated, all-in-one tool designed to deliver high-quality, non-repainting Buy and Sell signals directly on your chart. It expertly combines the power of MACD , Stochastic , and a un
FREE

This indicator displays the current SWAP values (for both buy and sell positions) of individual trading instruments directly in the chart.
It allows traders to quickly identify which symbols have positive or negative swaps, helping them make better decisions when choosing positions that may be more advantageous for long-term holding. ️ Indicator Settings Selection of Displayed Symbols The user can choose which instruments are displayed in the table:
• only currency pairs,
• all symbols from the
FREE

Step into the world of Forex trading with confidence, clarity, and precision using Gold Indicator a next-generation tool engineered to take your trading performance to the next level. Whether you’re a seasoned professional or just beginning your journey in the currency markets, Gold Indicator equips you with powerful insights and help you trade smarter, not harder. Built on the proven synergy of three advanced indicators, Gold Indicator focuses exclusively on medium and long-term trends eli

H4 - Scalping
- This indicator has a high earning potential and is created for the H4 timeframe, but can also be used on higher timeframes.
- The indicator does not repaint and works on all currency pairs.
- With the help of moving averages or other preferred indicators, losses can be minimized.
- Trading signals are displayed by white and yellow arrows.
- I have noticed that exits of 30 pips with Stop Loss of 30 pips give good results. Or exits at crossings of moving averages 5 and 36 LWM

Stop chasing the market. The Follow Line Indicator provides clear, high-probability signals right on your chart. This advanced tool features a Dynamic Trend Line that instantly adapts to market structure. It’s your immediate visual reference: Blue means you're in an uptrend, and Red signals a downtrend. The core function tracks price extremes and volatility to define the true trend strength. The best part is the automatic signal generation: Buy Arrow: Appears when the trend line flips from Re

EMA indicator based on BTMM In BTMM, common EMA colors include Yellow for EMA 5, Red for EMA 13, Light Blue/Aqua for EMA 50, White for EMA 200, and Dark Blue for EMA 800. These color-coded EMAs represent different market timeframes and are used to identify trends, potential reversal points, and areas of support and resistance. consist of
Yellow (Mustard): EMA 5 Red (Ketchup): EMA 13 Light Blue (Water): EMA 50 White (Mayonnaise): EMA 200 Dark Blue (Blueberry): EMA 800 White
FREE
Trade Signals & Session Bias in one tool. Detects Asia, London & NY session trends, shows bias strength, alerts bias flips, and plots entry/SL/TP levels with R:R. Simple dashboard for quick decisions. Simple but powerful trading assistant. This indicator automatically detects the market bias during the Asia, London, and New York sessions .
It helps traders stay on the right side of the trend, avoid neutral zones, and catch bias flips with alerts. Bias Detection – Shows session bias as
Advanced Currency Strength Indicator Comprehensive Market Analysis in One Tool User-Friendly and Versatile for All Traders This indicator simplifies market analysis by evaluating the strength of 28 forex currency pairs, along with Gold, Silver, and other selected instruments. By using a Triangular Moving Average (TMA) and ATR-based bands, it provides a structured view of market movements, assisting traders in making informed decisions.
Identify Market Trends Efficiently The indicator helps ass
Trend Pro: Market Trend Analysis Tool Key Features Smart Signal Analysis Provides structured BUY/SELL signal insights Helps detect potential trend reversals Assists in exit point identification Offers real-time market condition tracking Advanced Visual Analytics Color-coded trend strength representation Dynamic trend momentum evaluation Market volatility tracking system Noise reduction filtering for clarity Performance Benefits Designed for efficient signal processing Developed to improve signa
Smart Regression Bands – Precision Trend & Touch Detection System Trade with confidence using the Smart Regression Bands Indicator — a non-repainting regression-based system built for traders who want clarity, precision, and accuracy in their setups. Whether you’re a beginner , scalper , or professional swing trader , this tool fits perfectly into any intraday , swing , or smart money (SMC) strategy. What It Does The indicator intelligently detects every candle that touches the upper or lower

Overview Market Structure Analysis Indicator MT4 Structure Analysis Indicator automatically identifies Market Structure based on Smart Money Concepts (SMC). It clearly displays Break of Structure (BoS), Change of Character (CHoCH), Higher Highs, Higher Lows, Lower Highs, and Lower Lows in real-time. Key Features Automatic Market Structure Detection Break of Structure (BoS) - Price breaks previous structure in trend direction Change of Character (CHoCH) - Trend reversal sig

Igniter Indicator for gold turns market push into a clear green/red histogram. When momentum strengthens, it prints green; when it fades, it prints red. Signals are based on closed candles, so what you see is what you can act on—no guesswork and no tinkering with hidden recipe settings. It’s built for manual traders who want a steady, reliable read without learning a new language.
Using it is straightforward: wait for a color flip and enter in that direction. Flips that carry through the zero
MTF Chart PRO: Multi-Timeframe Analysis with Patterns, S/R, and Alerts Overview MTF Chart PRO is an advanced MetaTrader 4 indicator that overlays customizable candles from multiple timeframes directly on your current chart, enabling seamless multi-timeframe (MTF) analysis without switching windows. Ideal for forex, stocks, and crypto traders, it combines visual candle display with built-in support/resistance (S/R) lines, automated SL/TP levels, candle pattern detection, and configurable alerts—e

Trend Reversal Catcher with Alert MT4 Trend Reversal Catcher with Alert MT5 is a non-repainting, non-redrawing, and non-lagging price action indicator designed to identify precise market turning points.
It combines pivot detection , candlestick patterns (pin bars and engulfing setups), and an ATR-based volatility filter to deliver clean and reliable reversal signals. MT5 version https://www.mql5.com/en/market/product/150541?source=Site +Market+My+Products+Page The indicator p
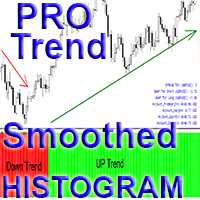
Crypto_Forex Indicator "Pro Smoothed Trend Histogram" for MT4, No Repaint.
- Pro Smoothed Trend Histogram indicator is much more efficient than any standard Moving Averages cross. - It is especially focused for big trends detection. - Indicator has 2 colors: Red for bearish downtrend and Green for bullish uptrend (colors can be changed in settings). - With Mobile and PC alerts. - It is great idea to combine this indicator with any other trading methods: Price Action, Scalping, Momentum trading
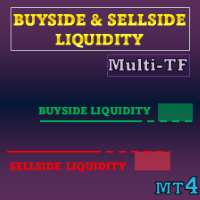
Special offer : ALL TOOLS , just $35 each! New tools will be $30 for the first week or the first 3 purchases ! Trading Tools Channel on MQL5 : Join my MQL5 channel to update the latest news from me This indicator visualizes liquidity levels and liquidity zones based on ICT concepts, plus Liquidity Voids to highlight one-direction price displacements. It focuses on where stop or pending orders tend to cluster and how those areas evolve once price trades through them.
Se
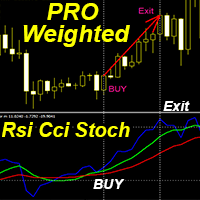
Crypto_Forex Indicator "Pro Weighted Rsi Cci Stoch Oscillator" for MT4, No Repaint.
- This unique indicator combines 3 in 1: RSI, CCI and Stochastic for calculation! - Precise momentum trading opportunities with this software - see examples on pictures. - Indicator consist of 3 lines : - Pro Weighted Rsi Cci Stoch Oscillator itself (Blue color); - Fast MA of oscillator (Green color); - Slow MA of oscillator (Red color); - Zone above 50 - overbought zone (Do not BUY there). - Zone below -50

TrendCatcher FVG is an indicator for traders who follow Smart Money Concepts (SMC).
It detects Fair Value Gaps (FVG, ICT three-candle pattern), plots the gap box and the Central Line (CE, 50%), and displays reference levels (Entry, Stop Loss, Take Profit 1 and Take Profit 2) directly on the chart. The tool is designed as a visual aid and does not place or manage orders. How It Works The indicator scans each bar and identifies bullish or bearish Fair Value Gaps using either wicks or bodies, depe
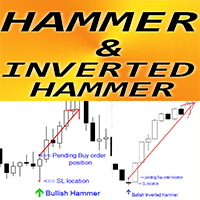
Crypto_Forex Indicator "Hammer and Inverted Hammer pattern" for MT4, No repaint, No delay.
- Indicator "Hammer and Inverted Hammer pattern" is very powerful indicator for Price Action trading. - Indicator detects bullish Hammer and Inverted Hammer patterns on chart: - Bullish Inverted Hammer - Blue arrow signal on chart (see pictures). - Bullish Hammer - Green arrow signal on chart (see pictures). - With PC, Mobile & Email alerts. - Indicator "Hammer and Inverted Hammer pattern" is excellent t
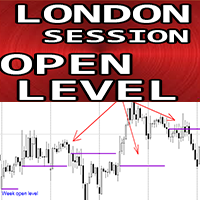
Crypto_Forex Indicator "London Session Open Level" for MT4.
- Indicator "London Session Open Level" is very useful auxiliary indicator for intraday trading. - Session open price level is so important because very often price returns back to that area during the day. - Indicator shows you London session open price level daily for each day. - Also indicator shows week open level on Mondays. - It is useful for intraday traders to set up targets or use as support/resistance area.
// Great Trading
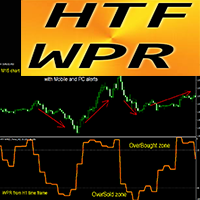
Powerful Crypto_Forex Indicator HTF WPR Oscillator for MT4.
- Upgrade your trading methods with the professional HTF WPR Oscillator for MT4. HTF means - Higher Time Frame. - WPR is one of the top oscillators for scalping. - This indicator is excellent for Multi-Time Frame trading systems with Price Action entries from OverSold/Bought areas. - HTF WPR Indicator allows you to attach WPR from Higher time frame to your current chart --> this is professional trading approach. - Indicator has bui
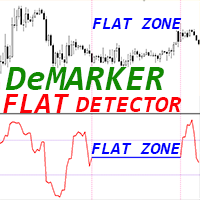
Crypto_Forex Indicator "DeMarker FLAT Detector" - is an efficient auxiliary tool in trading! No Repaint. I offer you to upgrade your trading methods with this great indicator for MT4.
- Indicator shows price Flat areas on the chart. It has "Flat sensitivity" parameter - which is responsible for flat detection. - "DeMarker FLAT Detector" can be used for Price Action entries confirmation or in combination with other indicators. - You can use it for trend following systems to detect flat zones an
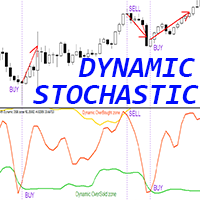
Crypto_Forex Indicator "Stochastic with Dynamic OverSold/OverBought zones" for MT4, No Repaint.
- Stochastic oscillator is one of the most famous indicators on the market - perfect trading tool for many traders. - It is great for Sell entries from dynamic OverBought zone and Buy entries from dynamic OverSold zone. - This indicator is excellent to combine with Price Action entries as well. - Dynamic OverBought zone - above yellow line. - Dynamic OverSold zone - below green line. - With PC and M
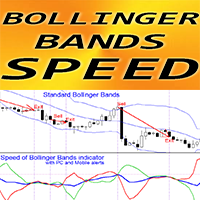
Crypto_Forex Indicator "Bollinger Bands Speed" for MT4, No Repaint. Speed of Bollinger Bands - is a unique trend indicator.
- The calculation of this indicator is based on equations from physics. - Speed is the 1st derivative of standard Bollinger Bands. - Bollinger Bands speed indicator shows how fast BB middle line and BB borders change their directions. - By default: Blue line is the speed of BB middle line, Red line - speed of bottom border, Green one - speed of top border. - It is recom
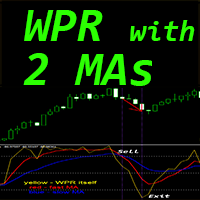
Crypto_Forex Indicator "WPR and 2 Moving Averages" for MT4, No Repaint.
- WPR itself is one of the best oscillators for scalping. - "WPR and 2 Moving Averages" Indicator allows you to see Fast and Slow Moving Averages of WPR oscillator. - Indicator gives opportunities to see the price corrections very early. - It is very easy to set up this indicator via parameters, it can be used on any time-frame. - You can see Buy and Sell entry conditions on the pictures. - Consider Buy signal conditions:
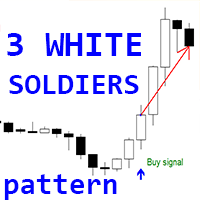
Crypto_Forex Indicator "3 White Soldiers pattern" for MT4, No repaint, No delay.
- Indicator "3 White Soldiers pattern" is very powerful for Price Action trading. - Indicator detects bullish "3 White Soldiers" patterns: Blue arrow signal on chart (see pictures). - With PC, Mobile & Email alerts. - Also its brother - bearish "3 Black Crows pattern" indicator is available (follow the link below). - Indicator "3 White Soldiers pattern" is excellent to combine with Support/Resistance Levels.
// G
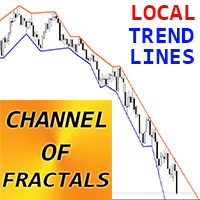
Crypto_Forex Indicator "CHANNEL of FRACTALS" for MT4.
- This indicator is showing actual local Trend lines based on Highs/Lows of Fractals. - Great for traders who use Graphical Analysis. - Resistance local trend lines - Red color. - Support local trend lines - Blue color. - It has few parameters responsible for number of fractals, trend line colors and width. - Indicator is great to detect current market condition: - Bullish market condition - when both lines are going up. - Bearish market co
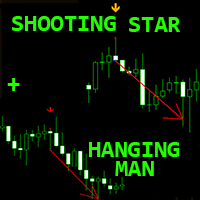
Crypto_Forex Indicator "Hanging_Man and Shooting_Star patterns" for MT4, No repaint, No delay.
- Indicator "Hanging_Man and Shooting_Star patterns" is very powerful tool for Price Action trading. - Indicator detects bearish Hanging_Man and Shooting_Star patterns on chart: - Bearish Hanging_Man - Red arrow signal on chart (see pictures). - Bearish Shooting_Star - Orange arrow signal on chart (see pictures). - With PC, Mobile & Email alerts. - Indicator "Hanging_Man and Shooting_Star" is excelle
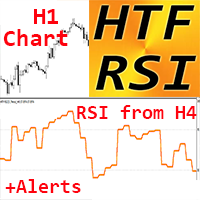
Crypto_Forex Indicator HTF RSI Oscillator for MT4.
- RSI itself is one of the best and most popular oscillators. HTF means - higher time frame. - Overbought zone is when the RSI is above 70 and Oversold one - when it is below 30. - RSI provides information regarding bullish and bearish price momentum. - This indicator is excellent for Multi-Time Frame trading systems with Price Action entries or in combination with other indicators. - HTF RSI Indicator allows you to attach RSI from Higher time
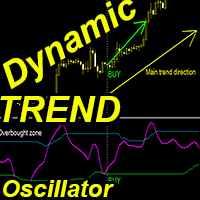
"Dynamic Trend Oscillator" - is an advanced custom Crypto_Forex indicator - efficient Trading tool for MT4!
- New generation of Oscillators - see pictures to check how to use it. - Dynamic Trend Oscillator has adaptive Oversold/Overbought zones. - This oscillator is an auxiliary tool to find exact entry points from dynamic OverSold/OverBought areas into the direction of main trend. - Oversold values: below Green line, Overbought values: above Blue line. - Use Dynamic Trend Oscillator in combi
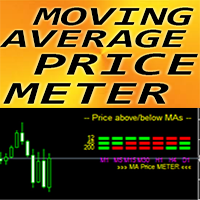
Crypto_Forex Indicator "Moving_Average_Price_METER" for MT4.
- Upgrade your trading methods with this useful indicator - "MA_Price_METER". - Great for "3 screens" Multi TimeFrame trading method. - This indicator is comparing current Price value with corresponding Moving Averages on 7 different timeframes. - Green rectangle - price is above corresponding MA. - Red rectangle - price is below corresponding MA.
// Great Trading Robots and Indicators are available here: https://www.mql5.com/en/use

Fusion Cross is a modern arrow indicator for MetaTrader 4 that combines the power of several proven tools:
WPR (Williams Percent Range)
RSI (Relative Strength Index)
Their combination generates highly accurate market entry signals, rejecting false signals and displaying only those points where the probability of a reversal or continuation of the movement is truly high.
Key Features:
Clear buy and sell arrow signals directly on the chart.
Instant notifications:
sound alert,
emai
Download the free USDJPY version here.
MACD Indicator The Moving Average Convergence and Divergence (MACD) is a trend following momentum indicator which shows the relationship between two moving averages that we chose and configure them on the indicator. The MACD is calculated by subtracting the 26-period exponential moving average and the 12 period D.A.M. These are the default parameters when you put the MACD indicator on the charts, and the period is usually 9 which means the last 9 candles
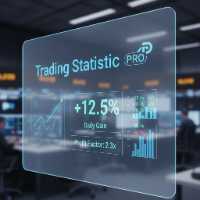
The statistical indicator for the metatrader 5 TradingStatisticPro collects statistical data on your trade, which makes it easier to assess the effectiveness of trading, the profit received and the risks. The indicator is compactly placed in the corner of the main chart of the terminal and displays the following information: 1. The profit earned. 2. Maximum drawdown. 3. The recovery factor. 4. Profit factor. 5. The ratio of profitable and unprofitable transactions (winrate). 6. Average profit a
FREE

TUMA MT4 Light Indicator A simple and convenient indicator for tracking the crossing of two moving averages (EMA).
A lightweight interface right on the chart allows you to quickly change the periods of both MAs without opening the settings window. Main Features: Display of two EMAs on the chart. Easy parameter editing directly on the chart. Signal arrows when MAs cross: BUY (green arrow up) SELL (red arrow down) Information block with the latest signal and parameters. ️ Input Paramet
FREE
Signal King: Your Supreme Trend Indicator Ever felt lost in the noise of the market? The "Signal King" indicator cuts through the chaos, delivering clear, high-probability buy and sell signals directly to your chart. This isn't just another trend indicator; it's a powerful tool designed to give you an edge by combining the robust Supertrend with a reliable EMA filter . The Supertrend excels at identifying the overall market direction, while the EMA acts as a powerful confirmation filter. This du
FREE
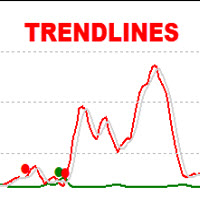
The Trendlines Oscillator helps traders identify trends and momentum based on the normalized distances between the current price and the most recently detected bullish and bearish trend lines.
The indicator features bullish and bearish momentum, a signal line with crossings, and multiple smoothing options. USAGE The Trendlines Oscillator works by systematically: Identifying pivot highs and lows. Connecting pivots to form bullish (support) and bearish (resistance) trendlines. Measuring
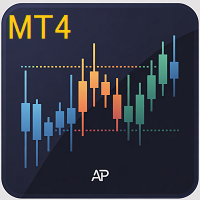
AP Day-Week-Month High-Low MT4
Lightweight overlay that draws the prior Day, Week, and Month highs/lows on any chart. Great for session planning, confluence, and alerting when price comes back to important swing levels.
What it does Plots 6 lines: Day High/Low, Week High/Low, Month High/Low (from the previous completed sessions).
Touch/near alerts when price reaches a selected line (with a user-set tolerance).
Works on any symbol and timeframe. Zero external libraries.
How to use Drop it o
FREE
AP VWAP Bands Pro (MT4) Volume-weighted average price with ±σ bands for clear intraday bias, mean-reversion zones, and dynamic support/resistance. Works on crypto (incl. BTC), FX, indices, and metals. Uses tick-volume when real volume isn’t available.
What it shows VWAP line (volume-weighted mean price).
Two envelopes around VWAP (default ±1σ and ±2σ) to highlight balance vs. extension.
Reset modes: Day, Week, or Anchor Time (HH:MM) to start VWAP where you need it (e.g., exchange open).
Why
FREE

Unleash Your Trading Potential with the Golden Fractal Cross Are you tired of second-guessing your trades? Do you wish you had a clear, reliable system to guide your decisions? Introducing the Golden Fractal Cross —a powerful and user-friendly indicator designed to help you spot high-probability trading opportunities. This isn't just another average indicator; it's a complete strategy that combines the precision of fractal patterns with the dynamic power of Exponential Moving Averages (EMAs). Th
FREE
Unlock Smarter Trades with Candle Sync Pro! Are you tired of conflicting signals across different timeframes? Do you wish you had a clearer view of the market's true direction? "Candle Sync Pro" is your essential tool for making more confident and informed trading decisions! This powerful indicator cuts through the noise, allowing you to see the bigger picture by visualizing higher timeframe candles directly on your current chart. No more switching back and forth, no more guesswork – just pure,
FREE

Discover Your Edge with Golden Trend Finder Are you tired of second-guessing your trades? Golden Trend Finder is the all-in-one indicator designed to give you a decisive advantage in the market. It's not just another tool; it's a powerful signal generator that combines multiple advanced indicators to provide you with clear, confirmed trading opportunities. Imagine having a smart system that tells you exactly when to enter and exit a trade, filtered to avoid false signals. Golden Trend Finder doe
FREE

Discover Your Edge with Trend Hunter Ultimate Are you tired of second-guessing your trades? Trend Hunter Ultimate is the powerful MT4 indicator designed to cut through the market noise and give you clear, precise trading signals. Built on a proven strategy that combines multiple moving averages and the Stochastic oscillator, this tool is your key to identifying high-probability trend and reversal opportunities. Key Features & Benefits Pinpoint Accuracy: Our unique filtering system uses two EMAs
FREE
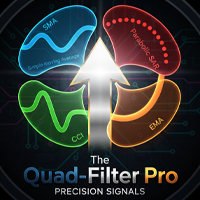
The Quad-Filter Pro: Unlock Precision Trading & Filter Out the Noise Tired of complex charts and missing out on profitable opportunities? In today's volatile markets, relying on a single indicator is risky. You need rock-solid confirmation to separate high-probability trades from market noise. Introducing The Quad-Filter Pro —your ultimate MetaTrader 4 indicator engineered for unparalleled trade precision. It’s like having an expert analyst constantly screening the market, giving you a crystal-
FREE
Ultimate Signal Generator: Your Edge in the Market Are you tired of guessing your next move in the market? The Ultimate Signal Generator is here to change that. This powerful MQL4 indicator is designed to give you a clear trading advantage by providing reliable buy and sell signals. It's a smart, effective tool that helps you make confident decisions, so you can focus on your strategy, not on uncertainty. Key Advantages and Features Pinpoint Accuracy: Our indicator uses a unique blend of Bollin
FREE

TR CPR Full Lines Pivot — Full Pivot Range Indicator
A professional indicator that automatically plots CPR (Central Pivot Range) levels on Daily (D1) or H4 timeframe , with clean lines and structured targets ( TP1 – TP3 ) for both upside and downside. It helps you identify clear BUY / SELL zones , with smart alerts when price touches or breaks key levels.
Features: Automatic CPR calculation from previous Daily or H4 candle. Clean lines for BUY / SELL / PP (Pivot) . TP1 – TP3 targets displayed
FREE
Chart Pattern Strategies Signals Indicator Version: 1.02
Overview The Chart Pattern Strategies Signals Indicator is a comprehensive dashboard for MetaTrader 4 designed to give traders a powerful, at-a-glance view of potential chart pattern setups across multiple markets. It monitors a customizable list of instruments in real-time, displaying clear, actionable information directly on your chart. This tool is built to assist manual traders by identifying and organizing high-probability trading si

Catch The Turn: The 5-Factor Confluence Trading System Tired of conflicting indicators and missed entries? is your complete decision engine, designed to cut through market noise and deliver high-confidence entry signals exactly when a major market move begins. The Power of 5-in-1 Confluence Stop trading on doubt. Our proprietary engine eliminates false signals by generating a trade signal only when five independent, proven indicators are in full, unequivocal agreement. This rigorous confirma
FREE
Range-Bound & Reversal Strategies Dashboard (MT4) Trade clean reversals with confidence.
This MT4 indicator scans 20 major instruments in real time and pinpoints high-probability range and mean-reversion opportunities—then lays everything out in a simple, professional dashboard. Why traders love it 10 Proven Setups in One Tool
Support/Resistance bounce, Bollinger mean reversion, RSI OB/OS, MACD turn, Stochastic OB/OS, CCI extremes, Daily Pivot S/R, Keltner touch, Donchian extremes, and Envelop

Ready to elevate your trading with clear, high-confidence signals? Unlock the Power of Triple-Confirmation Trading! Stop chasing weak signals and start trading with conviction. The Triple Power Indicator is your ultimate tool for identifying high-probability trend moves. We've combined three of the most powerful and reliable technical indicators—Parabolic SAR, MACD, and Exponential Moving Average—into one dynamic system, giving you an unmatched edge in the market. Why You Need This Indicator: U
FREE
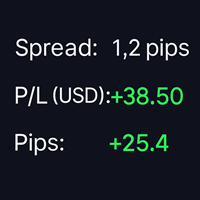
SpreadPipsProfit – Real-Time Spread, P/L & Pip Tracker SpreadPipsProfit is a lightweight, non-intrusive MT4 indicator that displays your key trading metrics in real time — directly on your chart. It’s designed for traders who value clarity, precision, and clean visuals. Key Features Right-Aligned Display Panel – Perfectly positioned in the top-right corner with adaptive spacing and safe edge margins. Live Spread Monitor – Shows the current spread in pips , helping you avoid overpaying on e
FREE
Stop Guessing, Start Trading: Introducing the Premium MA Signal Indicator! Are you tired of confusing charts and mixed signals that cost you money? The Premium MA Signal Indicator is your solution. It’s engineered to cut through the market noise and deliver clear, confident trading signals directly onto your chart. This isn't just a basic Moving Average; it's a complete, professional trend analysis system designed to help you spot high-probability trades effortlessly. This is your chance to trad
FREE

Ultimate Trend-Following Scanner Are you tired of manually flipping through dozens of charts, desperately searching for the next big trend? Do you feel like you're constantly missing the best entries or jumping into choppy, sideways markets? The hunt for strong, reliable trends is over. Introducing the Ultimate Trend-Following Scanner – your all-in-one command center for dominating the markets. This powerful dashboard for MT4 is meticulously designed to do one thing exceptionally well: find the

Unlock your trading potential with Momentum Master , the smart indicator designed to help you navigate the markets with confidence. This powerful tool provides clear, actionable signals by combining the strengths of multiple proven indicators. Say goodbye to guesswork and hello to precision trading. Momentum Master is more than just a signal provider; it's your personal market analyst. It uses a unique combination of Moving Averages (EMA 34 & 55) to identify the trend, MACD for trade confirmatio
FREE
The Ultimate Trading Companion: Beyond the Bands Tired of missing out on key market moves? Our indicator, Beyond the Bands , is the solution you've been waiting for. This powerful tool takes the classic Bollinger Bands strategy and supercharges it with an intelligent EMA filter, giving you more accurate and reliable signals than ever before. It's designed to help you find high-probability entry points and avoid false signals, so you can trade with confidence. What makes Beyond the Bands differen
FREE
Elevate Your Trading with WilliamsTrend Pro Ready to take your trading to the next level? WilliamsTrend Pro is the ultimate tool designed to help you spot high-probability trade setups with precision and confidence. By combining the power of the Williams %R oscillator with a 200-period EMA trend filter , this indicator helps you trade smarter, not harder. Stop second-guessing your entries and exits. WilliamsTrend Pro filters out the noise, ensuring you only get signals that are aligned with the
FREE

Candle Time At Price — Precision Countdown Directly Beside the Candle Candle Time At Price is a lightweight, smart, and visually elegant indicator that displays the remaining time of the current candle right next to price — exactly where your eyes are focused. It’s designed for traders who value clean charting, precision, and zero distractions. Key Features: Real-Time Countdown — Displays the exact time left before the current candle closes. Price-Anchored Display — The timer moves wi
FREE

Precision Pulse: High-Conviction Trend-Following Indicator Product Overview Precision Pulse is an advanced, multi-factor trend-following indicator engineered to deliver high-probability trade signals by rigorously aligning the long-term trend, short-term momentum, and overbought/oversold conditions. It minimizes market noise and whipsaws by requiring all foundational components to converge before generating an entry signal. Signal Mechanics: The Core of Precision Precision Pulse ensures trad
FREE
Momentum Matrix Pro – Multi-Strategy Signal Dashboard Momentum Matrix Pro is a powerful multi-symbol, multi-strategy dashboard indicator that brings together 10 proven momentum trading strategies into one professional tool.
Scan 20 major Forex pairs + Gold (XAU/USD) in real time and get high-accuracy BUY/SELL signals , complete with Win% backtesting, Entry, Stop Loss, and Take Profit levels – all on one clean, easy-to-use dashboard. If you trade momentum, this is your all-in-one solution . K

EMA Volume Confluence Indicator - Overview What It Does: This is a multi-timeframe momentum indicator that combines trend following, volume analysis, and volatility bands to identify high-probability trade setups. Core Components: EMA 7 (Blue) - Fast trend line EMA 21 (Orange) - Slow trend line VWAP (Purple) - Volume-weighted average price (institutional level) ATR Bands (Red/Green) - Volatility channel around EMA 21 Info Panel - Real-time metrics (RSI, volume ratio, trend, positions) Signal Log
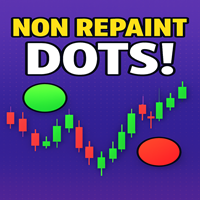
The indicator is designed to highlight potential buy and sell opportunities on the chart using green and red dots . A green dot suggests that price has broken upward past a calculated threshold, signaling a possible bullish move. A red dot suggests that price has broken downward past a calculated threshold, signaling a possible bearish move. It adapts to market conditions by factoring in both trend movement and volatility , so the signals adjust when markets are more or less active. Because it o
Price Action Strategies Dashboard – Multi-Pair Signal Scanner (Buy/Sell with Entry, SL & TP) The Price Action Strategies Dashboard is a complete multi-pair scanner that detects 10 powerful candlestick strategies and instantly tells you whether to Buy or Sell , along with the Entry, Stop Loss, and Take Profit levels. Instead of guessing, you get precise rules so you can trade price action with confidence. Trading Conditions The dashboard evaluates 10 price action setups and converts them into B
Advanced Supply & Demand Zone Dashboard The Ultimate Multi-Symbol, Multi-Strategy Scanner for Price Action Traders Description Tired of endlessly flipping through dozens of charts, manually searching for high-probability Supply and Demand zones? Do you spend hours trying to confirm setups with multiple indicators, only to miss the entry? The Advanced Supply & Demand Zone Dashboard is your all-in-one solution. This powerful indicator for MetaTrader 4 scans 20 different instruments across 4 key ti
H4 Supersignal
Welcome to my page.
- The H4 Supersignal indicator is created for the H4 timeframe.
- The indicator does not repaint.
- It can be tried on other timeframes.
- It works on all currency pairs.
- Bollinger Bands (60, 2) or moving averages (60 Smoothed) can be attached to the chart as a visual aid.
- Trading signals are displayed by white and yellow arrows in accordance with the blue and red trend lines.
Good luck!
The MetaTrader Market is a unique store of trading robots and technical indicators.
Read the MQL5.community User Memo to learn more about the unique services that we offer to traders: copying trading signals, custom applications developed by freelancers, automatic payments via the Payment System and the MQL5 Cloud Network.
You are missing trading opportunities:
- Free trading apps
- Over 8,000 signals for copying
- Economic news for exploring financial markets
Registration
Log in
If you do not have an account, please register
Allow the use of cookies to log in to the MQL5.com website.
Please enable the necessary setting in your browser, otherwise you will not be able to log in.