Watch the Market tutorial videos on YouTube
How to buy а trading robot or an indicator
Run your EA on
virtual hosting
virtual hosting
Test аn indicator/trading robot before buying
Want to earn in the Market?
How to present a product for a sell-through
New Technical Indicators for MetaTrader 4 - 19
Breakout Box Sentinel Signal
System Logic
Breakout Box Sentinel Signal is not a simple overlay. It is a structural tool that detects directional commitment through breakout zones generated by price compression. Unlike traditional indicators that smooth or generate visual noise, this system identifies volatility-driven behavior within a clean, session-aware framework.
Stay Updated
Join the official channel to stay informed about future releases and updates: https://www.mql5.com/en/channels

Binary Chronos – Indicator for Binary Options on MT4 Buffered signals : Arrow signals simplify entries and allow automated EAs. ️ Expiration : Default — 1 candle. Trend-based logic : Detects trend direction, finds optimal entry, and gives a signal. Entry on current candle : Signal is for immediate entry. ️ Martingale : If the first trade fails, apply one martingale step on the next bar , no more. LevelEn : The higher the value, the better the quality and accuracy of the signals.

TradeZones Fibonacci Pro – Dynamic Fibonacci Zones & Smart Trading Alerts Automatically detect key reversal zones using Fibonacci. Sharpen your entry points with precision. TradeZones Fibonacci Pro is a professional indicator that automatically plots the most relevant Fibonacci levels on your chart, identifying potential buy and sell zones based on a configurable period. With an intuitive interface, built-in alerts, and a handy ON/OFF button, it helps you make quick, informed decisions while
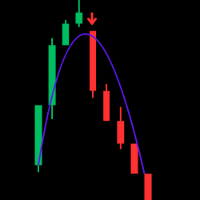
Trend WTS — Advanced Modular Trend & Signal Indicator for XAUUSD (M5 Optimized) Unlock precise trading insights with Trend WTS , a powerful and modular trend and signal indicator designed specifically for XAUUSD on the M5 timeframe. Built for traders seeking accuracy and clarity, Trend WTS combines fast moving average crossovers with a long-term EMA filter to deliver reliable buy and sell signals tailored for the gold market. Key Features: Dual Moving Average Trend Detection: Detect strong trend
FREE

Volume Footprint Analysis is a precision-engineered, volume-based indicator that transforms raw market volume into an intuitive, color-coded signal system. Built on concepts from Volume Spread Analysis (VSA) and Smart Money principles, this tool removes the guesswork from volume interpretation and gives traders clear, actionable insights on when to buy or sell — on any timeframe and across any trading instrument. MT5 Version - https://www.mql5.com/en/market/product/138565/ Join To Learn Mark

Unlock the power of Smart Money trading with the Fear Detector – a modular, trend + signal indicator built for XAUUSD on M15 . This cutting-edge tool combines Break of Structure (BoS) , Order Blocks , Fair Value Gaps (FVG) , and custom trend logic to detect high-probability trade opportunities. Features: Smart Money Concepts (BoS, OB, FVG) Buy/Sell signals with cooldown filters Multi-timeframe MA trend confirmation Signal alerts + email notifications Custom GUI-ready & optimized for gold scalp
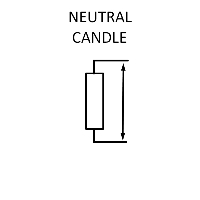
Neytral sham - Bu kunlik savdo uchun mo`ljallangan bo`lib, Neytral sham asosida daraja yaratilib ushbu darajani qaysi tarafga buzib o`tishiga qarab bozorga kirish metodlari qo`llaniladi - Taymfreym M15, H1, H4 - Valyuta paralarida qo`llash yaxshi natija beradi - Grafikda CTRL+Y vertikal darajalar yoqiladi Muhim: Savdo qilishdan oldin bektest qilishni unutmang! -
This is a powerful, session-aware breakout indicator designed for serious traders who thrive on volatility and structure. Engineered for precision, it identifies high-probability breakout zones during the London and New York trading sessions—where the market moves with intent. Key Features: Session Range Detection
Automatically detects and highlights the key price range of London and New York sessions. Breakout Confirmation
Identifies breakout candles after the session range, with cl
FREE

This indicator help to mark the high and low of the session Asian,London,Newyork , with custom hour setting
This indicator is set to count from minute candle so it will move with the current market and stop at the designated hour and create a accurate line for the day.
below is the customization that you can adjust :
Input Descriptions EnableAsian Enables or disables the display of Asian session high and low levels.
EnableLondon Enables or disables the display of London session high and
FREE

Support and Resistance is the most basic science known to traders.
However, many people don't expect that the indicators used by big traders do not use indicators that have complex and complicated data, but rather return to using the most basic, namely Support and Resistance.
Here is the Support and Resistance Indicator that I made as simple as possible. Here you can determine the limits of strong Support and Resistance based on several provisions that you need.
In this indicator, you can fi

The Auto Fibonacci Indicator is a professional technical analysis tool that automatically draws Fibonacci retracement levels based on the most recent closed Daily (D1) or 4-Hour (H4) candle. These levels are widely used by traders to identify key support , resistance , and trend reversal zones .
This version is designed for manual trading and supports a powerful trading strategy using Fibonacci levels combined with a 50-period EMA (Exponential Moving Average) , which you can easily add from MT4
FREE
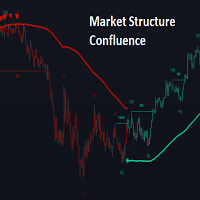
OVERVIEW
This script is called "Market Structure Confluence" and it combines classic market structure analysis with a dynamic volatility-based band system to detect shifts in trend and momentum more reliably. It tracks key swing points (higher highs, higher lows, lower highs, lower lows) to define the trend, then overlays a basis and ATR-smoothed volatility bands to catch rejection signals and highlight potential inflection points in the market.
CONCEPTS
Market structure is the foundation
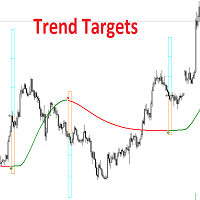
OVERVIEW
This script combines a smoothed trend-following model with dynamic price rejection logic and ATR-based target projection to give traders a complete visual framework for trading trend continuations. It overlays on price and automatically detects potential trend shifts, confirms rejections near dynamic support/resistance, and displays calculated stop-loss and take-profit levels to support structured risk-reward management. Unlike traditional indicators that only show trend direction or s

Phantom Bands – MT4 Indicator Zone-Based Reaction Levels for Price Action Traders Phantom Bands is a MetaTrader 4 custom indicator that draws multiple adaptive bands on your chart. These levels are designed to assist traders in identifying potential price interaction zones based on internal logic — particularly useful for short-term discretionary strategies. Description This indicator creates zone-based bands around internal pivots. The logic behind the bands is based on price interaction

Unlock precision trading with the FVG MUSKX MTF —a next-generation tool engineered to transform your market analysis on MetaTrader 4. Designed with accuracy and usability in mind, this powerful indicator identifies Fair Value Gaps (FVGs) across multiple timeframes, giving traders a clear advantage in spotting institutional footprints and potential price imbalances. Key Features Sharp FVG Detection
Detect Fair Value Gaps with high precision across selected timeframes. Never miss a
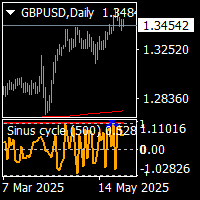
sinus cycle indicator is a non repaint indicator for mt4 terminal. it works all timeframes and all pairs. suitable for experienced traders and beginners. it gives sinus wawes .when the intensive waves appear , it is trend change points. level 1 or -1 is trend reversal . cnt numbers is the bars numbers on the chart.it can be increase ore decrease. minimum cnt value is 500. wave is default 500 value.and can not change if prices on top, cycle level 1 oe -1 means trend will down. if prices down ,c
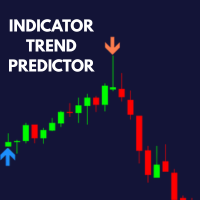
Easy Trend Predictor: Visual Signal Indicator for MT4 The Easy Trend Predictor is a straightforward and user-friendly indicator for MetaTrader 4 that displays clear directional arrows based on trend-based logic. Designed to work across any symbol or timeframe, this tool helps bring clarity to your technical analysis by visually highlighting potential shifts in price movement. Key Features: Directional Arrows
Displays prominent buy and sell arrows directly on the chart based on internal trend-d
Minotaur Waves is a precision-crafted market analysis tool designed to detect confirmed directional shifts and potential reversal zones using a dual-layered signal engine. The system integrates the powerful Minotaur Oscillator with dynamic band analysis to offer accurate, non-repainting signals optimized for active trading. Minotaur Waves is fully compatible with all currency pairs and performs best on EURUSD, GBPUSD, and USDJPY across M1, M5, M15, and M30 timeframes.
Stay up to date with upda
Immerse yourself in a trading environment where adaptability meets precision. Dynamic Grid Pro v1.7 offers a suite of tools designed to refine your approach in the market. This system was developed with the intention of providing a flexible framework for the execution of grid trading strategies. Its core functionality lies in the ability to dynamically adjust grid parameters in response to ever-changing market conditions. Features of Dynamic Grid Pro v1.7: Dynamic Grid: The system automatically
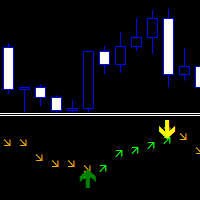
Direction Change Detector - A trend indicator that divides the balance between bullish and bearish movements. It has two lines of arrows with signals confirming their directions.
It can work as a standalone indicator for finding a trend or an additional tool for opening trades and following the directions of signals.
Adaptive to any Market and Time Frame. Does not repaint its readings on history. There are several types of alerts. Green arrows pointing up determine the bullish price direction. O
FREE

VWAP Crossover Signal Indicator for MetaTrader 4 Unlock Precision Trading with the VWAP Crossover Signal Indicator! Elevate your trading strategy with the VWAP Crossover Signal Indicator , a powerful and intuitive tool designed for MetaTrader 4. Built for traders who demand accuracy and clarity, this custom indicator leverages the Volume Weighted Average Price (VWAP) to deliver actionable Buy and Sell signals directly on your chart. Perfect for day traders, scalpers, and swing traders, this ind
FREE

Sniper Flip Zones – Smart Buy/Sell Signal System Join the channel to stay updated: https://www.mql5.com/en/channels/forexnewadvisor
I designed Sniper Flip Zones to generate ultra-precise BUY and SELL signals by identifying moments where momentum shifts sharply in trending or ranging markets. It works exceptionally well on XAUUSD M1/M5 , but can be applied to any pair or timeframe using the configurable parameters.
The core logic combines: Stochastic reversals at extreme levels (10/90) Optional

Gold Flux Signal – Non-Repainting Trade Signal for XAUUSD
Designed for Clean Signal Execution
– The Gold Flux Signal was created to deliver clear and stable entries on XAUUSD , without repainting or backpainting
– It was specifically designed for trend-following and breakout-style strategies, avoiding noise or chart clutter
– The indicator operates fully on closed candles only
– Optimized for use on M1, M5, and H1 timeframes
Stable Visual Signals
– Once a signal is plotted, it remains fixed
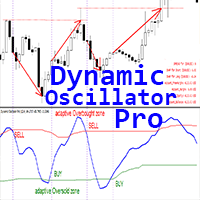
Dynamic Oscillator Pro - is an advanced custom Crypto_Forex indicator - efficient Trading tool for MT4 ! New generation of Oscillators - see pictures to check how to use it. Dynamic Oscillator has adaptive Oversold/Overbought zones.
Oscillator is an auxiliary tool to find exact entry points from OverSold/OverBought areas. Oversold values: below Green line, Overbought values: over Red line . It is much more accurate than standard oscillators. Suitable timeframes: M30, H1, H4, D1, W1. Indic
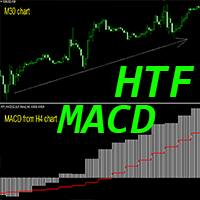
Crypto_Forex Indicator HTF MACD Oscillator for MT4.
- HTF means - higher timeframe. - MACD indicator itself is one of the most popular indicators for trend trading. - This indicator is excellent for Multi-Time Frame trading systems with Price Action entries or in combination with other indicators. - HTF MACD Indicator allows you to attach MACD from higher timeframe to your current chart --> this is professional trading approach. - Indicator has built-in Mobile and PC alerts.
Click here to s

Delta Trigger Indicator
Clear signals. Fast alerts. No repaint.
Delta Trigger is a precision-based arrow indicator that instantly reacts to trend shifts using the DI+ and DI– lines from the ADX. It delivers clean Buy/Sell arrows without repainting, without delay, and without disappearing.
Best Pair: XAUUSD
While Delta Trigger works seamlessly across all Forex pairs and timeframes (from M1 to H4 and beyond), it performs exceptionally well on XAUUSD, where momentum shifts are more aggressive a
Ghost Entry Signal is a non-repainting trend-following indicator designed for high-precision trade entries. It combines dynamic momentum detection, price action filters, and a proprietary alternation logic to avoid false positives and deliver clean BUY/SELL signals. It performs best on EURUSD, USDJPY, and GBPUSD across M1, M5, M15, and M30 timeframes.
Stay informed: https://www.mql5.com/en/channels/forexnewadvisor
Signal Engine Includes: Adaptive Trend Tracking: Uses a dual EMA structure (Fast
SwitchStrike Signal – Indicator Overview
The SwitchStrike Signal is a custom indicator developed for MetaTrader 4 (MT4), designed to assist traders in identifying potential trend reversals by analyzing price movements and volatility.
Join the channel to stay updated: https://www.mql5.com/en/channels/forexnewadvisor
Core Logic and Functionality
Upon initialization, the indicator sets up multiple buffers to store calculated data, including dynamic support and resistance levels, volatility t
BreakAxis — Precision Signals at the Turning Point
Join the channel to stay updated on new releases: https://www.mql5.com/en/channels/forexnewadvisor
Crossover-Based Signal Logic
BreakAxis Signal has been designed to detect directional shifts based on zero-axis crossovers.
Histogram transitions are used to highlight potential market momentum changes, supported by visual confirmation via directional arrows.
Signal Confirmation and Stability
Each signal is generated after specific mathematic

Heiken Ashi Pro – Customizable Trend Visualization Tool Heiken Ashi Pro is an indicator for MetaTrader 4 that generates modified Heiken Ashi candles using a wide range of customizable parameters. It offers alternative smoothing options based on various moving average types and price calculation formulas, making it suitable for traders who prefer to adjust visual trend representation to fit their trading strategy. Main Features: Includes 34 types of moving averages such as SMA, EMA, HMA, KAMA, JM
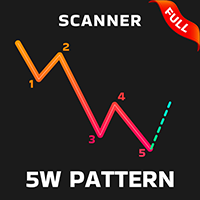
Contact me after payment to send you the User-Manual PDF File. 5W Pattern introduction The 5W pattern occurs when the price forms an alternating 5-wave cycle with its volatility. In fact, the 5W pattern is a price series of alternating HH or LL (higher high or lower low), which is the main characteristic of a trend. The pattern of 5W should have the characteristic of non-overlapping waves, also the points of the pattern are usually formed in Fibonacci levels. The completed pattern of 5W actua
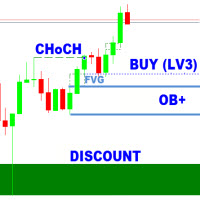
SMC Analyzer Single-Timeframe (STF) for MT4 The SMC Analyzer STF MT4 is a powerful, single-timeframe Smart Money Concepts (SMC) analysis tool designed for precision trade confirmations based on core SMC components. It evaluates market structure across four levels of confirmation using elements such as Break of Structure (BOS), Change of Character (CHoCH), Order Blocks (OB), Fair Value Gaps (FVGs), Liquidity Zones , and Higher Timeframe Trend Bias .
Each level has configurable elements (

Indicator (includes Volume Profile + Order Blocks) - a revolutionary indicator that combines two of the most powerful concepts of modern technical analysis: volume profiles and institutional players' order blocks. This tool allows you to see what is hidden from most traders and gives you a significant advantage in the market.
Key benefits of the indicator: Visualization of "smart money": Clearly shows the areas of concentration of large players, highlighting areas with maximum volume in bright

QuickPivora is a ready-made trading system for scalping. It shows when to open a deal, in which direction to open, when to close a deal. All a trader needs to do is follow the signals and instructions. QuickPivora is a comprehensive trading system that replaces many indicators on the chart, as its signals already take into account the readings of trend indicators, oscillators and channel indicators. The advantage of the QuickPivora trading system is that it is suitable for both beginners and pr

The Swing High Low Indicator is an essential tool for traders who rely on price action. It automatically marks key reversal points (swing highs in red, swing lows in green), helping you visualize trends, spot breakouts, and draw precise trendlines. By highlighting these critical levels, the indicator reveals market structure shifts—whether the trend is strengthening, reversing, or entering consolidation. Perfect for all timeframes and strategies, it turns raw price data into actionable tradi
FREE
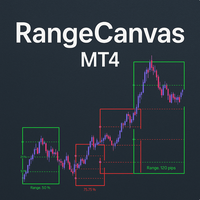
Daily Range Boxes : The indicator draws rectangular boxes around each day's high and low prices, creating a clear visual boundary for the daily trading range. Color-Coded Logic : Green boxes when the current price (or close) is above the daily open Red boxes when the current price is below the daily open Percentage Level Lines : Inside each box, it draws three horizontal lines at: 25% of the daily range 50% of the daily range (midpoint) 75% of the daily range Range Information : Each box displa
FREE
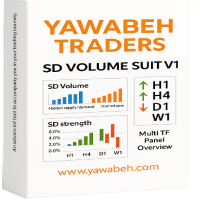
Yawabeh SD Pro – Professional Supply and Demand Indicator Trade Smarter with Volume-Confirmed Supply/Demand Zones Our institutional-grade algorithm identifies high-probability reversal zones before price reacts, giving you the edge in Forex, Crypto, and Stocks. Key Features Multi-Timeframe Confirmation
– View trend strength across multiple timeframes simultaneously
– Align your trades with higher timeframe momentum Smart Alert System
– Real-time notifications for:
– Strong demand/supply zone

The StochasticDivergence is a custom indicator for the MetaTrader 4 (MT4) platform, designed to analyze the divergence between the Stochastic Oscillator (%K line) values of two currency pairs. It compares the Stochastic %K of the chart’s symbol (first symbol) with a user-defined second symbol, displaying both %K values and their absolute difference (divergence) in a separate subwindow. The indicator provides visual and alert-based feedback to highlight significant divergence levels, with custo
FREE

Gold EMA-SMA Crossover Indicator for MT4 – Free Download Boost Your Gold Trading with This Free, Eye-Catching Indicator! Looking for a powerful tool to enhance your gold (XAUUSD) trading strategy? The Gold EMA-SMA Crossover Indicator is a custom-built MetaTrader 4 (MT4) indicator designed to help traders identify high-probability buy and sell opportunities in the fast-moving gold market. And the best part? It’s completely free ! Why Choose This Indicator? Gold trading demands precision and clar
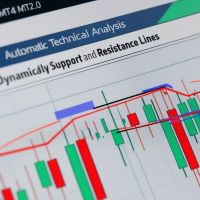
SRline– Automatically Draws Smart Support & Resistance Zones SRline is a simple yet powerful indicator that automatically detects support and resistance zones based on fractal patterns. No manual drawing, no guesswork — every level is calculated accurately using a smart algorithm. Key Features: Automatic detection of fractal highs and lows
Draws arrow markers for support/resistance directly on the chart
Works on all timeframes and currency pairs
Adjustable sensitivity via leftbar
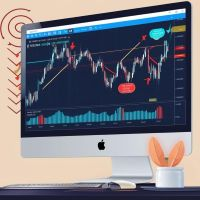
Smart trend forecasting – Reliable Mid-Term Trend Indicator Smart trend forecasting is a modified version of a classic slope-based trend indicator originally developed by Wizard Serg and featured in Forex Magazine #104 . This enhanced version, optimized for mid-term trading, helps traders identify trend direction and momentum shifts with audible alerts and visual markers. Key Features: Slope-based trend detection using a double moving average model
Clear visual signals :
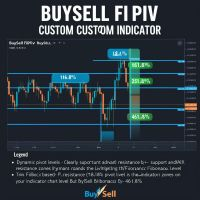
BuySell FibPiv – Fibonacci Pivot Levels with Buy/Sell Zones BuySell FibPiv is a powerful custom indicator that calculates dynamic pivot levels and visualizes Fibonacci-based support/resistance zones for precise intraday and swing trading decisions. It intelligently applies advanced levels like 161.8%, 261.8%, and 461.8%, helping traders anticipate key reversal or continuation areas. Key Features: Calculates Fibonacci pivot points based on the previous day’s price action
Visualizes mult
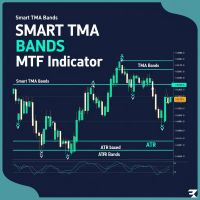
Smart TMA Bands MTF – Adaptive Trend Channel with Multi-Timeframe Support Smart TMA Bands MTF is a powerful and adaptive trend-following indicator based on the Triangular Moving Average (TMA) and dynamic ATR-based bands. Designed for traders who seek clarity in market direction and price volatility across multiple timeframes. Key Features: Centered Triangular Moving Average (TMA) : Smooths out price action for clearer trend visualization. Adaptive ATR Bands : Dynamically calculated upper a

Color Stochastic – Smarter Stochastic Cross with DCA Insights
Overview Color Stochastic is an enhanced and visually optimized version of the classic Stochastic Oscillator. It not only shows market momentum, but also identifies intelligent entry points using a DCA (Dollar Cost Averaging) strategy. With clear color-coded arrows for buy/sell signals based on stochastic crossovers at extreme levels, traders can make timely decisions with confidence. Key Features ️ Classic Stochastic with
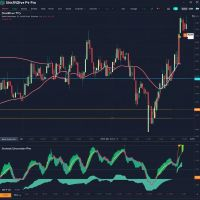
StochDiver PRO – Smart Stochastic Divergence Detector Overview: StochDiver PRO is an advanced divergence detection indicator that identifies both regular and hidden divergences between price action and the Stochastic oscillator . It's especially useful for traders applying DCA (dynamic cost averaging) or reversal strategies. ️ Key Features: Detects bullish and bearish divergences (regular & hidden) Draws price trendlines and indicator trendlines Optional real-time alert notifications
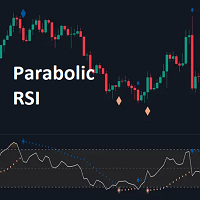
The Parabolic RSI indicator applies the Parabolic SAR directly to the Relative Strength Index (RSI) . This combination helps traders identify trend shifts and potential reversal points within the RSI framework. The indicator provides both regular and strong signals based on whether the Parabolic SAR crosses above or below key RSI thresholds.
KEY FEATURES
Parabolic SAR Applied to RSI – Tracks momentum shifts within the RSI indicator.
Dynamic SAR Dots – Plots SAR levels

Ultra Band is a trend indicator designed for various type of traders ranging from Scalp to Long Term trader. Because it include the current bar price into the calculation, it looks like the repainting only after the bar closed then it's there forever. Strategy of choices for trading the Ultra Band: BUY at the Lower Band / SELL at the Upper Band then exit when price hit the opposite Band. SELL after retracement into Bearish cloud trend or touching the Upper Band, then target the most recent Low B

The RSIDivergence is a custom indicator for the MetaTrader 4 (MT4) platform, designed to analyze the divergence between the Relative Strength Index (RSI) values of two currency pairs. It compares the RSI of the chart’s symbol (first symbol) with a user-defined second symbol, displaying both RSI values and their absolute difference (divergence) in a separate subwindow. The indicator provides visual and alert-based feedback to highlight significant divergence levels, with customizable settings f
Key Features of the Indicator: Buy & Sell Signals: The indicator generates buy and sell signals based on specific conditions. It uses the crossover of the Fast Moving Average (Fast MA) and Slow Moving Average (Slow MA) to determine market entries. The RSI (Relative Strength Index) is used to identify buy signals when RSI is above 50 and below 75. It also considers support and resistance levels for additional confirmation of signals. Trend Filter: The market trend is identified using a Trend Movi
FREE
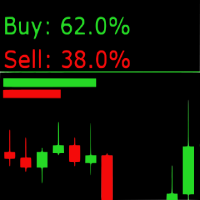
Sentiment Market Indicator: Real-Time Market Sentiment Display The Sentiment Market Indicator is a real-time MQL4 tool that displays current buy/sell sentiment directly on your MetaTrader 4 chart. Designed to support your technical analysis, it provides a visual representation of market positioning to help inform your decision-making process. Key Features Live Sentiment Display
View real-time percentage breakdowns of buy vs. sell sentiment. Customizable Alerts
Set specific thresholds for buy o

G0ldenZone — Precision Reversal Zones for Pro Trading Spot Key Levels Like a Pro! The G0ldenZone indicator automatically scans price action to detect high-probability reversal zones , using a unique combination of: Price Action Pivots (dynamic support/resistance zones). Fibonacci Confluences (critical retracement levels). Volume Profile (high-accumulation/distribution areas). Why Traders Love G0ldenZone? Real-Time Alerts (sound, email, push notifications) when a zone

Let me introduce you to an excellent technical indicator – Grabber, which works as a ready-to-use "All-Inclusive" trading strategy.
Within a single code, it integrates powerful tools for technical market analysis, trading signals (arrows), alert functions, and push notifications. Every buyer of this indicator also receives the following for free: Grabber Utility for automatic management of open orders Step-by-step video guide: how to install, configure, and trade with the indicator Custom set fi
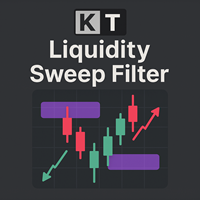
The KT Liquidity Sweep Filter identifies and highlights critical liquidity sweep zones. It combines these zones with clear price-action rejections and an adaptive trend filter to generate precise buy and sell signals aligned with the market trend. It differentiates between major and minor liquidity sweep zones, marking major areas with big arrows and minor ones with smaller arrows for easy identification. Big Arrows: Indicate strong reversal signals originating from major liquidity sweep zones.
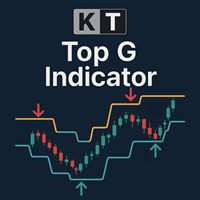
KT Top G is a price action-based indicator that combines smart channel analysis to identify potential market tops and bottoms. When a possible reversal is detected, it plots bold, clear arrows on the chart, giving you a heads-up before the market turns. Big Arrows: Highlight high-probability market tops and bottoms by detecting price exhaustion and momentum shifts. Small Arrows: Indicate lower-probability turning points, which often get broken before the market actually reverses.
Features Broad

The ICT NewYork Open Killzone Indicator is designed for traders who follow Smart Money Concepts (SMC) , ICT trading models , and liquidity based strategies in the Forex market . This tool marks the New York Open Killzone , spanning 11:00 to 14:00 GMT , a critical time when institutional volume often leads to major moves. The indicator highlights session ranges , market maker ranges , liquidity sweeps , FVG zones (Fair Value Gaps) , and breakout opportunities , providi

Rejection Confirmation Indicator - Price Action Analysis Tool Advanced Pin Bar Detection and Market Reversal Analysis This MT4/MT5 indicator analyzes price rejection patterns, specifically focusing on pin bar formations to identify potential market reversal points. The tool provides visual confirmation of price action signals based on established technical analysis principles. Core Analysis Method The indicator employs price rejection pattern recognition to: Detect pin bar formations across mult
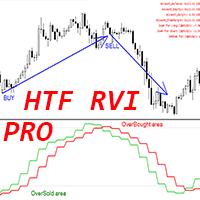
Crypto_Forex Indicator HTF RVI Pro Oscillator for MT4.
- Upgrade your trading methods with the professional HTF RVI Pro Oscillator for MT4. HTF means - Higher Time Frame. - RVI is one of the best oscillators for trend change detection and entry from Oversold/Overbought areas. - This indicator is excellent for Multi-Time Frame trading systems with Price Action entries in OverSold/Bought areas. - HTF RVI Pro Indicator allows you to attach RVI from Higher time frame to your current chart --> t

TURBO ENTRY SYSTEM
High-Speed Crypto Signals – Also Works with Forex Pairs
Turbo Entry System was created with cryptocurrencies in mind — especially BTC/USD , but it is also fully compatible with major Forex pairs . It is optimized for precision scalping , with non-repainting signals and no delay between price action and the visual alert.
No guesswork, no templates, no hidden logic . Just drag the indicator onto the chart and it automatically sets up : background, trend, spread, and signal l
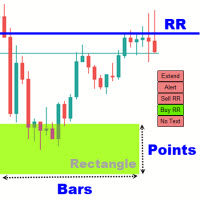
Rectangle Trading Custom is a powerful technical analysis tool designed for price action and range-based traders. It allows users to define consolidation zones and receive alerts when the price breaks out of these zones or approaches trendlines drawn on the chart. Rectangles and Trendlines will be extended into future with one click. Rectangle point size, name and prices will be displayed around rectangle. Key Features: Draw Trading Zones (Rectangle Zones)
Users can manually draw rectangles t

Pairs Trading Z-Score Optimized is a custom indicator for the MetaTrader 4 (MT4) platform, designed to support pairs trading by analyzing the spread between two currency pairs using Z-Score calculations and stationarity testing. It operates on a single pair (the chart’s symbol and a user-defined second symbol) and displays Z-Score values, threshold bands, and trading signals in a subwindow, with optional arrows on the main chart. The indicator incorporates the Augmented Dickey-Fuller (ADF) test

Pair Trading Strategy Based on Spearman Correlation and Stationary Z-Score is A single-pair indicator focusing on one primary symbol (chart symbol) and one secondary symbol for the MetaTrader 4 (MT4) platform, designed to support pairs trading by analyzing the correlation between two currency pairs. It employs Spearman’s rank correlation coefficient, Z-Score calculations, and stationarity testing to generate trading signals, displayed in a subwindow and on the main chart. The indicator integra

Pairs Trading Dashboard - Spearman Correlation and Stationary Z-Score is a custom indicator designed for the MetaTrader 4 (MT4) platform, developed to assist traders in analyzing and monitoring currency pairs for pairs trading strategies. It utilizes Spearman’s rank correlation coefficient and Z-Score calculations to identify trading signals across multiple timeframes and currency pairs. The indicator integrates various technical filters and stationarity tests to refine signal generation and di

Fibonacci Dynamic Channels Ultimate Pro - MetaTrader Indicator
(Ideal for Binary Options Trading | Non-Repainting | Advanced Filtering) https://youtu.be/0ZT3gg29_ss?si=jG86Z0fUARrXg8Aa Overview The Fibonacci Dynamic Channels Ultimate Pro is a sophisticated trading tool designed to identify high-probability reversal zones and trend continuations using Fibonacci ratios. It combines dynamic channels, multi-timeframe filters, and real-time alerts to generate prec

This is an indicator that helps you to scan the whole timeframe then informs you about the last candle position Engulfing Candlestick pattern was formed. The indicator also send alert to your mobile when a new engulfing candle is formed.
For the visual;
1. Green up arrow indicates a bullish engulfing candlestick pattern
2. Red down arrow indicates a bearish engulfing candlestick pattern
FREE

Unlock Instant Pattern Recognition with Our Advanced Trading Indicator Are you looking to instantly spot key candlestick patterns like Engulfing, Doji, Marubozu, Harami, Hanging Man, Shooting Star, Evening Star, Hikkake, Dark Cloud Cover, or Black Crow as they form? With this powerful indicator, you can monitor all 28 currency pairs in real time and get instant alerts whenever one of these crucial patterns is detected. Key Features: Real-Time Alerts: Instantly know when any of the key candlestic
FREE

Have you ever asked yourself why your supply and demand zones fail , even when everything looks “perfect”? The truth is, you're not wrong — you're just watching the reaction, not the reason. It's not like those random currency strength meters that rely on lagging indicators like RSI, CCI, or similar tools mashed together to guess strength or weakness. That approach reacts to the past — not the cause. Pairs like EURUSD or USDJPY are just the outcomes . The real drivers? Currency indices and inst
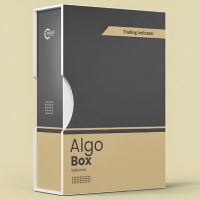
ALGO BOX – Advanced Day Trading System ALGO BOX is a powerful day trading indicator designed for serious traders who demand precision and reliability in breakout trading. Combining advanced price action analysis with real-time data, it helps you spot high-probability trades while keeping risk under control. Why ALGO BOX Stands Out Identify clear, profitable breakout opportunities Reduce false signals for better trade accuracy Track your trading performance with live stats Make smart, data-driven
FREE

Indicator using Zero Length Moving Average and Smooth Heiken Ashi counting (non visual) to help looking the trend is bullish or bearish. Have been tried on XAU/USD pairs and showing when to enter market, BUY or SELL. Have option to showing Arrow if it is good to BUY or to SELL Also have option to give Alert.
Please do not consider this as 100% correct signal. This is just a tool to help trade.

How TrendMaster Works TrendMaster is a trading indicator designed to streamline and enhance your chart analysis. Using algorithmic logic, it reviews historical price data to generate a dynamic reference line. When price action crosses this line, a "BUY" or "SELL" signal is displayed on your chart. The goal is to assist in identifying potential shifts in price behavior with a clear and user-friendly visual approach. Why Use TrendMaster? The TrendMaster MT4 Indicator helps highlight potential tre

Ichimoku Volatility Pro is an advanced Ichimoku indicator dynamically adjusted for market volatility, providing clear visual signals and precise trend identification. It combines the clarity of the traditional Ichimoku Cloud with a sophisticated volatility-based adjustment mechanism, enhancing signal accuracy and responsiveness. This professional indicator automatically scales key Ichimoku components (Tenkan-Sen, Kijun-Sen, Senkou Span A and B, and Chikou Span) according to real-time market vol
The MetaTrader Market offers a convenient and secure venue to buy applications for the MetaTrader platform. Download free demo versions of Expert Advisors and indicators right from your terminal for testing in the Strategy Tester.
Test applications in different modes to monitor the performance and make a payment for the product you want using the MQL5.community Payment System.
You are missing trading opportunities:
- Free trading apps
- Over 8,000 signals for copying
- Economic news for exploring financial markets
Registration
Log in
If you do not have an account, please register
Allow the use of cookies to log in to the MQL5.com website.
Please enable the necessary setting in your browser, otherwise you will not be able to log in.