Something Interesting - page 51
You are missing trading opportunities:
- Free trading apps
- Over 8,000 signals for copying
- Economic news for exploring financial markets
Registration
Log in
You agree to website policy and terms of use
If you do not have an account, please register
Bearish Bullish Harami - indicator for MetaTrader 5
The idea is to visualize, using the DRAW_ARROW drawing style , two patterns 'Bearish Harami' and 'Bullish Harami'
According to the description of these patterns ( Bearish Harami and Bullish Harami )
Forum on trading, automated trading systems and testing trading strategies
Something Interesting
Sergey Golubev, 2016.06.23 21:14
Harami
This is one interesting indicator for MT5 and MT5 for searching harami pattern:
Harami indicator for Metatrader 5;
Harami indicator for Metatrader 4.
"It's just a normal search pattern Harami. You can do with it whatever you want. Personally, I find it useful on H1 charts. Position closes when a reversal characteristics as shown in the central part of the picture. Then open a long position on a 100+ pips. Watch out for feet, expose them tight enough!"
====
Forum on trading, automated trading systems and testing trading strategies
Libraries: MQL5 Wizard - Candlestick Patterns Class
Sergey Golubev, 2013.09.17 14:23
Harami
The Harami (meaning "pregnant" in Japanese) Candlestick Pattern is a reversal pattern. The pattern consists of two Candlesticks:
The Harami Pattern is considered either bullish or bearish based on the criteria below:
Bearish Harami: A bearish Harami occurs when there is a large bullish green candle on Day 1 followed by a smaller bearish or bullish candle on Day 2. The most important aspect of the bearish Harami is that prices gapped down on Day 2 and were unable to move higher back to the close of Day 1. This is a sign that uncertainty is entering the market.
Bullish Harami: A bullish Harami occurs when there is a large bearish red candle on Day 1 followed by a smaller bearish or bullish candle on Day 2. Again, the most important aspect of the bullish Harami is that prices gapped up on Day 2 and price was held up and unable to move lower back to the bearish close of Day 1.
Harami Candlestick Chart ExampleThe chart below of the Nasdaq 100 E-mini Futures contract shows an example of both a bullish and bearish Harami candlestick pattern:
The first Harami pattern shown above on the chart of the E-mini Nasdaq 100 Future is a bullish reversal Harami. First there was a long bearish red candle. Second, the market gapped up at the open. In the case above, Day 2 was a bullish candlestick, which made the bullish Harami even more bullish.
Harami Candlestick Buy SignalA buy signal could be triggered when the day after the bullish Harami occured, price rose higher, closing above the downward resistance trendline. A bullish Harami pattern and a trendline break is a potent combination resulting in a strong buy signal.
The second Harami pattern shown above on the chart of the E-mini Nasdaq 100 Future is a bearish reversal Harami. The first candle was a long bullish green candle. On the second candle, the market gapped down at the open. The chart above of the e-mini shows that Day 2 was a bearish candlestick; this made the bearish Harami even more bearish.
Harami Candlestick Sell SignalA sell signal could be triggered when the day after the bearish Harami occured, price fell even further down, closing below the upward support trendline. When combined, a bearish Harami pattern and a trendline break is a strong indication to sell.
A somewhat opposite two candlestick reversal pattern is the Bearish Engulfing PatternThis is interesting indicator (for MT5):
----------------
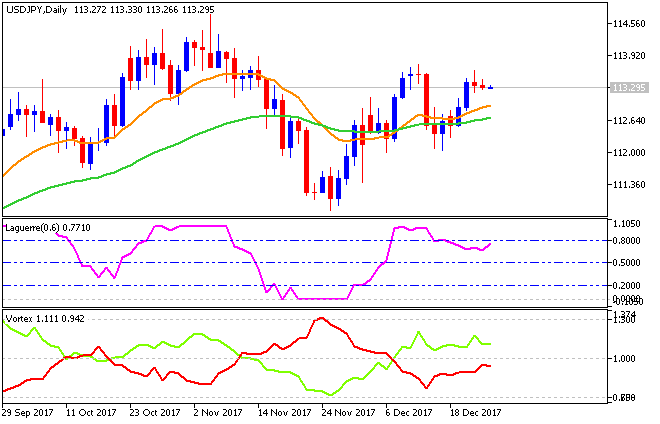
Vortex Oscillator - indicator for MetaTrader 5Oscillator based on Vortex indicator - displays the difference between lines VI + and VI- in the form of a histogram.
----------------
Vortex - indicator for MetaTrader 5
The indicator was described in the article "The Vortex Indicator" published in the January issue of "Technical Analysis of Stocks & Commodities" (2010).
Vortex_Trend - indicator for MetaTrader 5
Information and signal indicator Vortex Trend. It is based on the Vortex indicator, and displays in a separate chart window a color chart of the trend direction.
3 in 1: Stoch + CCI + RSI
----------------
3 in 1: Stoch + CCI + RSI - indicator for MetaTrader 4
and
iCCI iStochastic iRSI weight - индикатор для MetaTrader 5
Interesting indicators were coded by Mladen based on June 2020 TASC article "Correlation as a cycle indicator" by John Ehlers
----------------
In his June 2020 TASC article "Correlation as a cycle indicator" John Ehlers describes one possible way to determine trend in the markets
His article describes 3 possible ways of determining the trend and here we shall post all the 3 possible ways.
Hammer and Hanging Man Candlestick EA - expert for MetaTrader 5
Trading in two patterns: 'Hammer' (Hammer) and 'Hanging Man' (Hanged Man). Stop loss is floating and depends on the pattern found.
===========
Video with mini-articles
Kamikaze Trading - script for MetaTrader 5
This script opens order with maximal amount of volume available with active chart symbol.
Take Profit and Order Type is specified by user.
There is no Stop-Loss. Trade will be open until account has been blown up.
I want to remind about the following:
1. -Forum on trading, automated trading systems and testing trading strategies
Please fix this indicator or EA
Sergey Golubev, 2017.03.24 07:23
And this is my other suggestion (which came from tsd 2010 and from tsd 2008):
----------------
Just to remind:
Coders (any coder) are coding for free:
and Freelance section of the forum should be used in most of the cases.
2. -
But in this case - we all should know about the following: moderators of Freelance service are banning the users who are participating in the job with decompillation.
Read post #361 to know and to be informed about.
3. -
And I want to remind that we are able to make a personal order. It means, if we found the developer/coder who agreed to do something what you/we want so you/we can make a personal order to him in Freelance.
Read this thread https://www.mql5.com/en/forum/343768 to know about it.
Morning Star - indicator for MetaTrader 5
This indicator is showing the ' Morning Star ' pattern on the chart.
The indicator has several settings, which allows it to be used both for the Forex market and for exchange symbols: ' Gap ', ' Candle 2 type ' and ' Candle sizes '.Forum on trading, automated trading systems and testing trading strategies
strategy
Sergey Golubev, 2016.03.24 17:43
The Strategy
Simple iMA Trailing - expert for MetaTrader 5
Using the iMA (Moving Average, MA) indicator, at the moment of the birth of a new bar, move the Stop Loss for a profitable position.
Trailing is carried out only for a profitable position, but at the same time Stop Loss can be set with a loss (for example, we have a profitable BUY position and Stop Loss for it will be set below the position open price - thus, if Stop Loss is triggered, the position will be closed with a loss).