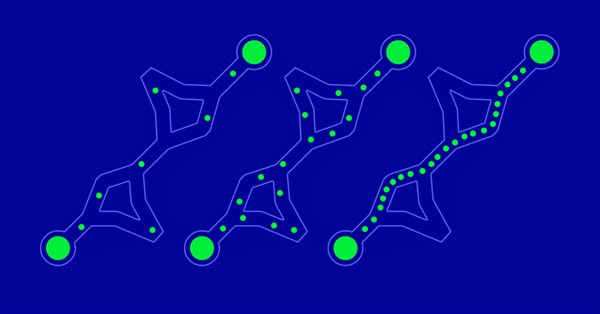
Population optimization algorithms: Ant Colony Optimization (ACO)
This time I will analyze the Ant Colony optimization algorithm. The algorithm is very interesting and complex. In the article, I make an attempt to create a new type of ACO.

Category Theory in MQL5 (Part 1)
Category Theory is a diverse and expanding branch of Mathematics which as of yet is relatively uncovered in the MQL community. These series of articles look to introduce and examine some of its concepts with the overall goal of establishing an open library that attracts comments and discussion while hopefully furthering the use of this remarkable field in Traders' strategy development.

Developing a trading Expert Advisor from scratch (Part 31): Towards the future (IV)
We continue to remove separate parts from our EA. This is the last article within this series. And the last thing to be removed is the sound system. This can be a bit confusing if you haven't followed these article series.

Magic of time trading intervals with Frames Analyzer tool
What is Frames Analyzer? This is a plug-in module for any Expert Advisor for analyzing optimization frames during parameter optimization in the strategy tester, as well as outside the tester, by reading an MQD file or a database that is created immediately after parameter optimization. You will be able to share these optimization results with other users who have the Frames Analyzer tool to discuss the results together.

Neural networks made easy (Part 31): Evolutionary algorithms
In the previous article, we started exploring non-gradient optimization methods. We got acquainted with the genetic algorithm. Today, we will continue this topic and will consider another class of evolutionary algorithms.
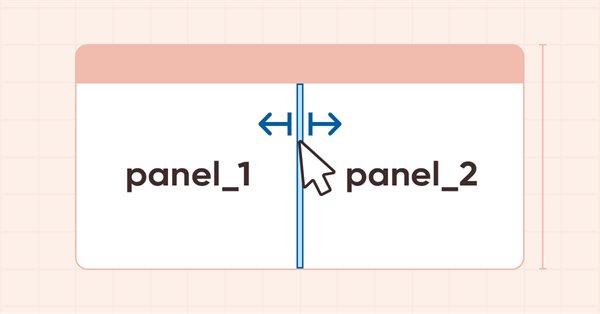
DoEasy. Controls (Part 24): Hint auxiliary WinForms object
In this article, I will revise the logic of specifying the base and main objects for all WinForms library objects, develop a new Hint base object and several of its derived classes to indicate the possible direction of moving the separator.

Adaptive indicators
In this article, I will consider several possible approaches to creating adaptive indicators. Adaptive indicators are distinguished by the presence of feedback between the values of the input and output signals. This feedback allows the indicator to independently adjust to the optimal processing of financial time series values.
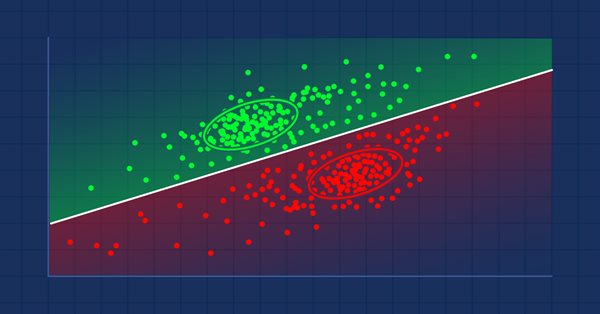
MQL5 Wizard techniques you should know (Part 04): Linear Discriminant Analysis
Todays trader is a philomath who is almost always looking up new ideas, trying them out, choosing to modify them or discard them; an exploratory process that should cost a fair amount of diligence. These series of articles will proposition that the MQL5 wizard should be a mainstay for traders in this effort.

DoEasy. Controls (Part 23): Improving TabControl and SplitContainer WinForms objects
In this article, I will add new mouse events relative to the boundaries of the working areas of WinForms objects and fix some shortcomings in the functioning of the TabControl and SplitContainer controls.
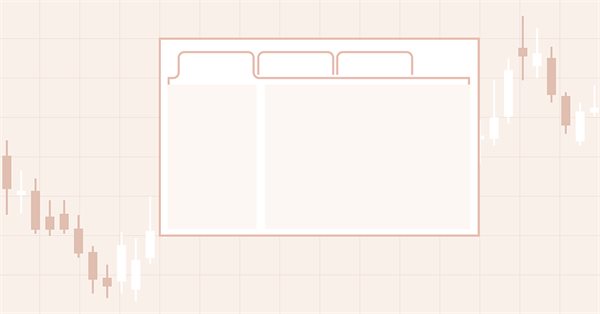
DoEasy. Controls (Part 22): SplitContainer. Changing the properties of the created object
In the current article, I will implement the ability to change the properties and appearance of the newly created SplitContainer control.

Developing an Expert Advisor from scratch (Part 30): CHART TRADE as an indicator?
Today we are going to use Chart Trade again, but this time it will be an on-chart indicator which may or may not be present on the chart.

Neural networks made easy (Part 30): Genetic algorithms
Today I want to introduce you to a slightly different learning method. We can say that it is borrowed from Darwin's theory of evolution. It is probably less controllable than the previously discussed methods but it allows training non-differentiable models.

Neural networks made easy (Part 29): Advantage Actor-Critic algorithm
In the previous articles of this series, we have seen two reinforced learning algorithms. Each of them has its own advantages and disadvantages. As often happens in such cases, next comes the idea to combine both methods into an algorithm, using the best of the two. This would compensate for the shortcomings of each of them. One of such methods will be discussed in this article.

Population optimization algorithms: Particle swarm (PSO)
In this article, I will consider the popular Particle Swarm Optimization (PSO) algorithm. Previously, we discussed such important characteristics of optimization algorithms as convergence, convergence rate, stability, scalability, as well as developed a test stand and considered the simplest RNG algorithm.

Neural networks made easy (Part 28): Policy gradient algorithm
We continue to study reinforcement learning methods. In the previous article, we got acquainted with the Deep Q-Learning method. In this method, the model is trained to predict the upcoming reward depending on the action taken in a particular situation. Then, an action is performed in accordance with the policy and the expected reward. But it is not always possible to approximate the Q-function. Sometimes its approximation does not generate the desired result. In such cases, approximation methods are applied not to utility functions, but to a direct policy (strategy) of actions. One of such methods is Policy Gradient.

DoEasy. Controls (Part 21): SplitContainer control. Panel separator
In this article, I will create the class of an auxiliary panel separator object for the SplitContainer control.
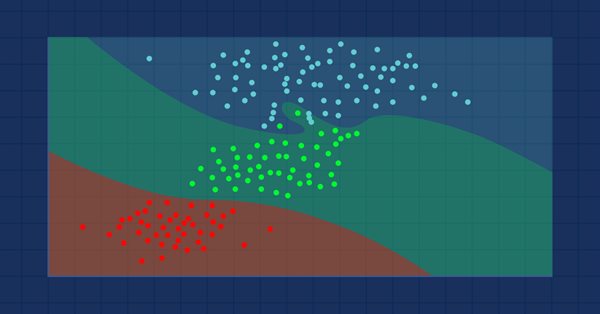
Data Science and Machine Learning (Part 09): The K-Nearest Neighbors Algorithm (KNN)
This is a lazy algorithm that doesn't learn from the training dataset, it stores the dataset instead and acts immediately when it's given a new sample. As simple as it is, it is used in a variety of real-world applications.

DoEasy. Controls (Part 20): SplitContainer WinForms object
In the current article, I will start developing the SplitContainer control from the MS Visual Studio toolkit. This control consists of two panels separated by a vertical or horizontal movable separator.

Developing a trading Expert Advisor from scratch (Part 29): The talking platform
In this article, we will learn how to make the MetaTrader 5 platform talk. What if we make the EA more fun? Financial market trading is often too boring and monotonous, but we can make this job less tiring. Please note that this project can be dangerous for those who experience problems such as addiction. However, in a general case, it just makes things less boring.

How to deal with lines using MQL5
In this article, you will find your way to deal with the most important lines like trendlines, support, and resistance by MQL5.

Neural networks made easy (Part 27): Deep Q-Learning (DQN)
We continue to study reinforcement learning. In this article, we will get acquainted with the Deep Q-Learning method. The use of this method has enabled the DeepMind team to create a model that can outperform a human when playing Atari computer games. I think it will be useful to evaluate the possibilities of the technology for solving trading problems.

Neural networks made easy (Part 26): Reinforcement Learning
We continue to study machine learning methods. With this article, we begin another big topic, Reinforcement Learning. This approach allows the models to set up certain strategies for solving the problems. We can expect that this property of reinforcement learning will open up new horizons for building trading strategies.
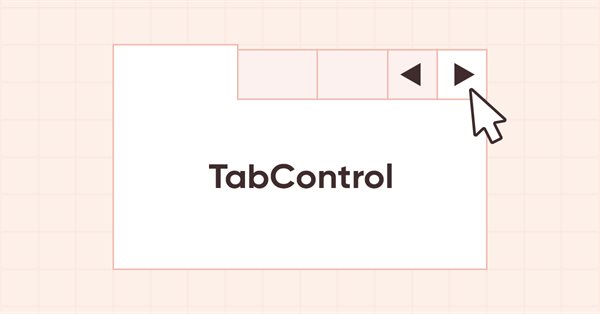
DoEasy. Controls (Part 19): Scrolling tabs in TabControl, WinForms object events
In this article, I will create the functionality for scrolling tab headers in TabControl using scrolling buttons. The functionality is meant to place tab headers into a single line from either side of the control.
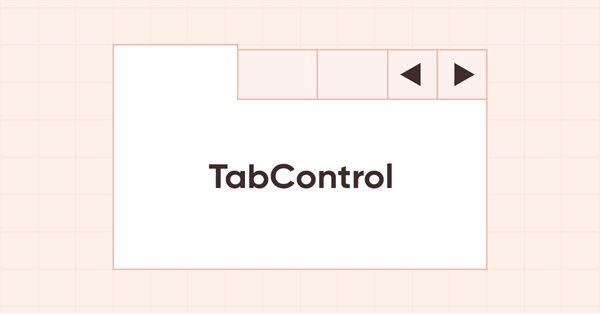
DoEasy. Controls (Part 18): Functionality for scrolling tabs in TabControl
In this article, I will place header scrolling control buttons in TabControl WinForms object in case the header bar does not fit the size of the control. Besides, I will implement the shift of the header bar when clicking on the cropped tab header.

Neural networks made easy (Part 25): Practicing Transfer Learning
In the last two articles, we developed a tool for creating and editing neural network models. Now it is time to evaluate the potential use of Transfer Learning technology using practical examples.

Developing a trading Expert Advisor from scratch (Part 28): Towards the future (III)
There is still one task which our order system is not up to, but we will FINALLY figure it out. The MetaTrader 5 provides a system of tickets which allows creating and correcting order values. The idea is to have an Expert Advisor that would make the same ticket system faster and more efficient.
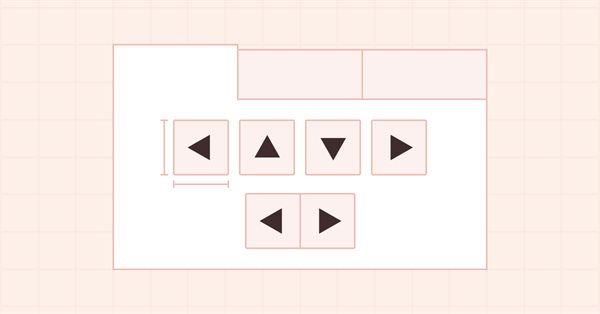
DoEasy. Controls (Part 17): Cropping invisible object parts, auxiliary arrow buttons WinForms objects
In this article, I will create the functionality for hiding object sections located beyond their containers. Besides, I will create auxiliary arrow button objects to be used as part of other WinForms objects.

Neural networks made easy (Part 24): Improving the tool for Transfer Learning
In the previous article, we created a tool for creating and editing the architecture of neural networks. Today we will continue working on this tool. We will try to make it more user friendly. This may see, top be a step away form our topic. But don't you think that a well organized workspace plays an important role in achieving the result.

DoEasy. Controls (Part 16): TabControl WinForms object — several rows of tab headers, stretching headers to fit the container
In this article, I will continue the development of TabControl and implement the arrangement of tab headers on all four sides of the control for all modes of setting the size of headers: Normal, Fixed and Fill To Right.
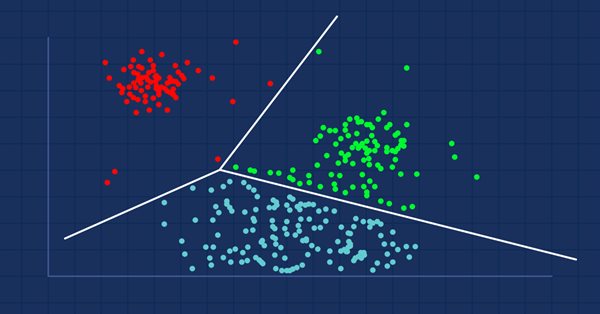
Data Science and Machine Learning (Part 08): K-Means Clustering in plain MQL5
Data mining is crucial to a data scientist and a trader because very often, the data isn't as straightforward as we think it is. The human eye can not understand the minor underlying pattern and relationships in the dataset, maybe the K-means algorithm can help us with that. Let's find out...

Learn how to design a trading system by Fractals
This article is a new one from our series about how to design a trading system based on the most popular technical indicators. We will learn a new indicator which Fractals indicator and we will learn how to design a trading system based on it to be executed in the MetaTrader 5 terminal.


DIY technical indicator
In this article, I will consider the algorithms allowing you to create your own technical indicator. You will learn how to obtain pretty complex and interesting results with very simple initial assumptions.


Market math: profit, loss and costs
In this article, I will show you how to calculate the total profit or loss of any trade, including commission and swap. I will provide the most accurate mathematical model and use it to write the code and compare it with the standard. Besides, I will also try to get on the inside of the main MQL5 function to calculate profit and get to the bottom of all the necessary values from the specification.

Developing a trading Expert Advisor from scratch (Part 27): Towards the future (II)
Let's move on to a more complete order system directly on the chart. In this article, I will show a way to fix the order system, or rather, to make it more intuitive.

DoEasy. Controls (Part 15): TabControl WinForms object — several rows of tab headers, tab handling methods
In this article, I will continue working on the TabControl WinForm object — I will create a tab field object class, make it possible to arrange tab headers in several rows and add methods for handling object tabs.

Developing a trading Expert Advisor from scratch (Part 26): Towards the future (I)
Today we will take our order system to the next level. But before that, we need to solve a few problems. Now we have some questions that are related to how we want to work and what things we do during the trading day.

Developing a trading Expert Advisor from scratch (Part 25): Providing system robustness (II)
In this article, we will make the final step towards the EA's performance. So, be prepared for a long read. To make our Expert Advisor reliable, we will first remove everything from the code that is not part of the trading system.

Developing a trading Expert Advisor from scratch (Part 24): Providing system robustness (I)
In this article, we will make the system more reliable to ensure a robust and secure use. One of the ways to achieve the desired robustness is to try to re-use the code as much as possible so that it is constantly tested in different cases. But this is only one of the ways. Another one is to use OOP.


Population optimization algorithms
This is an introductory article on optimization algorithm (OA) classification. The article attempts to create a test stand (a set of functions), which is to be used for comparing OAs and, perhaps, identifying the most universal algorithm out of all widely known ones.

Neural networks made easy (Part 23): Building a tool for Transfer Learning
In this series of articles, we have already mentioned Transfer Learning more than once. However, this was only mentioning. in this article, I suggest filling this gap and taking a closer look at Transfer Learning.