MQL4 and MQL5 Programming Articles
Study the MQL5 language for programming trading strategies in numerous published articles mostly written by you - the community members. The articles are grouped into categories to help you quicker find answers to any questions related to programming: Integration, Tester, Trading Strategies, etc.
Follow our new publications and discuss them on the Forum!
Add a new article

You are missing trading opportunities:
- Free trading apps
- Over 8,000 signals for copying
- Economic news for exploring financial markets
Registration
Log in
You agree to website policy and terms of use
If you do not have an account, please register

Reimagining Classic Strategies in MQL5 (Part II): FTSE100 and UK Gilts
In this series of articles, we explore popular trading strategies and try to improve them using AI. In today's article, we revisit the classical trading strategy built on the relationship between the stock market and the bond market.

MQL5 Wizard Techniques you should know (Part 37): Gaussian Process Regression with Linear and Matérn Kernels
Linear Kernels are the simplest matrix of its kind used in machine learning for linear regression and support vector machines. The Matérn kernel on the other hand is a more versatile version of the Radial Basis Function we looked at in an earlier article, and it is adept at mapping functions that are not as smooth as the RBF would assume. We build a custom signal class that utilizes both kernels in forecasting long and short conditions.

Formulating Dynamic Multi-Pair EA (Part 1): Currency Correlation and Inverse Correlation
Dynamic multi pair Expert Advisor leverages both on correlation and inverse correlation strategies to optimize trading performance. By analyzing real-time market data, it identifies and exploits the relationship between currency pairs.

Creating an MQL5-Telegram Integrated Expert Advisor (Part 5): Sending Commands from Telegram to MQL5 and Receiving Real-Time Responses
In this article, we create several classes to facilitate real-time communication between MQL5 and Telegram. We focus on retrieving commands from Telegram, decoding and interpreting them, and sending appropriate responses back. By the end, we ensure that these interactions are effectively tested and operational within the trading environment

Developing a multi-currency Expert Advisor (Part 9): Collecting optimization results for single trading strategy instances
Let's outline the main stages of the EA development. One of the first things to be done will be to optimize a single instance of the developed trading strategy. Let's try to collect all the necessary information about the tester passes during the optimization in one place.

Introduction to MQL5 (Part 9): Understanding and Using Objects in MQL5
Learn to create and customize chart objects in MQL5 using current and historical data. This project-based guide helps you visualize trades and apply MQL5 concepts practically, making it easier to build tools tailored to your trading needs.

Neural Networks Made Easy (Part 86): U-Shaped Transformer
We continue to study timeseries forecasting algorithms. In this article, we will discuss another method: the U-shaped Transformer.

Reimagining Classic Strategies (Part VIII): Currency Markets And Precious Metals on the USDCAD
In this series of articles, we revisit well-known trading strategies to see if we can improve them using AI. In today's discussion, join us as we test whether there is a reliable relationship between precious metals and currencies.

MQL5 Wizard Techniques you should know (Part 36): Q-Learning with Markov Chains
Reinforcement Learning is one of the three main tenets in machine learning, alongside supervised learning and unsupervised learning. It is therefore concerned with optimal control, or learning the best long-term policy that will best suit the objective function. It is with this back-drop, that we explore its possible role in informing the learning-process to an MLP of a wizard assembled Expert Advisor.

Neural Networks Made Easy (Part 85): Multivariate Time Series Forecasting
In this article, I would like to introduce you to a new complex timeseries forecasting method, which harmoniously combines the advantages of linear models and transformers.

Neural Networks Made Easy (Part 84): Reversible Normalization (RevIN)
We already know that pre-processing of the input data plays a major role in the stability of model training. To process "raw" input data online, we often use a batch normalization layer. But sometimes we need a reverse procedure. In this article, we discuss one of the possible approaches to solving this problem.

Creating an MQL5-Telegram Integrated Expert Advisor (Part 4): Modularizing Code Functions for Enhanced Reusability
In this article, we refactor the existing code used for sending messages and screenshots from MQL5 to Telegram by organizing it into reusable, modular functions. This will streamline the process, allowing for more efficient execution and easier code management across multiple instances.

Brain Storm Optimization algorithm (Part II): Multimodality
In the second part of the article, we will move on to the practical implementation of the BSO algorithm, conduct tests on test functions and compare the efficiency of BSO with other optimization methods.

Neural Networks Made Easy (Part 83): The "Conformer" Spatio-Temporal Continuous Attention Transformer Algorithm
This article introduces the Conformer algorithm originally developed for the purpose of weather forecasting, which in terms of variability and capriciousness can be compared to financial markets. Conformer is a complex method. It combines the advantages of attention models and ordinary differential equations.

Building A Candlestick Trend Constraint Model (Part 8): Expert Advisor Development (II)
Think about an independent Expert Advisor. Previously, we discussed an indicator-based Expert Advisor that also partnered with an independent script for drawing risk and reward geometry. Today, we will discuss the architecture of an MQL5 Expert Advisor, that integrates, all the features in one program.

Developing a multi-currency Expert Advisor (Part 8): Load testing and handling a new bar
As we progressed, we used more and more simultaneously running instances of trading strategies in one EA. Let's try to figure out how many instances we can get to before we hit resource limitations.

Example of Causality Network Analysis (CNA) and Vector Auto-Regression Model for Market Event Prediction
This article presents a comprehensive guide to implementing a sophisticated trading system using Causality Network Analysis (CNA) and Vector Autoregression (VAR) in MQL5. It covers the theoretical background of these methods, provides detailed explanations of key functions in the trading algorithm, and includes example code for implementation.

Reimagining Classic Strategies (Part VII) : Forex Markets And Sovereign Debt Analysis on the USDJPY
In today's article, we will analyze the relationship between future exchange rates and government bonds. Bonds are among the most popular forms of fixed income securities and will be the focus of our discussion.Join us as we explore whether we can improve a classic strategy using AI.

Developing a Replay System (Part 45): Chart Trade Project (IV)
The main purpose of this article is to introduce and explain the C_ChartFloatingRAD class. We have a Chart Trade indicator that works in a rather interesting way. As you may have noticed, we still have a fairly small number of objects on the chart, and yet we get the expected functionality. The values present in the indicator can be edited. The question is, how is this possible? This article will start to make things clearer.

Implementing a Rapid-Fire Trading Strategy Algorithm with Parabolic SAR and Simple Moving Average (SMA) in MQL5
In this article, we develop a Rapid-Fire Trading Expert Advisor in MQL5, leveraging the Parabolic SAR and Simple Moving Average (SMA) indicators to create a responsive trading strategy. We detail the strategy’s implementation, including indicator usage, signal generation, and the testing and optimization process.

MQL5 Wizard Techniques you should know (Part 35): Support Vector Regression
Support Vector Regression is an idealistic way of finding a function or ‘hyper-plane’ that best describes the relationship between two sets of data. We attempt to exploit this in time series forecasting within custom classes of the MQL5 wizard.

Developing a Replay System (Part 44): Chart Trade Project (III)
In the previous article I explained how you can manipulate template data for use in OBJ_CHART. In that article, I only outlined the topic without going into details, since in that version the work was done in a very simplified way. This was done to make it easier to explain the content, because despite the apparent simplicity of many things, some of them were not so obvious, and without understanding the simplest and most basic part, you would not be able to truly understand the entire picture.

Brain Storm Optimization algorithm (Part I): Clustering
In this article, we will look at an innovative optimization method called BSO (Brain Storm Optimization) inspired by a natural phenomenon called "brainstorming". We will also discuss a new approach to solving multimodal optimization problems the BSO method applies. It allows finding multiple optimal solutions without the need to pre-determine the number of subpopulations. We will also consider the K-Means and K-Means++ clustering methods.

Matrix Factorization: The Basics
Since the goal here is didactic, we will proceed as simply as possible. That is, we will implement only what we need: matrix multiplication. You will see today that this is enough to simulate matrix-scalar multiplication. The most significant difficulty that many people encounter when implementing code using matrix factorization is this: unlike scalar factorization, where in almost all cases the order of the factors does not change the result, this is not the case when using matrices.

Gain an Edge Over Any Market (Part III): Visa Spending Index
In the world of big data, there are millions of alternative datasets that hold the potential to enhance our trading strategies. In this series of articles, we will help you identify the most informative public datasets.

Automating Trading Strategies with Parabolic SAR Trend Strategy in MQL5: Crafting an Effective Expert Advisor
In this article, we will automate the trading strategies with Parabolic SAR Strategy in MQL5: Crafting an Effective Expert Advisor. The EA will make trades based on trends identified by the Parabolic SAR indicator.

Neural Network in Practice: Secant Line
As already explained in the theoretical part, when working with neural networks we need to use linear regressions and derivatives. Why? The reason is that linear regression is one of the simplest formulas in existence. Essentially, linear regression is just an affine function. However, when we talk about neural networks, we are not interested in the effects of direct linear regression. We are interested in the equation that generates this line. We are not that interested in the line created. Do you know the main equation that we need to understand? If not, I recommend reading this article to understanding it.

Application of Nash's Game Theory with HMM Filtering in Trading
This article delves into the application of John Nash's game theory, specifically the Nash Equilibrium, in trading. It discusses how traders can utilize Python scripts and MetaTrader 5 to identify and exploit market inefficiencies using Nash's principles. The article provides a step-by-step guide on implementing these strategies, including the use of Hidden Markov Models (HMM) and statistical analysis, to enhance trading performance.

MQL5 Wizard Techniques you should know (Part 34): Price-Embedding with an Unconventional RBM
Restricted Boltzmann Machines are a form of neural network that was developed in the mid 1980s at a time when compute resources were prohibitively expensive. At its onset, it relied on Gibbs Sampling and Contrastive Divergence in order to reduce dimensionality or capture the hidden probabilities/properties over input training data sets. We examine how Backpropagation can perform similarly when the RBM ‘embeds’ prices for a forecasting Multi-Layer-Perceptron.
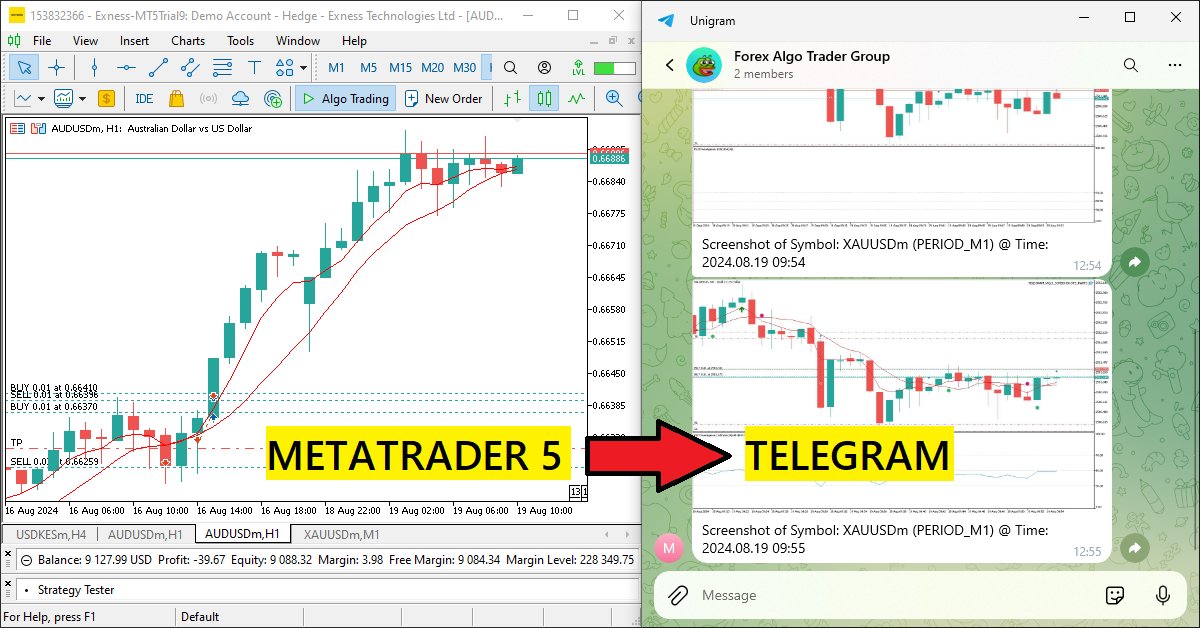
Creating an MQL5-Telegram Integrated Expert Advisor (Part 3): Sending Chart Screenshots with Captions from MQL5 to Telegram
In this article, we create an MQL5 Expert Advisor that encodes chart screenshots as image data and sends them to a Telegram chat via HTTP requests. By integrating photo encoding and transmission, we enhance the existing MQL5-Telegram system with visual trading insights directly within Telegram.

Creating a Trading Administrator Panel in MQL5 (Part I): Building a Messaging Interface
This article discusses the creation of a Messaging Interface for MetaTrader 5, aimed at System Administrators, to facilitate communication with other traders directly within the platform. Recent integrations of social platforms with MQL5 allow for quick signal broadcasting across different channels. Imagine being able to validate sent signals with just a click—either "YES" or "NO." Read on to learn more.

Developing a multi-currency Expert Advisor (Part 7): Selecting a group based on forward period
Previously, we evaluated the selection of a group of trading strategy instances, with the aim of improving the results of their joint operation, only on the same time period, in which the optimization of individual instances was carried out. Let's see what happens in the forward period.

Reimagining Classic Strategies (Part VI): Multiple Time-Frame Analysis
In this series of articles, we revisit classic strategies to see if we can improve them using AI. In today's article, we will examine the popular strategy of multiple time-frame analysis to judge if the strategy would be enhanced with AI.

Integrating MQL5 with data processing packages (Part 2): Machine Learning and Predictive Analytics
In our series on integrating MQL5 with data processing packages, we delve in to the powerful combination of machine learning and predictive analysis. We will explore how to seamlessly connect MQL5 with popular machine learning libraries, to enable sophisticated predictive models for financial markets.

Non-stationary processes and spurious regression
The article demonstrates spurious regression occurring when attempting to apply regression analysis to non-stationary processes using Monte Carlo simulation.

MQL5 Wizard Techniques you should know (Part 33): Gaussian Process Kernels
Gaussian Process Kernels are the covariance function of the Normal Distribution that could play a role in forecasting. We explore this unique algorithm in a custom signal class of MQL5 to see if it could be put to use as a prime entry and exit signal.

Population optimization algorithms: Bird Swarm Algorithm (BSA)
The article explores the bird swarm-based algorithm (BSA) inspired by the collective flocking interactions of birds in nature. The different search strategies of individuals in BSA, including switching between flight, vigilance and foraging behavior, make this algorithm multifaceted. It uses the principles of bird flocking, communication, adaptability, leading and following to efficiently find optimal solutions.

Reimagining Classic Strategies (Part V): Multiple Symbol Analysis on USDZAR
In this series of articles, we revisit classical strategies to see if we can improve the strategy using AI. In today's article, we will examine a popular strategy of multiple symbol analysis using a basket of correlated securities, we will focus on the exotic USDZAR currency pair.

MQL5 Wizard Techniques you should know (Part 32): Regularization
Regularization is a form of penalizing the loss function in proportion to the discrete weighting applied throughout the various layers of a neural network. We look at the significance, for some of the various regularization forms, this can have in test runs with a wizard assembled Expert Advisor.

Pattern Recognition Using Dynamic Time Warping in MQL5
In this article, we discuss the concept of dynamic time warping as a means of identifying predictive patterns in financial time series. We will look into how it works as well as present its implementation in pure MQL5.