
Magic of time trading intervals with Frames Analyzer tool
Contents
- Introduction
- Tool description
- Database of optimization results
- How to use the Frames Analyzer tool?
- Applying removed intervals in Expert Advisors
- Conclusion
Introduction
In this article, I want to show you a rather interesting tool that allows you to take a deeper look at the optimization results of any trading algorithm. It is even possible to improve the results of your real automated trading with a minimum of effort and cost.
What is Frames Analyzer? This is a plug-in library for any Expert Advisor for analyzing optimization frames during parameter optimization in the tester, as well as outside the tester, by reading an MQD file or a database that is created immediately after parameter optimization.
This is an exclusive solution that has never been demonstrated anywhere in this form, although it was implemented more than three years ago already. For the first time, the idea was formulated in detail and implemented in code by an active member of the MQL community fxsaber.
Some intermediate implementations of optimization frame analysis applications have been covered in some of my articles:
- Visualizing trading strategy optimization in MetaTrader 5
- Processing optimization results in the graphical interface
- Visualizing optimization results using a selected criterion
By combining all these ideas, a rather interesting and informative tool was obtained. It will be covered in detail in this article.
Tool description
The module contains an embedded graphical interface created using the EasyAndFastGUI v2.0 library, which requires no additional coding. We need to connect to several main functions of the MQL application (shown below).
The graphical interface consists of several sections. Let's have a look at them.
Frames tab
Elements:
- The Open DB button to open a database that contains optimization frames. This button appears only in Frames Analyzer. So, outside the tester, the EA will work in the reading mode of the DB file created by the EA after parameter optimization.
- The Open MQD-file button for opening an MQD file that contains optimization frames. This button appears only in Frames Analyzer. So, outside the tester, the EA will work in the reading mode of the MQD file created by the tester after parameter optimization (this is to be eliminated in the version meant for paid distribution).
- Curves total entry field for specifying the number of balances displayed on the chart at the same time.
- Replay frames button to start replaying frames.
- Balance graph (Optimization result).
- Graph of all results (Profit/Loss).
If the Frames Analyzer module is connected to the EA as a library, then the graph with Frames Analyzer EA is opened in the tester during parameter optimization and it is possible to immediately observe all intermediate results (balances).
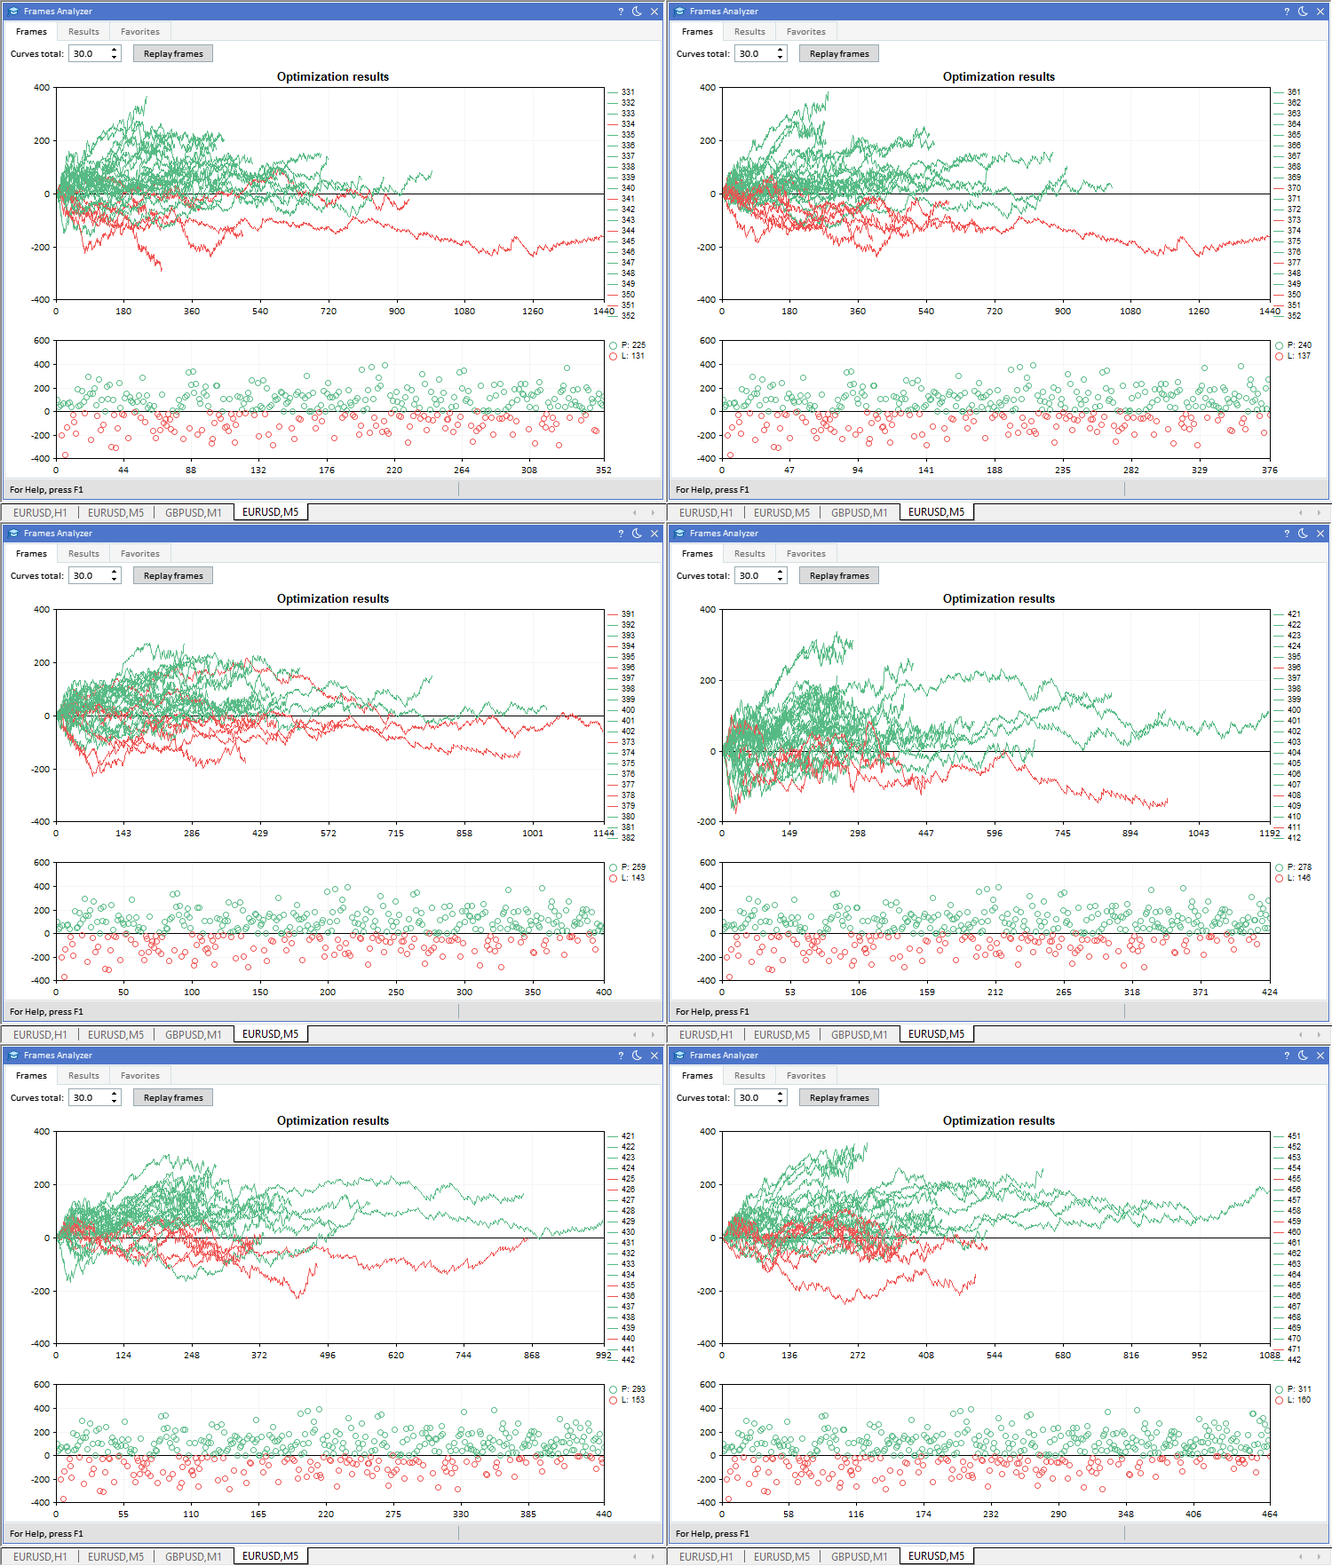
Visualizing results during parameter optimization
Results tab
There are two tables at the top:
- The Add to favorites button for adding results to favorites.
- Removed intervals entry field for specifying the number of excluded intervals with unprofitable series.
- Combobox with the Criterion dropdown list for selecting results according to the specified criteria:
- Profit - 100 results are selected from the total number by the maximum balance (the same goes to other criteria).
- Trades - 100 results are selected by the maximum number of trades.
- DD (drawdown) - 100 results are selected by the minimum drawdown.
- RF (recovery factor) - 100 results are selected by the maximum recovery factor.
- The same criteria with the BI_ prefix show the same values after the exclusion of unprofitable trade series.
- The table with top 100 best maximum balance results. Column cells related to improved results (featuring the BI_ prefix) have a different color to quickly distinguish them visually (see the screenshot below). Column cells with external parameters are also highlighted in their own color to quickly identify them.
- The table with results after deleting losing periods from the trading history with all intermediate results.
When the mouse cursor hovers over a particular table, you can switch rows using the keys: UP, DOWN, PAGE UP, PAGE DOWN, HOME and END. The LEFT and RIGHT keys allow you to quickly navigate the tables from beginning to end horizontally.
At the bottom, there is an area with two tabs: Balances and Top 100 results. Let's have a look at them.
Balances tab
There are two graphs here:
- On the left, there is the chart with the initial balance and all intermediate improved results after deleting losing series of trades. We can see how the balance graph changes after the exclusion of the unprofitable series.
- On the right, there is a graph with an improved final result of the balance (which is the best on the left chart) and all balances for each trading period separately.
The graphs will also be updated by highlighting the rows in the tables.

Final balances of results and improved balances after removing unprofitable intervals
Top 100 results tab
There are also two graphs here:
- On the left, there is a graph of the top 100 profit results.
- On the right, there is a graph of the top 100 results for the specified criterion: Profit, Trades, DD, RF, BI_Profit, BI_Trades, BI_DD and BI_RF.
Highlighting rows in tables will update the results in graphs. For example, below we can see, which result is highlighted on the left (black balance curve) and what the result is after excluding losing series of trades on the right graph.
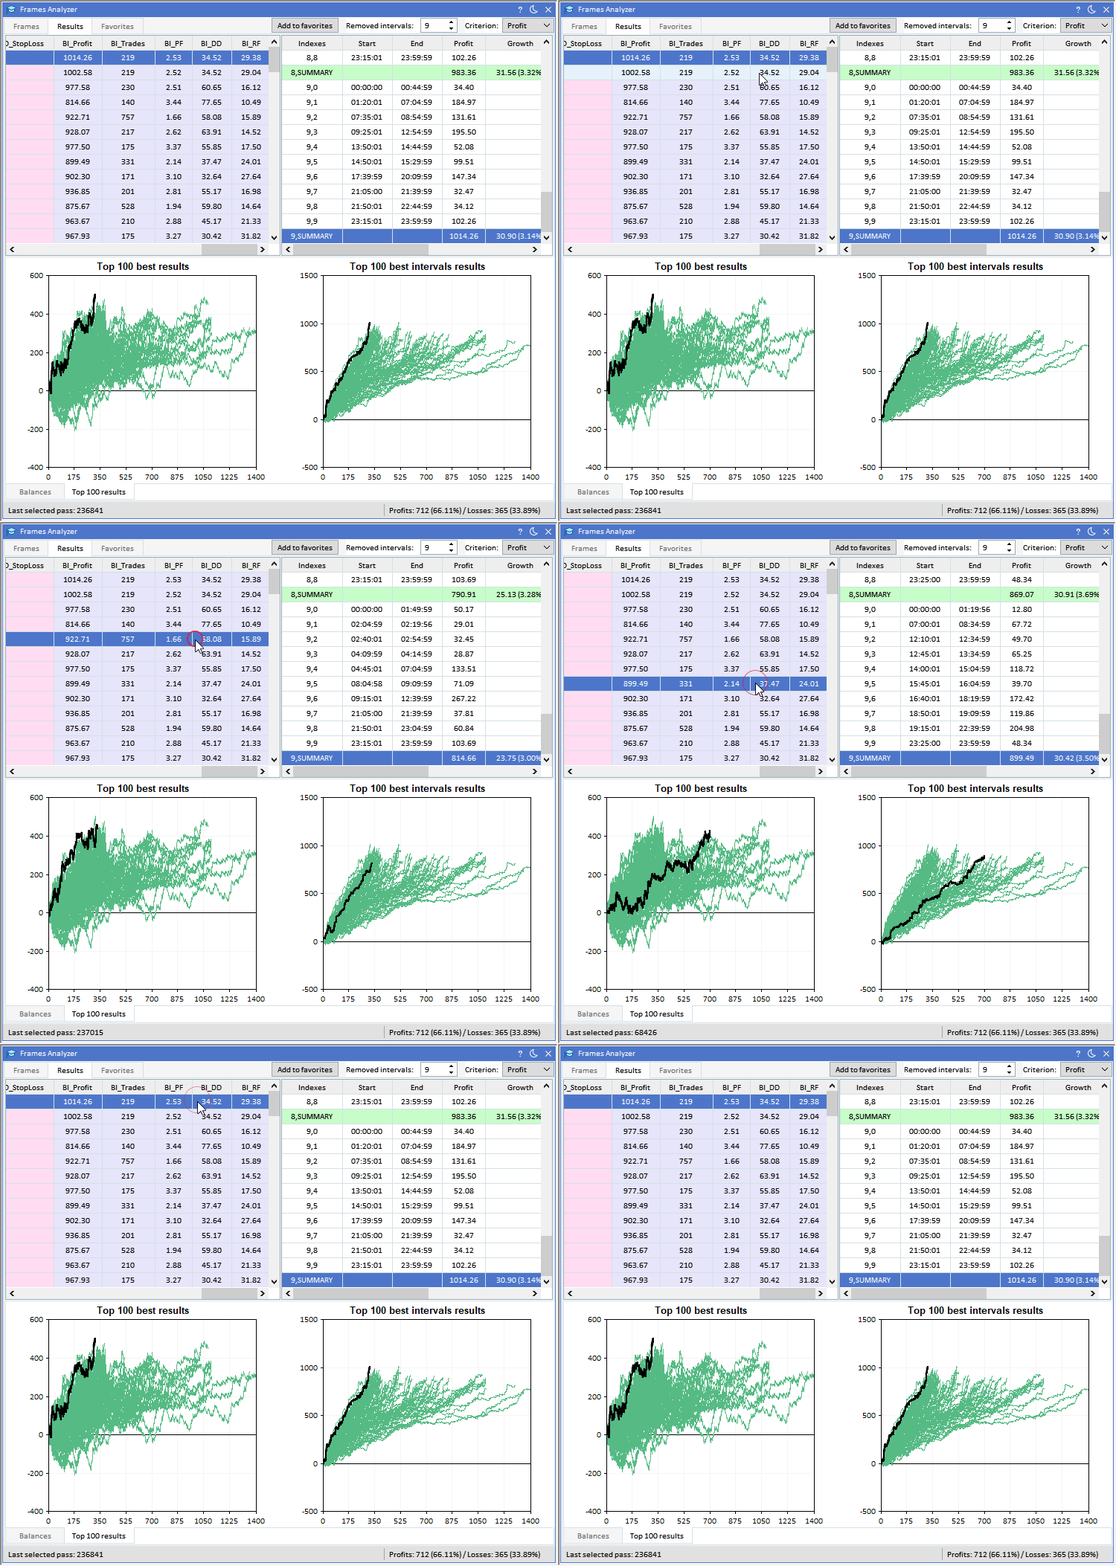
100 best final and improved balances after removing unprofitable intervals
We can also specify the number of unprofitable intervals to be removed from the history to improve the result.
It is assumed that by continuing to trade with these EA parameters, while excluding the time intervals where unprofitable series of trades were detected, traders can significantly improve their trading results. In fact, even a seemingly unprofitable trading algorithm may sometimes turn out to be profitable with this approach.
As mentioned above, you can save your favorite results to the appropriate table. To do this, use the Add to favorites button. Added results are highlighted in a different color in the overall results table.
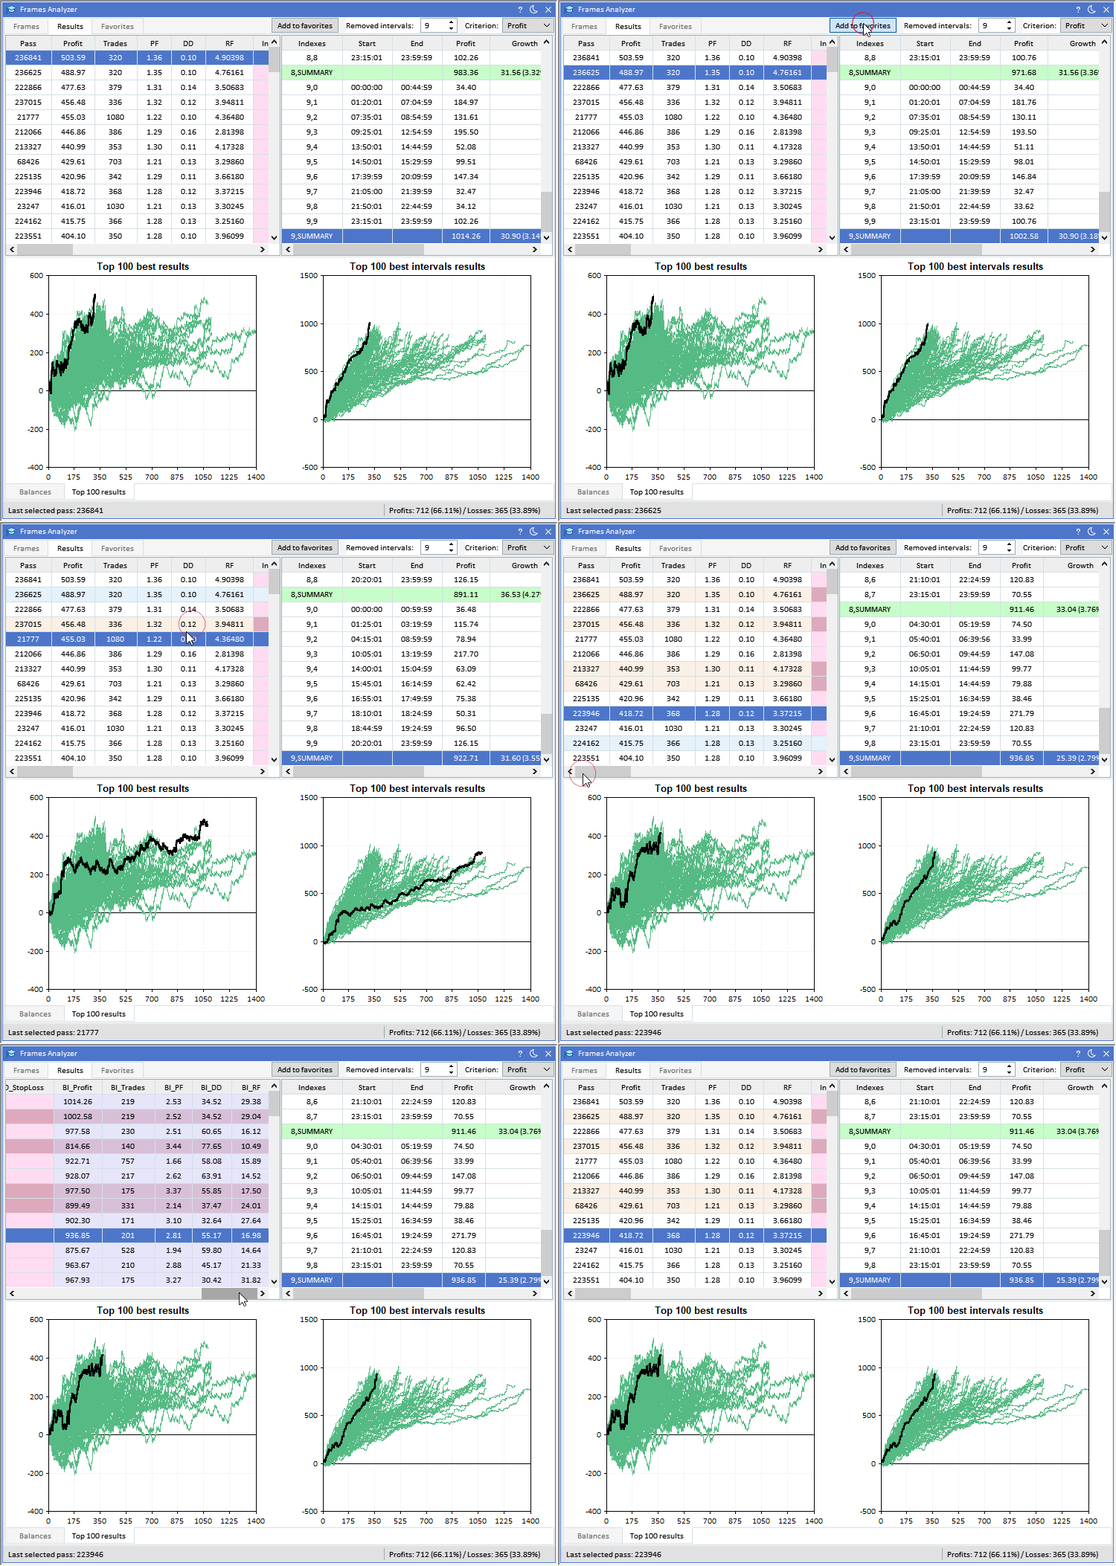
Results added to favorites are highlighted in a different color
Favorites tab
This tab also has two tables and two graphs. The idea behind all the parameters is the same as in the Results tab. The only difference is that these selected results can be saved to files (EA sets) and to the database. Here, in addition to tables and graphs, the following buttons are located in the upper part of the window:
- Delete selected - delete a selected result from favorites in the table on the left, as well as from the database.
- Delete all - delete all results from favorites in the table on the left, as well as from the database.
- Save parameters - save parameters to the file and the database.
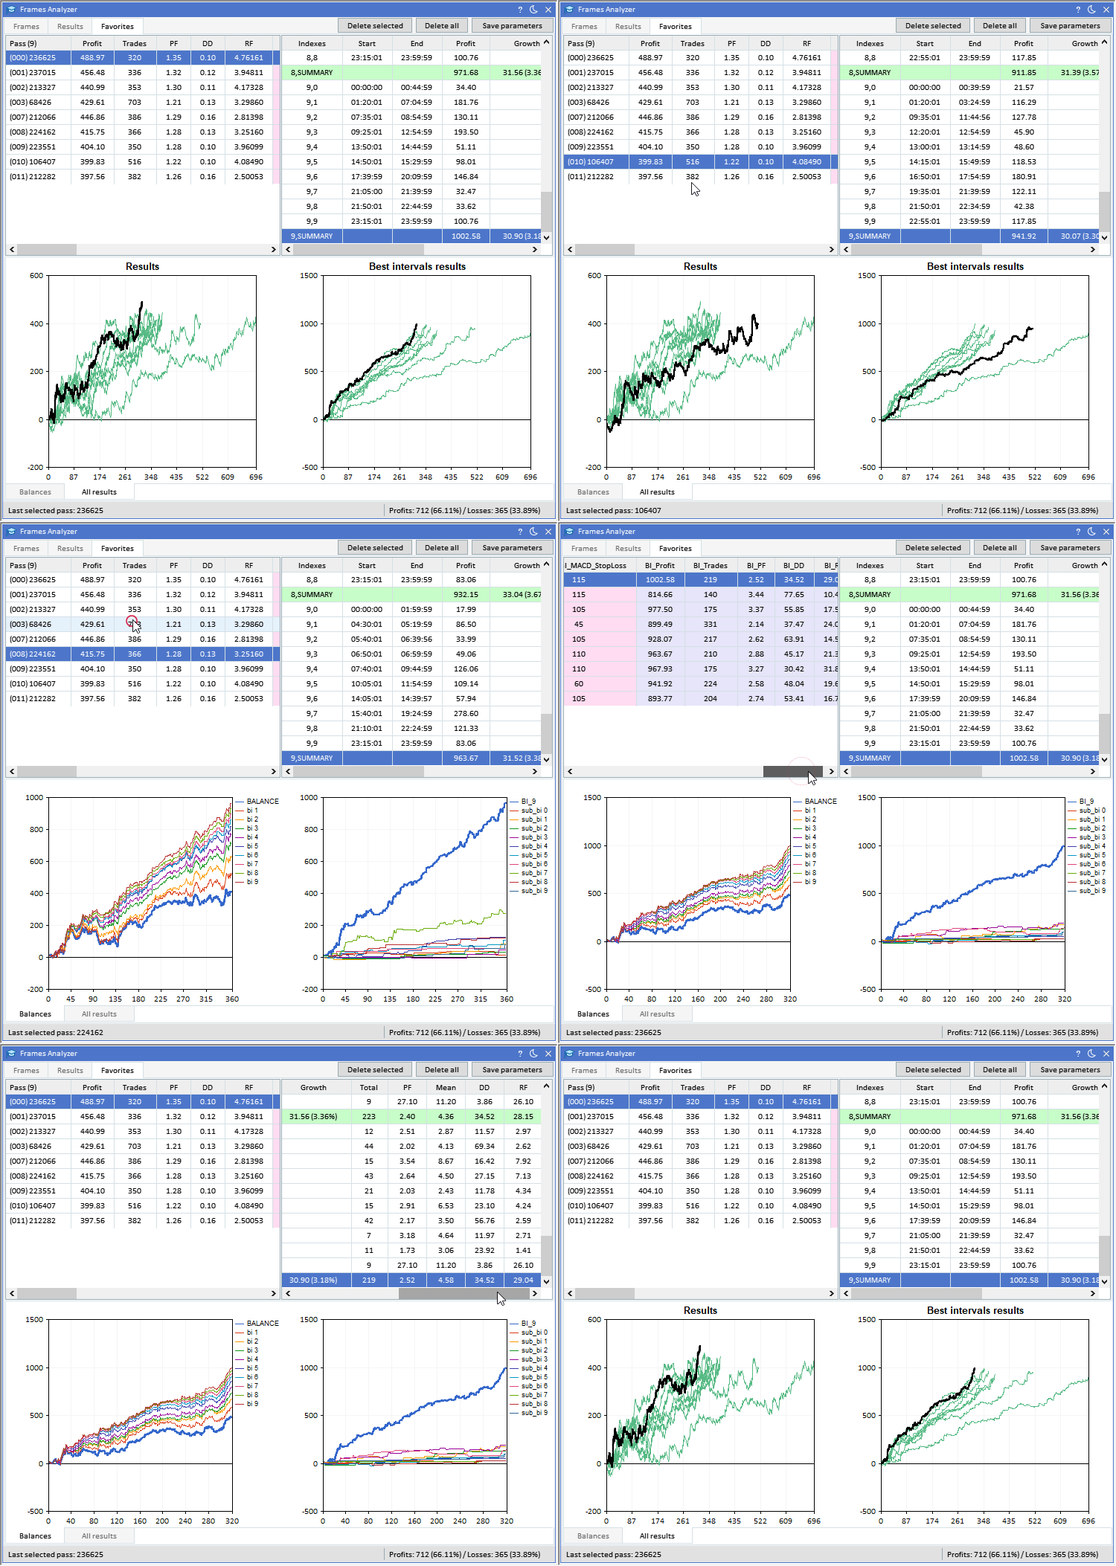
Data and graphs of selected results
Click Save parameters to save all selected results as favorites:
- to the database in the FAVORITE_RESULTS table
- to the files in MQL5/Files/Reports/FramesA/[CURRENT_TIME] in case of MQD file reading mode
- MQL5/Files/Reports/[CURRENT_TIME] [EXPERT_NAME] in case of FRAME_MODE (immediately after optimization)
All results are saved to separate folders where the pass number is used as the folder name. This will be a set file with external EA parameters and several screenshots of the tables and charts discussed above. The pass number is used as a prefix in the name of all files:
- 422462.set - set file with external EA parameters.
- 422462_balance_sub_bi.png - balance screenshot after excluding all time intervals with unprofitable series of trades, as well as all balances separately for each remaining time interval.
- 422462_balances_bi.png - screenshot of all balances after excluding all time intervals with unprofitable series of trades.
- 422462_bi_table.png - screenshot of the table with all the final results after excluding all time intervals with unprofitable series of trades.
- 422462_gui.png - full GUI screenshot.
A sample set file with the EA parameters:
; this file contains last used input parameters for testing/optimizing FA expert advisor
; Experts\Advisors\ExpertMACD.ex5
;
Inp_Expert_Title=ExpertMACD||0.0||0.0||0.0||N
Inp_Signal_MACD_PeriodFast=15||5.0||5.0||30.0||Y
Inp_Signal_MACD_PeriodSlow=25||5.0||5.0||30.0||Y
Inp_Signal_MACD_PeriodSignal=25||5.0||5.0||30.0||Y
Inp_Signal_MACD_TakeProfit=270||30.0||5.0||300.0||Y
Inp_Signal_MACD_StopLoss=115||20.0||5.0||200.0||Y
Database of optimization results
As mentioned above, Frames Analyzer saves all optimization results to the database immediately after optimizing the parameters in the tester. But that is not all! After each optimization of parameters, a new database is created in the local directory of the terminal MQL5/Files/DB. The name of the database consists of the current time at the moment of creation and the name of the EA: [CURRENT_TIME] [EXPERT_NAME].db.
There are three tables in total:
The OPTIMIZATION_RESULTS table is to store the following data (columns):
- Pass - pass index.
- Profit - obtained profit.
- Trades - number of trades.
- PF - profit factor.
- DD - drawdown.
- RF - recovery factor.
- Columns with all EA external parameters:
- Parameter 1
- Parameter 2
- etc
- Deals - history of trades used to calculate the balances for each pass.

Table with data on all optimization passes
EXPERT_PARAMETERS table. The table contains the EA external parameters, as well as its name and path to the directory where it was located during parameter optimization. The table has two columns:
- Parameter - parameter name
- Value - parameter value.
Below is a sample ExpertMACD EA from the standard delivery of the terminal. In case of external parameters (INPUT_n), the Value column saves the name of the external parameter and optimization parameters (separated by ||) used for this optimization.

EA data table
Some other parameters necessary for the EA operation can later be added to the table.
FAVORITE_RESULTS table. Optimization results selected as favorites are saved here. There are only three columns here:
- FavoriteID - position ID.
- Pass - index of the pass, for which we want to get all the data in the OPTIMIZATION_RESULTS table.
- RemovedIntervals - removed intervals when real trading is supposed to be disabled.

Table of selected optimization results with removed time intervals
Thus, we can get everything we need from the database after optimization and analysis of the results obtained for the EA operation in the future.
How to use the Frames Analyzer tool?
First, download Frames Analyzer on this page. If you now run this EA in your terminal, you will see that all Frames Analyzer graphs and tables are empty because this tool needs optimization results. If you want to try it out, download the database file with optimization results attached below. Place this file to MQL5/Files/DB. Now you can download it through the graphical interface of the Frames Analyzer EA. On Frames tab, click Open DB. The dialog box will open allowing you to select the database file as shown below. I already have several database files in this directory.

Selecting a database file in the dialog box
In order for Frames Analyzer to save optimization results of your EA, you need to include it as a library in your EA code. Below is a detailed example.
After downloading Frames Analyzer to your computer, you can find it in MQL5/Experts/Market. Then you can include it to the main file (*.mq5) of your EA the following way:
#import "..\Experts\Market\FramesA.ex5"
  void OnEvent(const int id, const long &lparam, const double &dparam, const string &sparam);
  void OnTesterEvent(void);
  void OnTesterInitEvent(void);
  void OnTesterPassEvent(void);
  void OnTesterDeinitEvent(void);
#import
As we can see above, we need to import several functions from the Frames Analyzer EA. They are needed to handle events in the GUI operation, as well as to collect data during the optimization of the EA parameters in the tester. All you have to do is call these functions in similar EA functions, as shown below:
//+------------------------------------------------------------------+
//| ChartEvent function                                              |
//+------------------------------------------------------------------+
void OnChartEvent(const int id, const long &lparam, const double &dparam, const string &sparam) {
  FramesA::OnEvent(id, lparam, dparam, sparam);
}
//+------------------------------------------------------------------+
//| Test completion event handler                                    |
//+------------------------------------------------------------------+
double OnTester(void) {
  FramesA::OnTesterEvent();
  return(0.0);
}
//+------------------------------------------------------------------+
//| TesterInit function                                              |
//+------------------------------------------------------------------+
void OnTesterInit(void) {
  FramesA::OnTesterInitEvent();
}
//+------------------------------------------------------------------+
//| TesterPass function                                              |
//+------------------------------------------------------------------+
void OnTesterPass(void) {
  FramesA::OnTesterPassEvent();
}
//+------------------------------------------------------------------+
//| TesterDeinit function                                            |
//+------------------------------------------------------------------+
void OnTesterDeinit(void) {
  FramesA::OnTesterDeinitEvent();
}
//+------------------------------------------------------------------+
As you can see, all is pretty simple.
By the way, if you use the EasyAndFastGUI v2.0 library in your projects to create graphical interfaces (the library is a part of Frames Analyzer), then nothing else needs to be done in order for them to work together in one MQL application. Frames Analyzer built into your EA works separately in frame mode (FRAME_MODE) and does not interfere with the operation of the graphical interface of your application.
Even if you do not have EasyAndFastGUI v2.0 library, Frames Analyzer will work anyway.
A sample ExpertMACD EA from standard delivery with the built-in Frames Analyzer module is attached below.
Applying removed intervals in Expert Advisors
So, you have the Frames Analyzer tool. You have connected it to your trading EA, performed parameter optimization, and now you have a database with the results of all passes with values of all external parameters. In a separate table, you saved your favorite optimization results with removed time intervals, which can now be applied to your trading strategy.
Let's look how this can be implemented.
Let's say you want to implement the selection of time trading ranges through the graphical user interface. It would be nice if there was an element in the graphical interface that visualizes removed time intervals, during which it is not recommended to trade. If you are a happy owner of the EasyAndFastGUI 2.0 library for creating advanced GUIs, then you already have such an opportunity. In one of the latest updates, another unique element was added - CTimeRanges. It allows you to work with time intervals. Next, we will create a GUI with this element and consider it in more detail.
The GUI will consist of the following elements:
- The form for controls - CWindow.
- The button for opening the database file - CButton.
- The drop-down list with pass indices from the table of selected optimization results - CComboBox.
- Time scale showing intervals not recommended for trading - CTimeRanges.
To create such a GUI, you need only a few lines of code:
void CApp::CreateGUI(void) {

//--- Form
  m_window1.ResizeMode(true);
  m_window1.ThemeButtonIsUsed(true);
  CCoreCreate::CreateWindow(m_window1, "TIME TRADE RANGES", 1, 1, 350, 100, true, true, true, true);

//--- Button
  CCoreCreate::CreateButton(m_button1, m_window1, 0, "Open DB...", 10, 30, 100);

//--- Combobox
  string items1[] = {"12345", "19876", "45678", "23456", "67890"};
  CCoreCreate::CreateCombobox(m_combobox1, m_window1, 0, "Passes: ", 120, 30, 135, 90, items1, 103, 0);

//--- Time ranges
  string time_ranges[] = {
    "00:45:00 - 01:20:01",
    "08:55:00 - 09:25:01",
    "12:55:00 - 13:50:01",
    "15:30:00 - 17:39:59",
    "20:10:00 - 21:05:00"
  };
  m_time_ranges1.SetTimeRanges(time_ranges);
  m_time_ranges1.AutoXResizeMode(true);
  m_time_ranges1.AutoXResizeRightOffset(5);
  CCoreCreate::CreateTimeRanges(m_time_ranges1, m_window1, 0, 5, 60, 390);
}
The example above shows how you can set time intervals to the TimeRanges element.
By launching an MQL application with such a graphical interface, you will see the following:
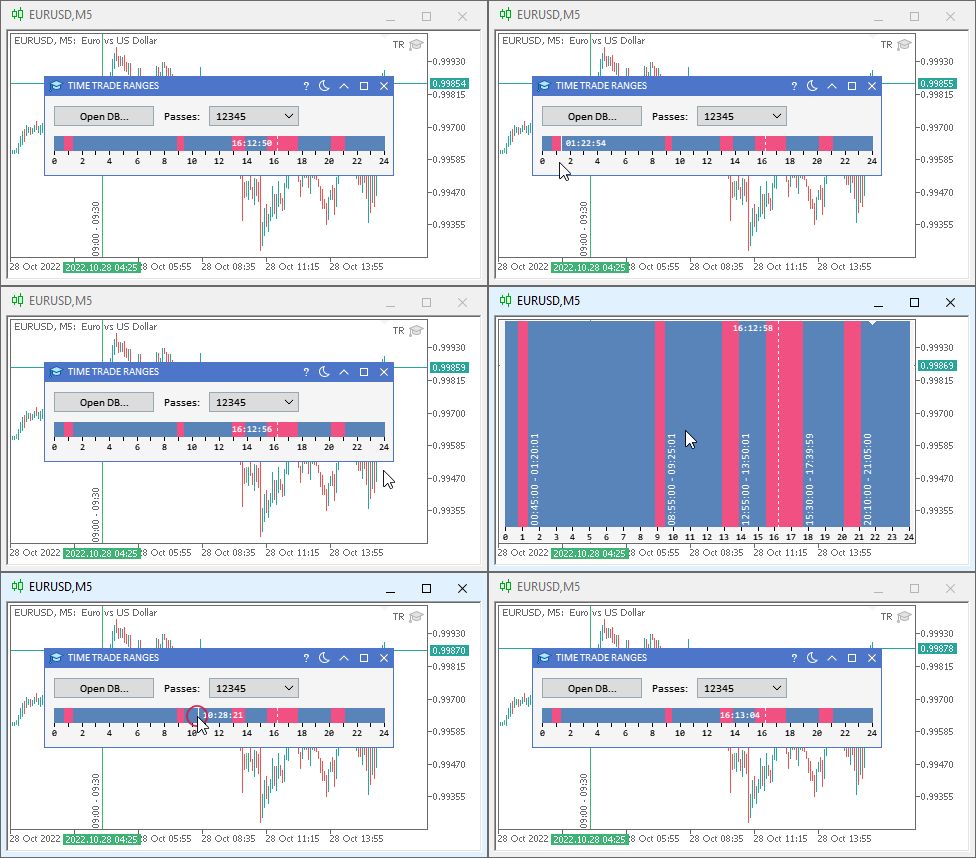
TimeRanges element from the EasyAndFastGUI v2.0 library
The screenshot above shows a GUI element that is an intraday time scale. This is a dynamic element that can automatically adjust to the width of the parent element (in this case, it is the form). The dash-dotted line marks the current time, near which a text label with the current time is shown. If the mouse cursor is hovered over the time scale, then a vertical solid line will be drawn under the mouse cursor with a text label of the time the cursor points to.
It has turned out quite informative, but that is not all! If we click on the scale, the element will generate a custom event with the ON_CLICK_TIME_RANGE ID, which can be processed in a custom MQL application. The dparam parameter will contain the number of seconds elapsed since the beginning of the day, while the sparam parameter will contain the removed time range or an empty string if none of the set ranges fell under the cursor during the click. In addition, you can enable the mode when the TimeRanges element can be expanded for the entire chart by a single click.
Here is the code that allows you to intercept and handle this event:
void CApp::OnEvent(const int id, const long &lparam, const double &dparam, const string &sparam) {

  if(id == CHARTEVENT_CUSTOM + ON_CLICK_TIME_RANGE) {

    if(m_time_ranges1.Id() == lparam) {
      Print(__FUNCTION__, " > pressed time: ", ::TimeToString((datetime)dparam, TIME_MINUTES|TIME_SECONDS), "; pressed time range: ", sparam);

      string time_ranges[];
      m_time_ranges1.GetTimeRanges(time_ranges);

      ArrayPrint(time_ranges);
      return;
    }
    return;
  }
}
As you can see in the code listing above, we first check the id of the event and if this is the ON_CLICK_TIME_RANGE user event, we check the element ID passed in the event lparam parameter. Next, the obtained data is sent to the log. The example also shows how to get the set intervals in the element using the CTimeRanges::GetTimeRanges() method and also display the obtained array to the journal.
In EA logs (Experts tab), you will see something like this:
CApp::OnEvent > pressed time: 16:34:54; pressed time range: 15:30:00 - 17:39:59
"00:45:00-01:20:01" "08:55:00-09:25:01" "12:55:00-13:50:01" "15:30:00-17:39:59" "20:10:00-21:05:00"
The following example shows how to get the array of pass indices from the favorite results table (FAVORITE_RESULTS) in the data base.
void CApp::GetPassNumbersOfFavoriteResults(const string db_filename, ulong &passes[]) {

  ::ResetLastError();
  uint flags = DATABASE_OPEN_READWRITE | DATABASE_OPEN_CREATE;
  int db_handle = ::DatabaseOpen(db_filename, flags);
  if(db_handle == INVALID_HANDLE) {
    ::Print(__FUNCTION__, " > DB: ", db_filename, " open failed with code: ", ::GetLastError());
    return;
  }

  string command = "SELECT (Pass) FROM FAVORITE_RESULTS;";

  int db_query = ::DatabasePrepare(db_handle, command);
  if(db_query == INVALID_HANDLE) {
    ::Print(__FUNCTION__, " > DB: ", db_filename, " request failed with code ", ::GetLastError());
    ::DatabaseClose(db_handle);
    return;
  }

  for(int i = 0; ::DatabaseRead(db_query); i++) {
    int pass_number;
    ::ResetLastError();
    if(::DatabaseColumnInteger(db_query, 0, pass_number)) {
      int prev_size = ::ArraySize(passes);
      ::ArrayResize(passes, prev_size + 1);
      passes[prev_size] = (ulong)pass_number;
    }
    else {
      ::Print(__FUNCTION__, " > DatabaseColumnInteger() error: ", ::GetLastError());
    }
  }
//--- Finish working with the database
  ::DatabaseFinalize(db_query);
  ::DatabaseClose(db_handle);
}
After we received the pass indices, we can get the removed intervals by specifying the pass index using the GetFavoriteRemovedIntervalsByPassNumber() method:
string CApp::GetFavoriteRemovedIntervalsByPassNumber(const ulong pass_number) {

  ::ResetLastError();
  uint flags = DATABASE_OPEN_READWRITE | DATABASE_OPEN_CREATE;
  int db_handle = ::DatabaseOpen(m_db_filename, flags);
  if(db_handle == INVALID_HANDLE) {
    ::Print(__FUNCTION__, " > DB: ", m_db_filename, " open failed with code: ", ::GetLastError());
    return(NULL);
  }

  string command = "SELECT (RemovedIntervals) FROM FAVORITE_RESULTS WHERE Pass=" + (string)pass_number + ";";

  int db_query = ::DatabasePrepare(db_handle, command);
  if(db_query == INVALID_HANDLE) {
    ::Print(__FUNCTION__, " > DB: ", m_db_filename, " request failed with code ", ::GetLastError());
    ::DatabaseClose(db_handle);
    return(NULL);
  }

  string time_ranges = "";

  if(::DatabaseRead(db_query)) {
    ::ResetLastError();
    if(!::DatabaseColumnText(db_query, 0, time_ranges)) {
      ::Print(__FUNCTION__, " > DatabaseColumnText() error: ", ::GetLastError());
    }
  }
//--- Finish working with the database
  ::DatabaseFinalize(db_query);
  ::DatabaseClose(db_handle);

  return(time_ranges);
}
When clicking Open DB... to open a file with a database, the OnClickOpenDB() is called. This is the method, in which the program open the dialog window to select a file in MQL5/Files/DB. If the file is selected, then it is saved for further use in other methods. Next, we use the GetPassNumbersOfFavoriteResults() method, whose code was shown in the previous listing, get the indices of passes from the table of favorite results. Add this data to the drop-down list and select the first item.
bool CApp::OnClickOpenDB(const int id) {

  if(m_button1.Id() != id) {
    return(false);
  }

  string filenames[];
  string folder = "DB";
  string filter = "DB files (*.db)|*.db|SQLite files (*.sqlite)|*.sqlite|All files (*.*)|*.*";
  if(::FileSelectDialog("Select database file to upload", folder, filter,
                        FSD_FILE_MUST_EXIST, filenames) > 0) {

    int filenames_total = ::ArraySize(filenames);
    if(filenames_total < 1) {
      return(false);
    }

    m_db_filename = filenames[0];

    ::Print(__FUNCTION__, " > m_db_filename: ", m_db_filename);

    ulong passes[];
    GetPassNumbersOfFavoriteResults(m_db_filename, passes);

    ::ArrayPrint(passes);

    CListView *list_view = m_combobox1.GetListViewPointer();

    int passes_total = ::ArraySize(passes);
    if(passes_total > 0) {
      list_view.Clear();
      for(int i = 0; i < passes_total; i++) {
        list_view.AddItem(i, (string)passes[i]);
      }
      m_combobox1.SelectItem(0);
      m_combobox1.GetButtonPointer().Update(true);
      list_view.Update(true);
    }
  }
  return(true);
}
By selecting the pass index in the drop-down list, we will get the removed intervals in the SetTimeRange() method saving them in the global array and setting them in the CTimeRanges type graphical element.
void CApp::SetTimeRange(void) {

  CListView *list_view = m_combobox1.GetListViewPointer();

  int   index       = list_view.SelectedItemIndex();
  ulong pass_number = (int)list_view.GetValue(index);

  string removed_intervals = GetFavoriteRemovedIntervalsByPassNumber(pass_number);

  ::ArrayFree(m_time_ranges_str);
  ::StringSplit(removed_intervals, ::StringGetCharacter("|", 0), m_time_ranges_str);

  int ranges_total = ::ArraySize(m_time_ranges_str);
  for(int i = 0; i < ranges_total; i++) {
    ::StringReplace(m_time_ranges_str[i], " - ", "-");
  }

  ::ArrayPrint(m_time_ranges_str);

  m_time_ranges1.SetTimeRanges(m_time_ranges_str);
  m_time_ranges1.Update();
}
Next, we will need a structure to store time ranges. If you use the EasyAndFastGUI 2.0 library, then such a structure (TimeRange) is already present in the CTimeRanges element file:
struct TimeRange {
  MqlDateTime start;
  MqlDateTime end;
};
If you do not use this graphic library, then you can declare such a structure in your code separately.
Since the removed time ranges are already saved in string form in the SetTimeRange() method, now we need to set them into the array of structures for more convenience. To do this, use the GetTimeRanges() method:
void CApp::GetTimeRanges(TimeRange &ranges[]) {

  ::ArrayFree(ranges);

  int ranges_total = ::ArraySize(m_time_ranges_str);
  for(int i = 0; i < ranges_total; i++) {

    string tr[];
    ::StringSplit(m_time_ranges_str[i], ::StringGetCharacter("-", 0), tr);

    int size = ::ArraySize(ranges);
    ::ArrayResize(ranges, size + 1);

    MqlDateTime start, end;
    ::TimeToStruct(::StringToTime(tr[0]), start);
    ::TimeToStruct(::StringToTime(tr[1]), end);

    datetime time1 = HourSeconds(start.hour) + MinuteSeconds(start.min) + start.sec;
    datetime time2 = HourSeconds(end.hour) + MinuteSeconds(end.min) + end.sec;
    ::TimeToStruct(time1, ranges[size].start);
    ::TimeToStruct(time2, ranges[size].end);
  }
}
For example, these methods can be used the following way when handling the corresponding events (a shortened version of the application class):
class CApp : public CCoreCreate {
 private:
  TimeRange         m_time_ranges[];
  string            m_time_ranges_str[];

...

  virtual void      OnEvent(const int id, const long &lparam, const double &dparam, const string &sparam);

  void              SetTimeRange(void);
  void              GetTimeRanges(TimeRange &ranges[]);

  int               HourSeconds(const int hour)     { return(hour * 60 * 60); }
  int               MinuteSeconds(const int minute) { return(minute * 60);    }
};

void CApp::OnEvent(const int id, const long &lparam, const double &dparam, const string &sparam) {

  if(id == CHARTEVENT_CUSTOM + ON_CLICK_BUTTON) {
    if(OnClickOpenDB((int)lparam)) {
      SetTimeRange();
      GetTimeRanges(m_time_ranges);
      return;
    }
    return;
  }

  if(id == CHARTEVENT_CUSTOM + ON_CLICK_COMBOBOX_ITEM) {
    if(OnSelectPass((int)lparam)) {
      SetTimeRange();
      GetTimeRanges(m_time_ranges);
      return;
    }
    return;
  }
}
Now we can implement the CheckTradeTime() method to check if trading is performed at allowed time:
bool CApp::CheckTradeTime(void) {

  bool     is_trade_time = true;
  datetime current_time  = ::TimeCurrent();

  MqlDateTime time;
  ::TimeToStruct(current_time, time);

  int ranges_total = ::ArraySize(m_time_ranges);
  for(int i = 0; i < ranges_total; i++) {

    MqlDateTime start = m_time_ranges[i].start;
    MqlDateTime end   = m_time_ranges[i].end;

    datetime time_c = HourSeconds(time.hour) + MinuteSeconds(time.min) + time.sec;
    datetime time_s = HourSeconds(start.hour) + MinuteSeconds(start.min) + start.sec;
    datetime time_e = HourSeconds(end.hour) + MinuteSeconds(end.min) + end.sec;

    if(time_c >= time_s && time_c <= time_e) {
      is_trade_time = false;
      break;
    }
  }
  return(is_trade_time);
}
All you have to do now is set up the call of the CheckTradeTime() method, for example, in the OnTick() function:
  if(CheckTradeTime()) {
    Print(__FUNCTION__, " > trade time!");
  }
The ready-made application is attached at the end of the article.
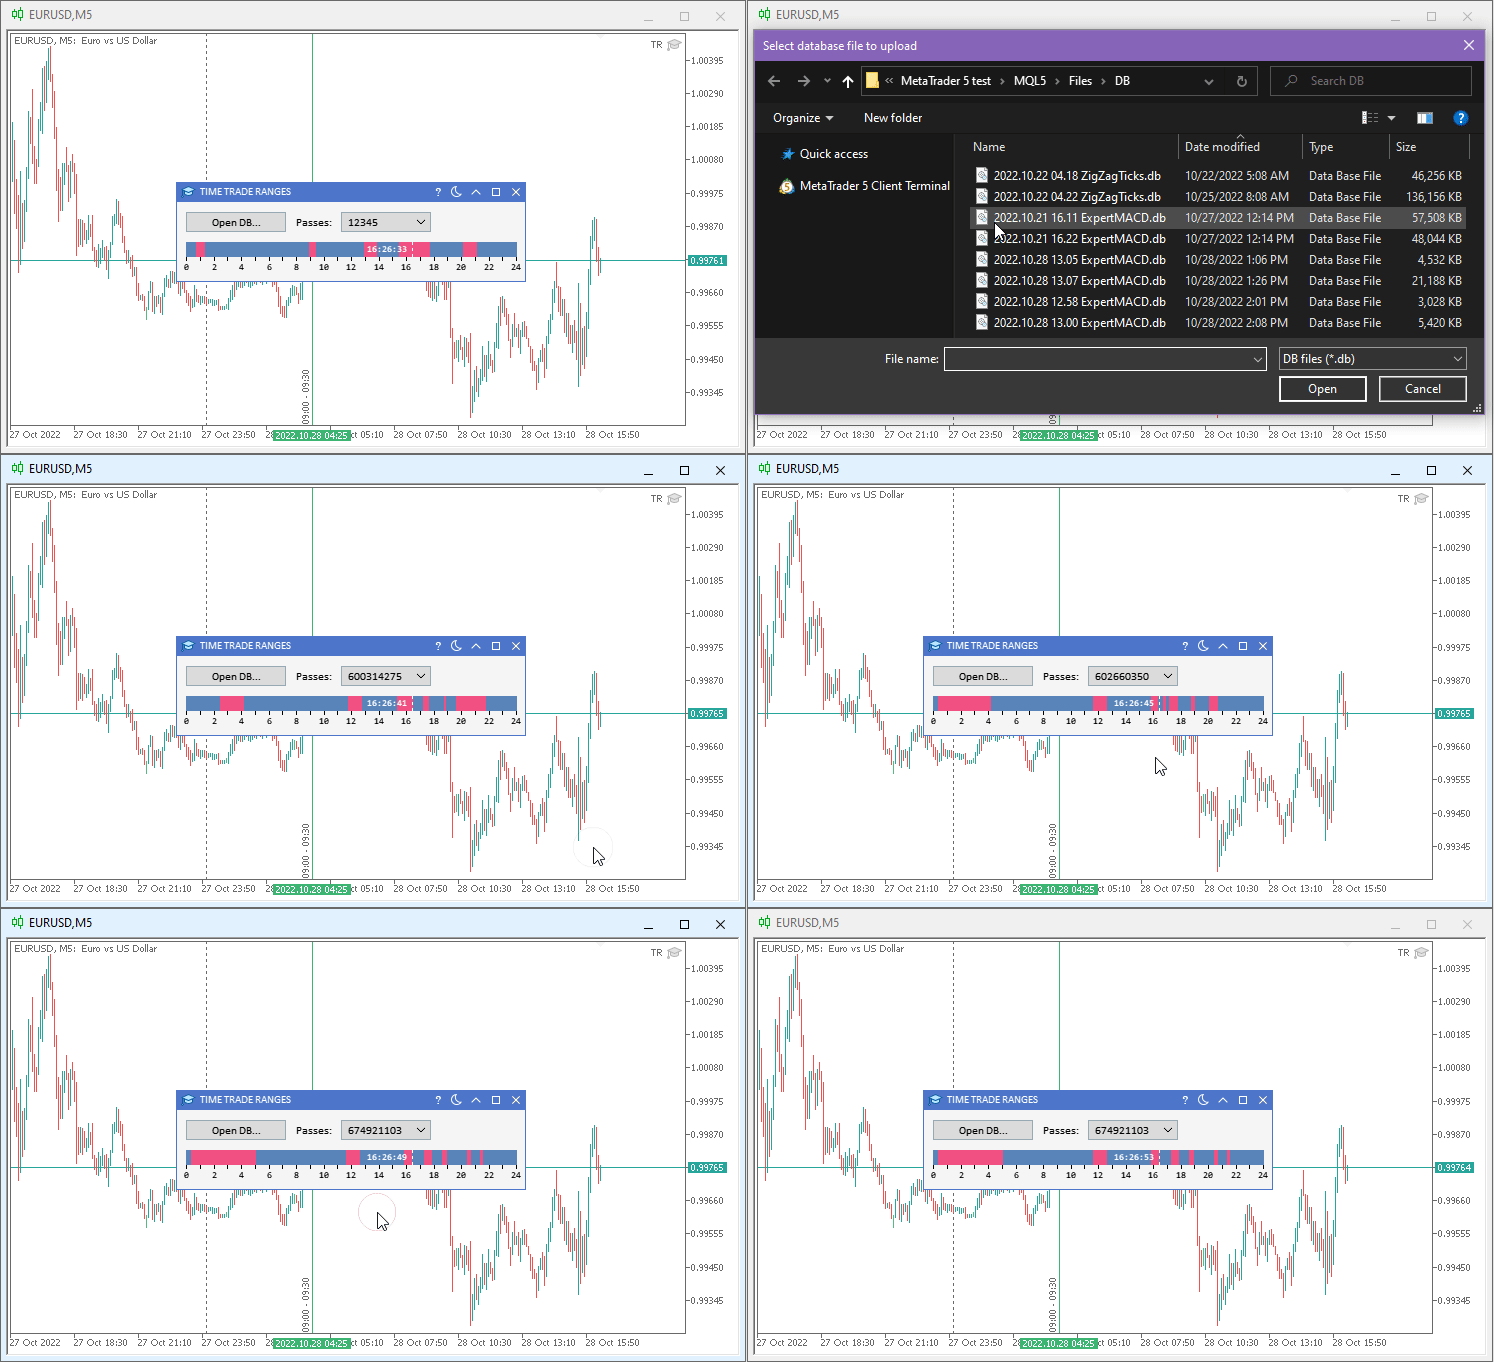
Receiving time intervals removed from trading
Conclusion
After optimizing the parameters in the strategy tester, we have to run single tests to view each result. This is very time-consuming and inefficient.
What is Frames Analyzer? This is a plug-in module for any Expert Advisor for analyzing optimization frames during parameter optimization in the strategy tester, as well as outside the tester, by reading an MQD file or a database that is created immediately after parameter optimization. You will be able to share these optimization results with other users who have Frames Analyzer to discuss the results.
Frames Analyzer allows you to view the top 100 optimization results simultaneously in the form of graphs. These top 100 results can be obtained by applying various criteria: Profit, Trades, Drawdown, Profit Factor and Recovery Factor. Moreover, the Frames Analyzer tool features the built-in Best Intervals module to determine unprofitable time intervals, which removes them from the history of trades allowing you to see what the result would have been if trading had not been conducted during these periods.
You can save the results you like to the database, as well as in the form of ready-made set files with EA external parameters. Deleted time intervals are also saved in the database. Thus, you can apply them in your trading to maximize your profit. Frames Analyzer leaves only the time intervals, which statistically proved to be the safest!
Translated from Russian by MetaQuotes Ltd.
Original article: https://www.mql5.com/ru/articles/11667
Warning: All rights to these materials are reserved by MetaQuotes Ltd. Copying or reprinting of these materials in whole or in part is prohibited.
This article was written by a user of the site and reflects their personal views. MetaQuotes Ltd is not responsible for the accuracy of the information presented, nor for any consequences resulting from the use of the solutions, strategies or recommendations described.
 Developing a trading Expert Advisor from scratch (Part 31): Towards the future (IV)
 Neural networks made easy (Part 31): Evolutionary algorithms
- Free trading apps
- Over 8,000 signals for copying
- Economic news for exploring financial markets
You agree to website policy and terms of use
An update(v3.1) has been published:
I was just reading through the series and this tool looks amazing. How come it has been taken down from the market place? Is there still anyway to access this?
Thanks!
I was just reading through the series and this tool looks amazing. How come it has been taken down from the market place? Is there still anyway to access this?
Thanks!
Thank you for your interest! I will discuss this with my colleagues and perhaps we will publish this tool again.
Thank you for your interest! I will discuss this with my colleagues and perhaps we will publish this tool again.
Let me know when there's an update for this amazing tool. I just downloaded the zip file, but I can't use it.
Thanks you!