
Population optimization algorithms: Bacterial Foraging Optimization (BFO)
E. coli bacterium foraging strategy inspired scientists to create the BFO optimization algorithm. The algorithm contains original ideas and promising approaches to optimization and is worthy of further study.
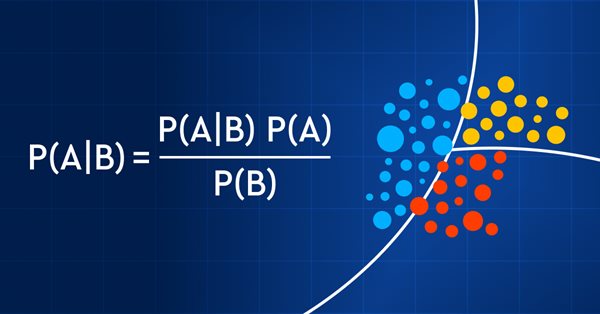
Data Science and Machine Learning (Part 11): Naïve Bayes, Probability theory in Trading
Trading with probability is like walking on a tightrope - it requires precision, balance, and a keen understanding of risk. In the world of trading, the probability is everything. It's the difference between success and failure, profit and loss. By leveraging the power of probability, traders can make informed decisions, manage risk effectively, and achieve their financial goals. So, whether you're a seasoned investor or a novice trader, understanding probability is the key to unlocking your trading potential. In this article, we'll explore the exciting world of trading with probability and show you how to take your trading game to the next level.

Learn how to design a trading system by Bill Williams' MFI
This is a new article in the series in which we learn how to design a trading system based on popular technical indicators. This time we will cover Bill Williams' Market Facilitation Index (BW MFI).

Category Theory in MQL5 (Part 3)
Category Theory is a diverse and expanding branch of Mathematics which as of yet is relatively uncovered in the MQL5 community. These series of articles look to introduce and examine some of its concepts with the overall goal of establishing an open library that provides insight while hopefully furthering the use of this remarkable field in Traders' strategy development.
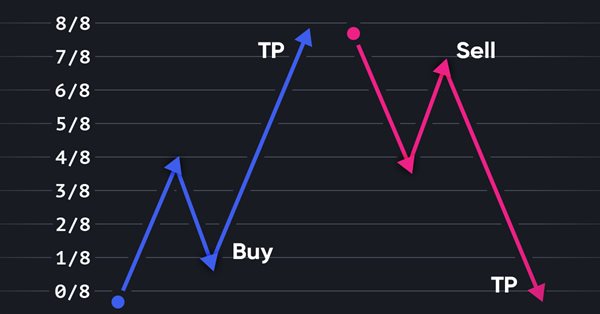
Revisiting Murray system
Graphical price analysis systems are deservedly popular among traders. In this article, I am going to describe the complete Murray system, including its famous levels, as well as some other useful techniques for assessing the current price position and making a trading decision.

Creating an EA that works automatically (Part 05): Manual triggers (II)
Today we'll see how to create an Expert Advisor that simply and safely works in automatic mode. At the end of the previous article, I suggested that it would be appropriate to allow manual use of the EA, at least for a while.

Creating an EA that works automatically (Part 04): Manual triggers (I)
Today we'll see how to create an Expert Advisor that simply and safely works in automatic mode.

Population optimization algorithms: Invasive Weed Optimization (IWO)
The amazing ability of weeds to survive in a wide variety of conditions has become the idea for a powerful optimization algorithm. IWO is one of the best algorithms among the previously reviewed ones.

Understand and efficiently use OpenCL API by recreating built-in support as DLL on Linux (Part 1): Motivation and validation
Bulit-in OpenCL support in MetaTrader 5 still has a major problem especially the one about device selection error 5114 resulting from unable to create an OpenCL context using CL_USE_GPU_ONLY, or CL_USE_GPU_DOUBLE_ONLY although it properly detects GPU. It works fine with directly using of ordinal number of GPU device we found in Journal tab, but that's still considered a bug, and users should not hard-code a device. We will solve it by recreating an OpenCL support as DLL with C++ on Linux. Along the journey, we will get to know OpenCL from concept to best practices in its API usage just enough for us to put into great use later when we deal with DLL implementation in C++ and consume it with MQL5.

Experiments with neural networks (Part 3): Practical application
In this article series, I use experimentation and non-standard approaches to develop a profitable trading system and check whether neural networks can be of any help for traders. MetaTrader 5 is approached as a self-sufficient tool for using neural networks in trading.

Creating an EA that works automatically (Part 03): New functions
Today we'll see how to create an Expert Advisor that simply and safely works in automatic mode. In the previous article, we started to develop an order system that we will use in our automated EA. However, we have created only one of the necessary functions.

Population optimization algorithms: Bat algorithm (BA)
In this article, I will consider the Bat Algorithm (BA), which shows good convergence on smooth functions.

Creating an EA that works automatically (Part 02): Getting started with the code
Today we'll see how to create an Expert Advisor that simply and safely works in automatic mode. In the previous article, we discussed the first steps that anyone needs to understand before proceeding to creating an Expert Advisor that trades automatically. We considered the concepts and the structure.

Creating an EA that works automatically (Part 01): Concepts and structures
Today we'll see how to create an Expert Advisor that simply and safely works in automatic mode.

How to choose an Expert Advisor: Twenty strong criteria to reject a trading bot
This article tries to answer the question: how can we choose the right expert advisors? Which are the best for our portfolio, and how can we filter the large trading bots list available on the market? This article will present twenty clear and strong criteria to reject an expert advisor. Each criterion will be presented and well explained to help you make a more sustained decision and build a more profitable expert advisor collection for your profits.

DoEasy. Controls (Part 31): Scrolling the contents of the ScrollBar control
In this article, I will implement the functionality of scrolling the contents of the container using the buttons of the horizontal scrollbar.
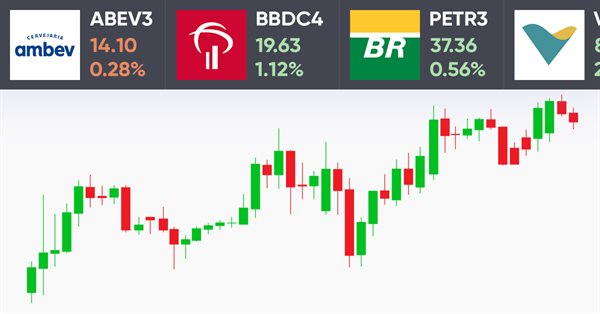
Creating a ticker tape panel: Improved version
How do you like the idea of reviving the basic version of our ticker tape panel? The first thing we will do is change the panel to be able to add an image, such as an asset logo or some other image, so that the user could quickly and easily identify the displayed symbol.
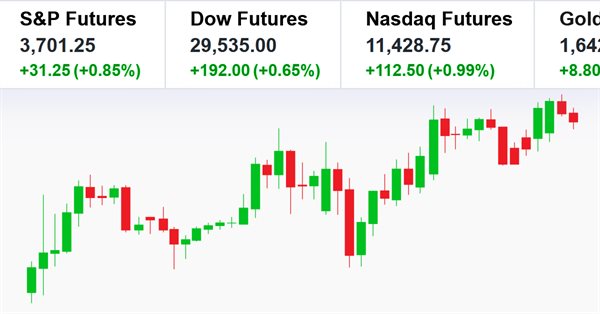
Creating a ticker tape panel: Basic version
Here I will show how to create screens with price tickers which are usually used to display quotes on the exchange. I will do it by only using MQL5, without using complex external programming.

Population optimization algorithms: Firefly Algorithm (FA)
In this article, I will consider the Firefly Algorithm (FA) optimization method. Thanks to the modification, the algorithm has turned from an outsider into a real rating table leader.

DoEasy. Controls (Part 30): Animating the ScrollBar control
In this article, I will continue the development of the ScrollBar control and start implementing the mouse interaction functionality. In addition, I will expand the lists of mouse state flags and events.

Measuring Indicator Information
Machine learning has become a popular method for strategy development. Whilst there has been more emphasis on maximizing profitability and prediction accuracy , the importance of processing the data used to build predictive models has not received a lot of attention. In this article we consider using the concept of entropy to evaluate the appropriateness of indicators to be used in predictive model building as documented in the book Testing and Tuning Market Trading Systems by Timothy Masters.

Matrix Utils, Extending the Matrices and Vector Standard Library Functionality
Matrix serves as the foundation of machine learning algorithms and computers in general because of their ability to effectively handle large mathematical operations, The Standard library has everything one needs but let's see how we can extend it by introducing several functions in the utils file, that are not yet available in the library

Population optimization algorithms: Fish School Search (FSS)
Fish School Search (FSS) is a new optimization algorithm inspired by the behavior of fish in a school, most of which (up to 80%) swim in an organized community of relatives. It has been proven that fish aggregations play an important role in the efficiency of foraging and protection from predators.

DoEasy. Controls (Part 29): ScrollBar auxiliary control
In this article, I will start developing the ScrollBar auxiliary control element and its derivative objects — vertical and horizontal scrollbars. A scrollbar is used to scroll the content of the form if it goes beyond the container. Scrollbars are usually located at the bottom and to the right of the form. The horizontal one at the bottom scrolls content left and right, while the vertical one scrolls up and down.

Category Theory in MQL5 (Part 2)
Category Theory is a diverse and expanding branch of Mathematics which as of yet is relatively uncovered in the MQL5 community. These series of articles look to introduce and examine some of its concepts with the overall goal of establishing an open library that attracts comments and discussion while hopefully furthering the use of this remarkable field in Traders' strategy development.

Develop a Proof-of-Concept DLL with C++ multi-threading support for MetaTrader 5 on Linux
We will begin the journey to explore the steps and workflow on how to base development for MetaTrader 5 platform solely on Linux system in which the final product works seamlessly on both Windows and Linux system. We will get to know Wine, and Mingw; both are the essential tools to make cross-platform development works. Especially Mingw for its threading implementations (POSIX, and Win32) that we need to consider in choosing which one to go with. We then build a proof-of-concept DLL and consume it in MQL5 code, finally compare the performance of both threading implementations. All for your foundation to expand further on your own. You should be comfortable building MT related tools on Linux after reading this article.

MQL5 Cookbook — Services
The article describes the versatile capabilities of services — MQL5 programs that do not require binding graphs. I will also highlight the differences of services from other MQL5 programs and emphasize the nuances of the developer's work with services. As examples, the reader is offered various tasks covering a wide range of functionality that can be implemented as a service.

Population optimization algorithms: Cuckoo Optimization Algorithm (COA)
The next algorithm I will consider is cuckoo search optimization using Levy flights. This is one of the latest optimization algorithms and a new leader in the leaderboard.
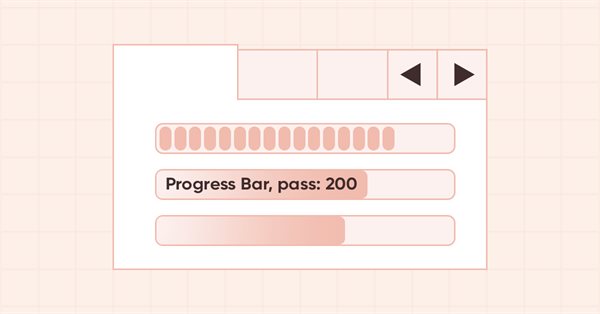
DoEasy. Controls (Part 28): Bar styles in the ProgressBar control
In this article, I will develop display styles and description text for the progress bar of the ProgressBar control.
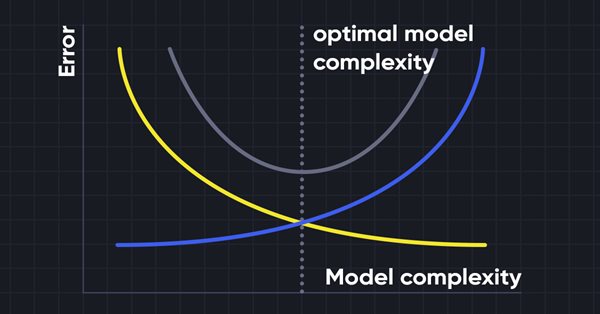
Data Science and Machine Learning (Part 10): Ridge Regression
Ridge regression is a simple technique to reduce model complexity and prevent over-fitting which may result from simple linear regression

Population optimization algorithms: Grey Wolf Optimizer (GWO)
Let's consider one of the newest modern optimization algorithms - Grey Wolf Optimization. The original behavior on test functions makes this algorithm one of the most interesting among the ones considered earlier. This is one of the top algorithms for use in training neural networks, smooth functions with many variables.

Population optimization algorithms: Artificial Bee Colony (ABC)
In this article, we will study the algorithm of an artificial bee colony and supplement our knowledge with new principles of studying functional spaces. In this article, I will showcase my interpretation of the classic version of the algorithm.
Non-linear indicators
In this article, I will make an attempt to consider some ways of building non-linear indicators and their use in trading. There are quite a few indicators in the MetaTrader trading platform that use non-linear approaches.

DoEasy. Controls (Part 27): Working on ProgressBar WinForms object
In this article, I will continue the development of the ProgressBar control. In particular, I will create the functionality for managing the progress bar and visual effects.
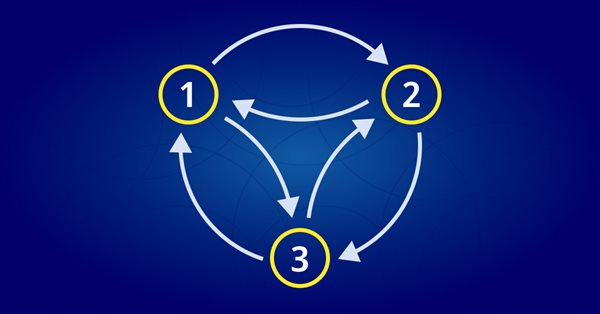
MQL5 Wizard techniques you should know (Part 05): Markov Chains
Markov chains are a powerful mathematical tool that can be used to model and forecast time series data in various fields, including finance. In financial time series modelling and forecasting, Markov chains are often used to model the evolution of financial assets over time, such as stock prices or exchange rates. One of the main advantages of Markov chain models is their simplicity and ease of use.
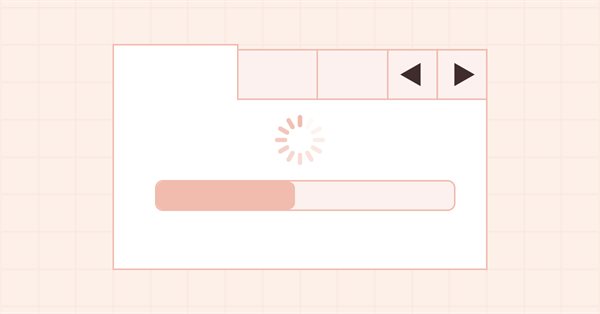
DoEasy. Controls (Part 26): Finalizing the ToolTip WinForms object and moving on to ProgressBar development
In this article, I will complete the development of the ToolTip control and start the development of the ProgressBar WinForms object. While working on objects, I will develop universal functionality for animating controls and their components.

Learn how to design a trading system by Gator Oscillator
A new article in our series about learning how to design a trading system based on popular technical indicators will be about the Gator Oscillator technical indicator and how to create a trading system through simple strategies.

Neural networks made easy (Part 32): Distributed Q-Learning
We got acquainted with the Q-learning method in one of the earlier articles within this series. This method averages rewards for each action. Two works were presented in 2017, which show greater success when studying the reward distribution function. Let's consider the possibility of using such technology to solve our problems.


Mountain or Iceberg charts
How do you like the idea of adding a new chart type to the MetaTrader 5 platform? Some people say it lacks a few things that other platforms offer. But the truth is, MetaTrader 5 is a very practical platform as it allows you to do things that can't be done (or at least can't be done easily) in many other platforms.

DoEasy. Controls (Part 25): Tooltip WinForms object
In this article, I will start developing the Tooltip control, as well as new graphical primitives for the library. Naturally, not every element has a tooltip, but every graphical object has the ability to set it.