
Learn how to design a trading system by Fractals
Introduction
A new article with a new technical indicator in our series as we will learn how to design a trading system based on one of the most popular technical indicators that's the Fractals indicator. We will learn about it in detail through the following topics:
- Fractals definition
- Fractals strategy
- Fractals strategy blueprint
- Fractals trading system
- Conclusion
We will learn what it is, what it measures, and how we can calculate it manually to understand the main idea behind it. We will learn how to let it work in our favor through simple trading strategies based on the basic concept of the indicator. After that, we will create a trading system based on these strategies to be used in the MetaTrader 5 trading terminal to generate automatic signals.
We will use the MQL5 (MetaQuotes Language 5) which is built-in the IDE in the MetaTrader 5 trading terminal to write our codes. If you do not know how to download and use the MetaTrader 5 and MQL5, you can read the Writing MQL5 code in MetaEditor to learn more about this. By the way, I advise you to try to apply what you learn by yourself if you want to improve your coding skills.
You must test any mentioned strategy before using it in your real account because the main objective of this article is educational. In addition to that, there is nothing suitable for everyone. So, you must make sure that it is fit for your trading.
Fractals definition
The Fractals indicator is developed by Bill Williams. It was designed to try to anticipate the potential movements of the price action by giving bullish or bearish signals. The bullish signal gives a potential move to the upside but the bearish signal gives a potential move to the downside. We can say also that this indicator tries to anticipate highs and lows on the chart. We can see these signals by viewing generated arrows on the chart below and above prices.
It forms two different arrows, the upwards Fractals arrow, and the downward Fractals arrow. If you ask for the method of calculation of these two arrows to be formed, the following is the answer to this question:
The Fractals indicator needs a specific pattern of the price action to be formed on the chart in both directions up or down.
For the upward Fractals, on the price action we need the following:
- At least five consecutive candles or bars.
- Highest high in the middle candle (3rd one).
- Lower highs on each side of this high.
- After the fifth candle closes with the same previous conditions, the upwards Fractals arrow will be formed above the candle (3rd one).
For the downward Fractals, on the price action we need the following:
- At least five consecutive candles or bars.
- Lowest low in the middle candle (3rd one).
- higher lows on each side of this low.
- After the fifth candle closes with the same previous conditions, the downward Fractals arrow will be formed below the candle (3rd one).
Fortunately, we do not need to do these previous steps to draw the Fractals indicator on our chart because it is ready for us in the MetaTrader 5, all we need to choose the Fractals indicator from the available indicators. We can do that by opening the MetaTrader 5 terminal and pressing,
Insert --> Indicators --> Bill Williams --> Fractals
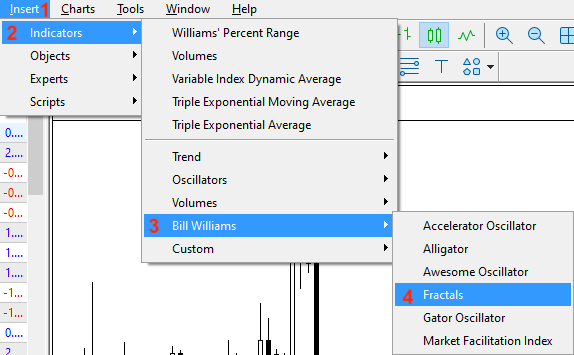
After choosing Fractals, we will find the following window of parameters of the indicator:
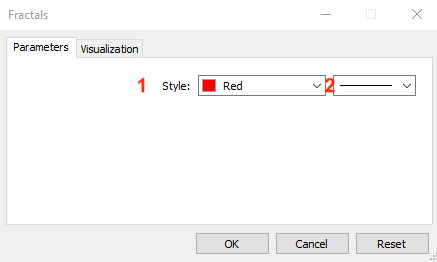
1- To determine the color of the arrows.
2- To determine the thickness.
After pressing OK, we will find the indicator inserted into the chart the same as the following:
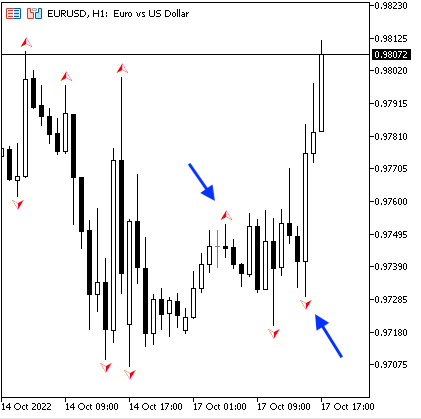
As we can see we have arrows above and below candles referring to the potential movement in the price action. We have downward arrows below candles that show potential upward movement and upward arrows above candles that show a potential downward movement.
Fractals strategy
We will learn how to use this Fractals indicator based on simple strategies based on the main concept of this technical indicator. We will use the Fractals indicator as a standalone then we will learn the concept of using it with other technical indicators to get more insights and enhance its signals.
Strategy one: Fractals highs and lows
According to this strategy, we need to get high and low signals based on the positions of the Fractals' highs and lows. If the indicator generated the lower arrow, it will be a low signal. If the Fractals generated the upper arrow, it will be a high signal.
Simply,
Lower arrow --> Fractals Low
Upper arrow --> Fractals High
Strategy two: Fractals with MA
According to this strategy, we need to get buy and sell signals based on the direction of the price action based on the position of the price and the moving average in addition to the generated Fractals indicator signals. If the closing price is above the moving average and the Fractals indicator generated a lower arrow, it will be a buy signal. If the closing price is below the moving average and the Fractals indicator generated the upper arrow, it will be a sell signal.
Simply,
The closing price > MA and Lower arrow generated --> buy signal
The closing price < MA and Higher arrow generated --> sell signal
Strategy three: Fractals with Alligator
According to this strategy, we need to get buy and sell signals based on the direction of the price action depending on its position with the Alligator indicator in addition to the generated Fractals indicator signals. If the lips line of the Alligator is above the teeth and the jaws, the teeth line is above the jaws, the closing price is above the teeth, and the Fractals indicator signal is a lower arrow, it will be a buy signal. In the other scenario, if the lips line is lower than the teeth and jaws, the teeth is lower than the jaws, the closing price is lower than the teeth, and the Fractals signal is an upper arrow, it will be a sell signal.
Simply,
The lips > the teeth and the jaws, the teeth > the jaws, the closing price > the teeth, and the Fractals signal is a lower arrow --> buy signal
The lips < the teeth and the jaws, the teeth < the jaws, the closing price < the teeth, and the Fractals signal is an upper arrow --> sell signal
Fractals strategy blueprint
We will design a step-by-step blueprint for each mentioned strategy to help us to create trading systems for them smoothly and easily by organizing our ideas.
1. Fractals highs and lows
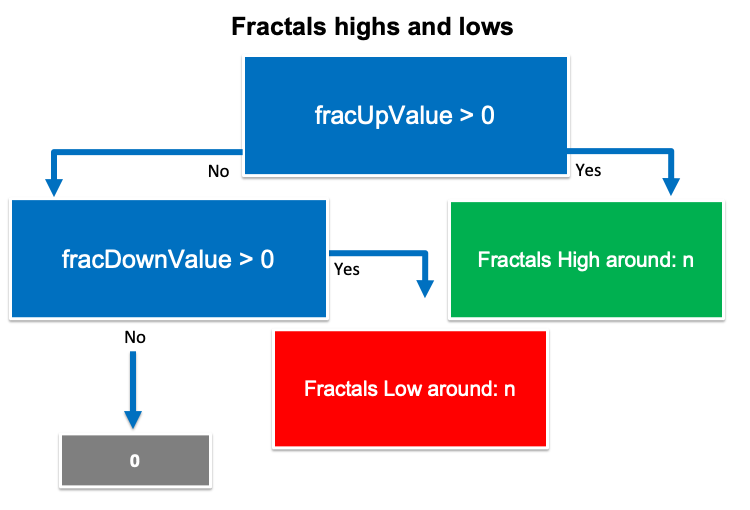
Based on this strategy we need to create a trading system that can be used to return the highs and lows of the Fractals indicator as a comment on the chart by continuously checking the fracUpvalue and the fracDownValue. If the fracUp is greater than zero or it has no empty value and the fracDown has an empty value, we need the trading system to return a signal on the chart as a comment with the following value:
- Fractals High around: n
In the other case, if the fracDown is greater than zero or it has no empty value and the fracUp has an empty value, we need the trading system to return a signal on the chart as a comment with the following value:
- Fractals Low around: n
The following is the blueprint of this strategy:
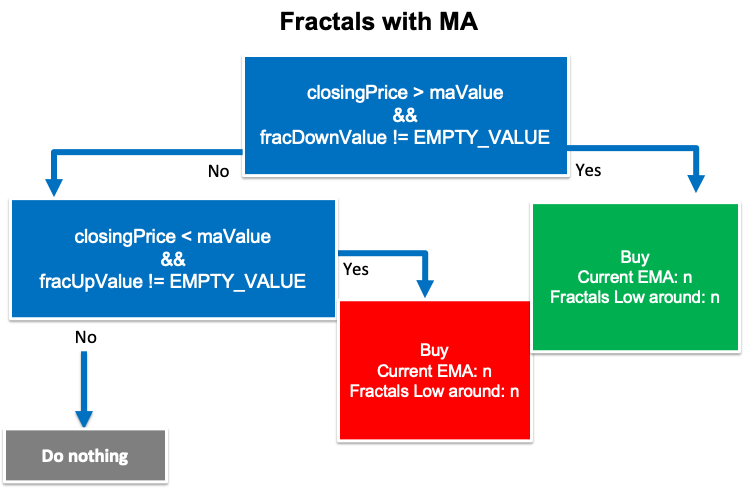
2. Fractals with MA
Based on this strategy, we need to create a trading system that can be used to return buy and sell signals as a comment on the chart based on continuous checking of the following values:
- the closing price
- EMA (Exponential Moving Average) valuue
- fracDown value
- fracUp value
If the closing price is greater than the EMA value and the fracDown value is not equal to an empty value, we need the trading system to return the following values:
- Buy
- Current EMA
- Fractals Low value: n
In the other case, if the closing price is lower than the EMA value and the fracUp value is not equal to an empty value, we need the trading system to return the following values:
- Sell
- Current EMA
- Fractals High value: n
The following graph is for this blueprint:
3. Fractals with Alligator
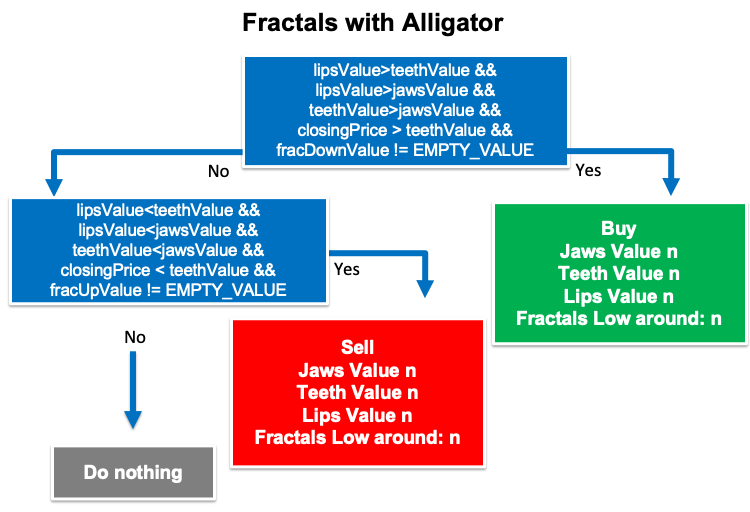
Based on this trading strategy, we need to create a system that can be used to generate buy and sell signals by continuous checking positions for the following values:
- The lips value
- The teeth value
- The jaws value
- The closing price
- The fracDown value
- The fracUp value
If the lips value is greater than the teeth value and the jaws value, the teeth value is greater than the jaws value, the closing price is greater than the teeth value, and the fracDown value is not equal to an empty value, we need the trading system to return comment on the chart with the following values:
- Buy
- Jaws Value n
- Teeth Value n
- Lips Value n
- Fractals Low around: n
In the other case, if the lips value is lower than the teeth and jaws values, the teeth line is lower than the jaws value, the closing price is lower than the teeth, and the fracUp value is not equal to an empty value, we need the trading system to return the following values:
- Sell
- Jaws Value n
- Teeth Value n
- Lips Value n
- Fractals High around: n
The following graph is for this blueprint:
Fractals trading system
In this topic, we will learn how to create a trading system based on mentioned strategies step-by-step to execute them in the MetaTrader 5 terminal. We will start creating a simple Fractals system that can be used to return comments on the chart with the Fractals indicator values and the following is for how to do that.
Creating arrays for fractals up and down by using the double function.
   double fracUpArray[];
   double fracDownArray[];
Sorting data by using the ArraySetAsSeries function. Its parameters are:
- array[]: we will use the created arrays fracUpArray and fracDownArray.
- flag: we will use true.
   ArraySetAsSeries(fracUpArray,true);
   ArraySetAsSeries(fracDownArray,true);
Defining the fractals indicator by using the "iFractals" function to return the handle of the Fractals indicator. Its parameters are:
- symbol: we will use _Symbol to be applied to the current chart.
- period: we will use _Period to be applied to the current time frame.
int fracDef=iFractals(_Symbol,_Period);
Getting data and storing the result by using the "CopyBuffer" function. Its parameters are:
- indicator_handle: to determine the indicator handle, we will use (fracDef).
- buffer_num: to determine the indicator buffer number, we will use (UPPER_LINE for fracUp), (LOWER_LINE for fracDown).
- start_pos: to determine the start position, we will determine (1).
- count: to determine the amount to copy, we will use (3).
- buffer[]: to define the target array to copy, we will use (fracUpArray, fracDownArray).
   CopyBuffer(fracDef,UPPER_LINE,2,1,fracUpArray);
   CopyBuffer(fracDef,LOWER_LINE,2,1,fracDownArray);
Getting values of fractals up and down.
   double fracUpValue=NormalizeDouble(fracUpArray[0],5);
   double fracDownValue=NormalizeDouble(fracDownArray[0],5);
Returning zero value in case of empty value for fracUpValue and faceDownValue.
   if(fracUpValue==EMPTY_VALUE)
      fracUpValue = 0;
   if(fracDownValue==EMPTY_VALUE)
      fracDownValue = 0;
Using the "Comment" function to return comments on the chart with values of fractals.
   Comment("Fractals Up Value = ",fracUpValue,"\n",
           "Fractals Down Value = ",fracDownValue);
The following is for the full code to create this trading system.
//+------------------------------------------------------------------+
//|                                       Simple Fractals System.mq5 |
//|                                  Copyright 2022, MetaQuotes Ltd. |
//|                                             https://www.mql5.com |
//+------------------------------------------------------------------+
#property copyright "Copyright 2022, MetaQuotes Ltd."
#property link      "https://www.mql5.com"
#property version   "1.00"
//+------------------------------------------------------------------+
void OnTick()
  {
//creating price array
   double fracUpArray[];
   double fracDownArray[];
//Sorting data
   ArraySetAsSeries(fracUpArray,true);
   ArraySetAsSeries(fracDownArray,true);
//define frac
   int fracDef=iFractals(_Symbol,_Period);
//define data and store result
   CopyBuffer(fracDef,UPPER_LINE,2,1,fracUpArray);
   CopyBuffer(fracDef,LOWER_LINE,2,1,fracDownArray);
//get values of fracUp and fracDown
   double fracUpValue=NormalizeDouble(fracUpArray[0],5);
   double fracDownValue=NormalizeDouble(fracDownArray[0],5);
//returning zero if there is empty value of fracUp
   if(fracUpValue==EMPTY_VALUE)
      fracUpValue = 0;
//returning zero if there is empty value of fracDown
   if(fracDownValue==EMPTY_VALUE)
      fracDownValue = 0;
//comment on the chart
   Comment("Fractals Up Value = ",fracUpValue,"\n",
           "Fractals Down Value = ",fracDownValue);
  }
//+------------------------------------------------------------------+
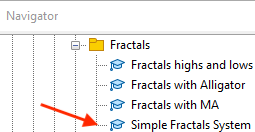
After compiling this code we will find its file in the navigator folder the same as the following:
By dragging and dropping this file on the chart we will find its window the same as the following:
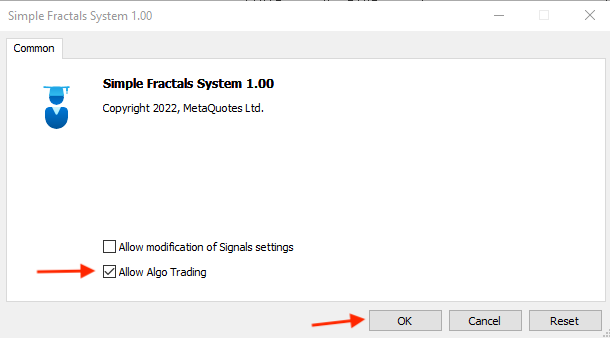
After pressing "OK" after ticking next to the "Allow Algo Trading" we will find this expert is attached to the chart the same as the following:
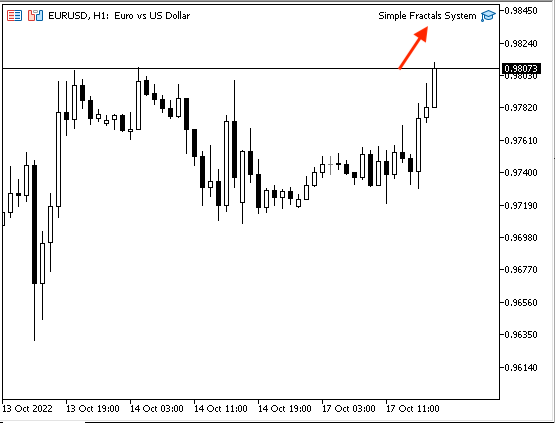
As we can see on the top right corner of the chart the expert is attached and we're ready to receive the desired signals the following are examples from testing:
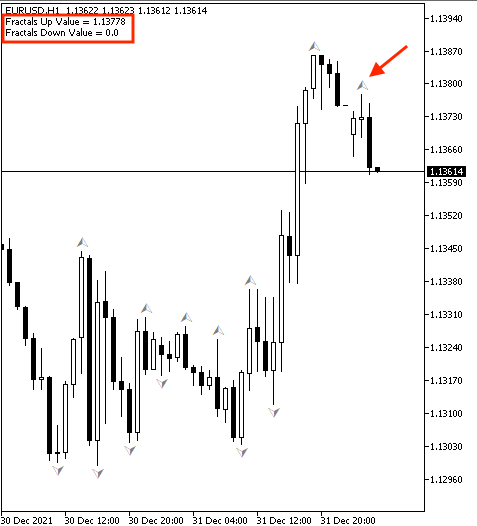
As we can see in the top left corner that we have two values:
- Fractals Up Value = n
- Fractals Down Value = 0
And it is clear that the Fractals Down Value is zero as we have Fractals up value.
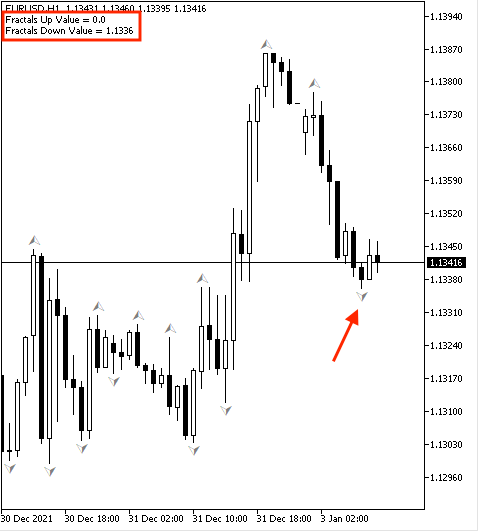
We have two values:
- Fractals Up Value = 0
- Fractals Down Value = n
But the Fractals Up Value is zero as we have Fractals down value.
1. Fractals highs and lows
The following is about the full code to create a trading system of the Fractals' highs and lows.
//+------------------------------------------------------------------+
//|                                      Fractals highs and lows.mq5 |
//|                                  Copyright 2022, MetaQuotes Ltd. |
//|                                             https://www.mql5.com |
//+------------------------------------------------------------------+
#property copyright "Copyright 2022, MetaQuotes Ltd."
#property link      "https://www.mql5.com"
#property version   "1.00"
//+------------------------------------------------------------------+
void OnTick()
  {
//creating arrays
   double fracUpArray[];
   double fracDownArray[];
//Sorting data
   ArraySetAsSeries(fracUpArray,true);
   ArraySetAsSeries(fracDownArray,true);
//define frac
   int fracDef = iFractals(_Symbol,_Period);
//define data and store result
   CopyBuffer(fracDef,UPPER_LINE,2,1,fracUpArray);
   CopyBuffer(fracDef,LOWER_LINE,2,1,fracDownArray);
//define values
   double fracUpValue = NormalizeDouble(fracUpArray[0],5);
   double fracDownValue = NormalizeDouble(fracDownArray[0],5);
//returning zero in case of empty values
   if(fracUpValue ==EMPTY_VALUE)
      fracUpValue = 0;
   if(fracDownValue ==EMPTY_VALUE)
      fracDownValue = 0;
//conditions of the strategy and comment on the chart with highs and lows
//in case of high
   if(fracUpValue>0)
     {
      Comment("Fractals High around: ",fracUpValue);
     }
//in case of low
   if(fracDownValue>0)
     {
      Comment("Fractals Low around: ",fracDownValue);
     }
  }
//+------------------------------------------------------------------+
Differences in this code.
Conditions of the strategy:
In case of high,
   if(fracUpValue>0)
     {
      Comment("Fractals High around: ",fracUpValue);
     }
In case of low,
   if(fracDownValue>0)
     {
      Comment("Fractals Low around: ",fracDownValue);
     }
After compiling this code and attaching it to the chart the same as we learned before we will find that the expert of the Fractals highs and lows are attached the same as the following:
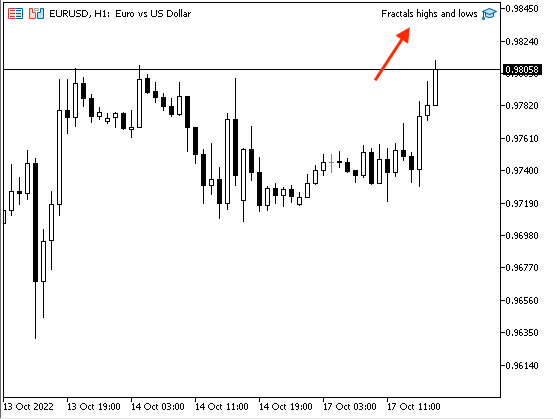
Now, we can receive desired results for highs and lows. In the case of lows:
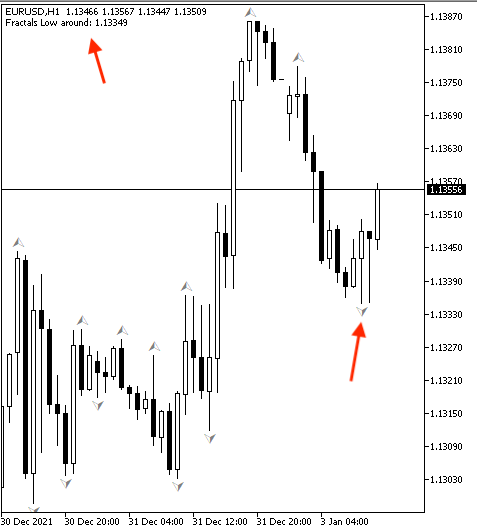
We can see in the previous chart in the top left corner that we have the value of Fractals low as the Fractals indicator formed a low.
In the case of highs:
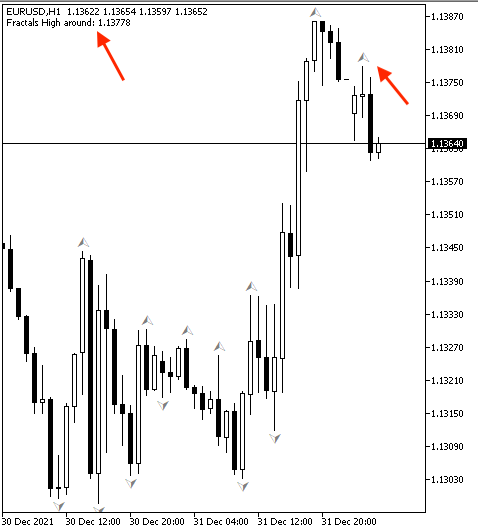
As we can see that we have the Fractals' high value as the indicator formed a high on the chart.
2. Fractals with MA
The following is the full code to create a trading system for the Fractals with MA strategy.
//+------------------------------------------------------------------+
//|                                             Fractals with MA.mq5 |
//|                                  Copyright 2022, MetaQuotes Ltd. |
//|                                             https://www.mql5.com |
//+------------------------------------------------------------------+
#property copyright "Copyright 2022, MetaQuotes Ltd."
#property link      "https://www.mql5.com"
#property version   "1.00"
//+------------------------------------------------------------------+
void OnTick()
  {
//creating arrays
   double fracUpArray[];
   double fracDownArray[];
   MqlRates priceArray[];
   double maArray[];
//Sorting data
   ArraySetAsSeries(fracUpArray,true);
   ArraySetAsSeries(fracDownArray,true);
   ArraySetAsSeries(priceArray,true);
   ArraySetAsSeries(maArray,true);
//define values
   int fracDef = iFractals(_Symbol,_Period);
   int Data = CopyRates(_Symbol,_Period,0,3,priceArray);
   int maDef = iMA(_Symbol,_Period,50,0,MODE_EMA,PRICE_CLOSE);
//define data and store result
   CopyBuffer(fracDef,UPPER_LINE,2,1,fracUpArray);
   CopyBuffer(fracDef,LOWER_LINE,2,1,fracDownArray);
   CopyBuffer(maDef,0,0,3,maArray);
//get values
   double fracUpValue = NormalizeDouble(fracUpArray[0],5);
   double fracDownValue = NormalizeDouble(fracDownArray[0],5);
   double closingPrice = priceArray[0].close;
   double maValue = NormalizeDouble(maArray[0],6);
   bool isBuy = false;
   bool isSell = false;
//conditions of the strategy and comment on the chart
//in case of buy
   if(closingPrice > maValue && fracDownValue != EMPTY_VALUE)
     {
      Comment("Buy","\n",
              "Current EMA: ",maValue,"\n",
              "Fractals Low around: ",fracDownValue);
      isBuy = true;
     }
//in case of sell
   if(closingPrice < maValue && fracUpValue != EMPTY_VALUE)
     {
      Comment("Sell","\n",
              "Current EMA: ",maValue,"\n",
              "Fractals High around: ",fracUpValue);
      isSell = true;
     }
  }
//+------------------------------------------------------------------+
Differences in this code.
Creating two more arrays of priceArray by using the "MqlRates" function to store information about prices, volumes, and spread and maArray by using the "double" function.
   MqlRates priceArray[];
   double maArray[];
Sorting data of these two arrays.
   ArraySetAsSeries(priceArray,true);
   ArraySetAsSeries(maArray,true);
Getting historical data of MqlRates by using the "CopyRates" function. Its parameters are:
- symbol_name: to determine the symbol name, we will use (_Symbol).
- timeframe: to determine the period, we will use (_period).
- start_pos: to determine the start position, we will use (0).
- count: to determine the data count to copy, we will use (3).
- rates_array[]: to determine the target array to copy, we will use (priceArray).
Defining the moving average by using the "iMA" function. Its parameters:
- symbol: to determine the symbol name.
- period: to determine the period.
- ma_period: to determine the averaging period, will be (50).
- ma_shift: to determine the horizontal shift, will be (0).
- ma_method: to determine the type of moving average, will be EMA (Exponential Moving Average).
- applied_price: to determine the type of price, will be the closing price.
   int Data = CopyRates(_Symbol,_Period,0,3,priceArray);
   int maDef = iMA(_Symbol,_Period,50,0,MODE_EMA,PRICE_CLOSE);
Sorting data.
CopyBuffer(maDef,0,0,3,maArray);
Defining the closing price and MA value.
double closingPrice = priceArray[0].close;
double maValue = NormalizeDouble(maArray[0],6);
Creating two bool variables for isBuy and isSell to avoid conflict between buying and selling signals of the same candle.
   bool isBuy = false;
   bool isSell = false;
Conditions of the strategy.
In the case of buying signal:
   if(closingPrice > maValue && fracDownValue != EMPTY_VALUE)
     {
      Comment("Buy","\n",
              "Current EMA: ",maValue,"\n",
              "Fractals Low around: ",fracDownValue);
      isBuy = true;
     }
In the case of selling signal:
   if(closingPrice < maValue && fracUpValue != EMPTY_VALUE)
     {
      Comment("Sell","\n",
              "Current EMA: ",maValue,"\n",
              "Fractals High around: ",fracUpValue);
      isSell = true;
     }
After compiling this code and executing it we will find the expert attached.
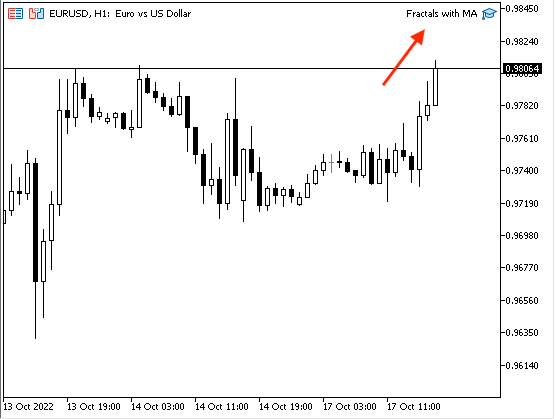
As we can see that the expert of Fractals with MA is attached to the chart in the top right corner. We will receive desired signals the same as the following examples:
In the case of buying signal:
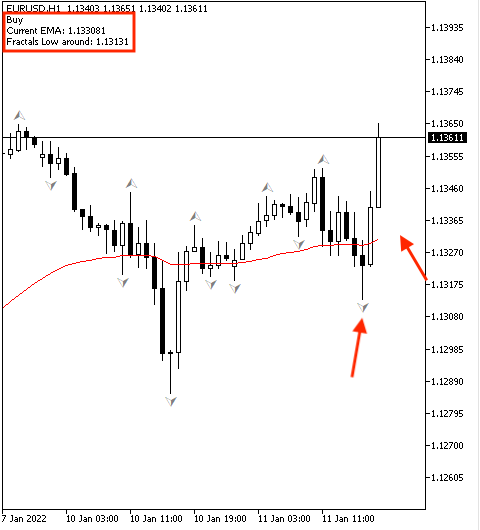
We have a comment on the chart with the following values:
- Buy
- Current EMA
- Fractals Low around: n
In the case of selling signal:
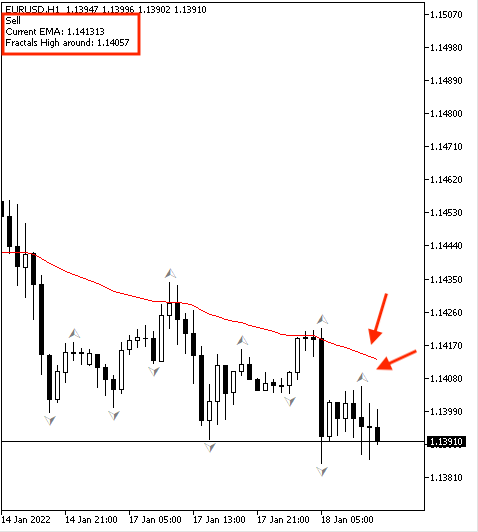
We have the following values:
- Sell
- Current EMA
- Fractals High around: n
3. Fractals with Alligator
The following is for the full code to create a trading system for the Fractals with Alligator strategy.
//+------------------------------------------------------------------+
//|                                      Fractals with Alligator.mq5 |
//|                                  Copyright 2022, MetaQuotes Ltd. |
//|                                             https://www.mql5.com |
//+------------------------------------------------------------------+
#property copyright "Copyright 2022, MetaQuotes Ltd."
#property link      "https://www.mql5.com"
#property version   "1.00"
//+------------------------------------------------------------------+
void OnTick()
  {
//creating arrays
   double fracUpArray[];
   double fracDownArray[];
   MqlRates priceArray[];
   double jawsArray[];
   double teethArray[];
   double lipsArray[];
//Sorting data
   ArraySetAsSeries(fracUpArray,true);
   ArraySetAsSeries(fracDownArray,true);
   ArraySetAsSeries(jawsArray,true);
   ArraySetAsSeries(teethArray,true);
   ArraySetAsSeries(lipsArray,true);
//define values
   int fracDef=iFractals(_Symbol,_Period);
   int Data = CopyRates(_Symbol,_Period,0,3,priceArray);
   int alligatorDef=iAlligator(_Symbol,_Period,13,8,8,5,5,3,MODE_SMMA,PRICE_MEDIAN);
//define data and store result
   CopyBuffer(fracDef,UPPER_LINE,2,1,fracUpArray);
   CopyBuffer(fracDef,LOWER_LINE,2,1,fracDownArray);
   CopyBuffer(alligatorDef,0,0,3,jawsArray);
   CopyBuffer(alligatorDef,1,0,3,teethArray);
   CopyBuffer(alligatorDef,2,0,3,lipsArray);
//get values
   double fracUpValue=NormalizeDouble(fracUpArray[0],5);
   double fracDownValue=NormalizeDouble(fracDownArray[0],5);
   double closingPrice = priceArray[0].close;
   double jawsValue=NormalizeDouble(jawsArray[0],5);
   double teethValue=NormalizeDouble(teethArray[0],5);
   double lipsValue=NormalizeDouble(lipsArray[0],5);
//creating bool variables to aviod buy ans sell signals at the same time
   bool isBuy = false;
   bool isSell = false;
//conditions of the strategy and comment on the chart
//in case of buy
   if(lipsValue>teethValue && lipsValue>jawsValue && teethValue>jawsValue
   && closingPrice > teethValue && fracDownValue != EMPTY_VALUE)
     {
      Comment("Buy","\n",
              "jawsValue = ",jawsValue,"\n",
              "teethValue = ",teethValue,"\n",
              "lipsValue = ",lipsValue,"\n",
              "Fractals Low around: ",fracDownValue);
      isBuy = true;
     }
//in case of sell
   if(lipsValue<teethValue && lipsValue<jawsValue && teethValue<jawsValue
   && closingPrice < teethValue && fracUpValue != EMPTY_VALUE)
     {
      Comment("Sell","\n",
              "jawsValue = ",jawsValue,"\n",
              "teethValue = ",teethValue,"\n",
              "lipsValue = ",lipsValue,"\n",
              "Fractals High around: ",fracUpValue);
      isSell = true;
     }
  }
//+------------------------------------------------------------------+
Differences in this code.
Creating three arrays of the Alligator components.
   double jawsArray[];
   double teethArray[];
   double lipsArray[];
Sorting data in these arrays by using the "ArraySetAsSeries" function.
   ArraySetAsSeries(jawsArray,true);
   ArraySetAsSeries(teethArray,true);
   ArraySetAsSeries(lipsArray,true);
Defining the Alligator by using the "iAlligator" function. Its parameters:
- symbol: we will use (_Symbol) to be applied to the current symbol.
- period: we will use (_Period) to be applied to the current time frame.
- jaw_period: to determine the period of the calculation of jaws, we will use (13).
- jaw_shift: to determine the horizontal shift of jaws, we will use (8).
- teeth_period: to determine the period of the calculation of teeth, we will use (8).
- teeth_shift: to determine the horizontal shift of teeth, we will use (5).
- lips_period: to determine the period of the calculation of lips, we will use (5).
- lips_shift: to determine the horizontal shift of lips, we will use (3).
- ma_method: to determine the type of moving average, we will use(MODE_SMA).
- applied_price: to determine the type of price, we will use (PRICE_MEDIAN).
int alligatorDef=iAlligator(_Symbol,_Period,13,8,8,5,5,3,MODE_SMMA,PRICE_MEDIAN);
Defining data and storing results by using the "CopyBuffer" function. Its parameters:
- indicator_handle: to determine the indicator handle, we will use (alligatorDef).
- buffer_num: to determine the indicator buffer number, we will use (0 for jaws), (1 for teeth), and (2 for lips).
- start_pos: to determine the start position, we will determine (0).
- count: to determine the amount to copy, we will use (3).
- buffer[]: to determine the target array to copy, we will use (jawsArray, teethArray, lipsArray).
   CopyBuffer(alligatorDef,0,0,3,jawsArray);
   CopyBuffer(alligatorDef,1,0,3,teethArray);
   CopyBuffer(alligatorDef,2,0,3,lipsArray);
Get values of the Alligator components.
   double jawsValue=NormalizeDouble(jawsArray[0],5);
   double teethValue=NormalizeDouble(teethArray[0],5);
   double lipsValue=NormalizeDouble(lipsArray[0],5);
Conditions of the strategy:
In the case of buying signal:
   if(lipsValue>teethValue && lipsValue>jawsValue && teethValue>jawsValue
   && closingPrice > teethValue && fracDownValue != EMPTY_VALUE)
     {
      Comment("Buy","\n",
              "jawsValue = ",jawsValue,"\n",
              "teethValue = ",teethValue,"\n",
              "lipsValue = ",lipsValue,"\n",
              "Fractals Low around: ",fracDownValue);
      isBuy = true;
     }
In the case of selling signal:
   if(lipsValue<teethValue && lipsValue<jawsValue && teethValue<jawsValue
   && closingPrice < teethValue && fracUpValue != EMPTY_VALUE)
     {
      Comment("Sell","\n",
              "jawsValue = ",jawsValue,"\n",
              "teethValue = ",teethValue,"\n",
              "lipsValue = ",lipsValue,"\n",
              "Fractals High around: ",fracUpValue);
      isSell = true;
     }
After compiling this code and executing it to the desired chart we will find the expert is attached to the chart the same as the following:
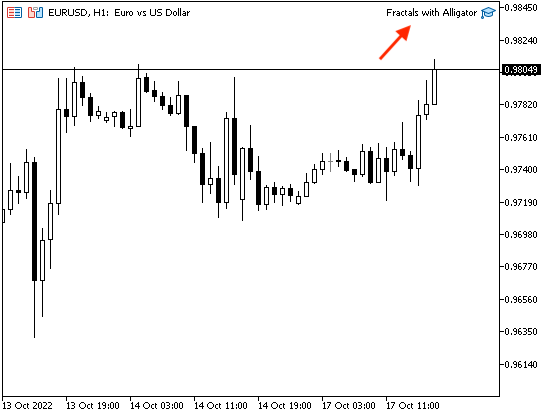
We're can get desired signals based on this strategy after attaching this expert to the chart the same as we can see in the previous chart in the top right corner.
The following are examples of generated signals from testing:
In the case of buying signal
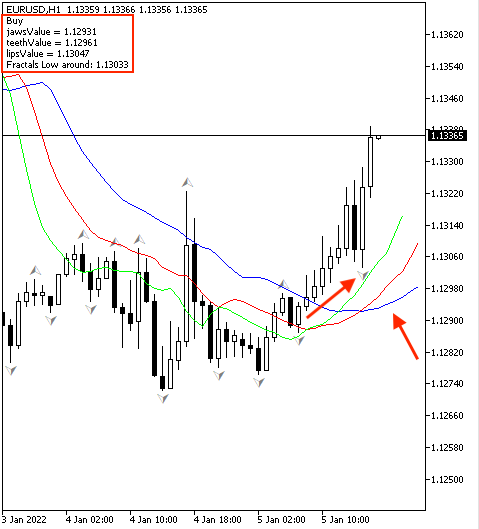
As we can see we have the following values as a signal on the previous chart in the top left corner:
- Buy
- Jaws value
- Teeth value
- Lips value
- Fractals low value
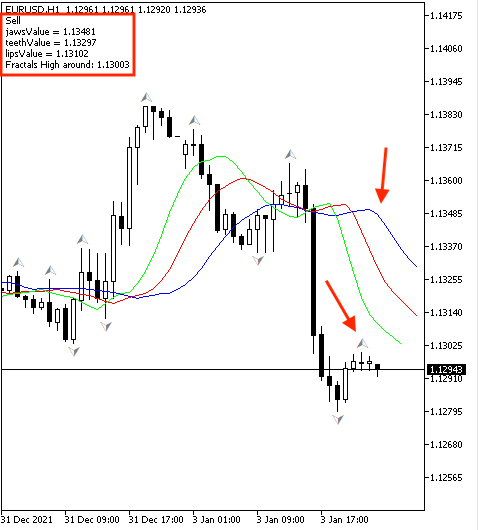
We have the following values as a signal on the previous chart:
- Sell
- Jaws value
- Teeth value
- Lips value
- Fractals high value
Conclusion
The Fractals technical indicator is a useful and effective tool in trading even as a standalone tool or accompanied by another technical indicator as it gives useful insights the same as we learned in this article. It is supposed that you learned what it is, what it measures, how it can be formed on the chart through the method of its calculation, and how to insert the built-in to be displayed on the MetaTrader 5 terminal. In addition to that we learned how we can use it through the following simple trading strategies:
- Fractals highs and lows: to detect highs and lows of Fractals indicator and get signal on the chart with them.
- Fractals with MA: to get buy and sell signals based on generated Fractals signals as per the position of prices and its moving average.
- Fractals with Alligator: to get buy and sell signals based on Fractals signals as per the position of prices and the Alligator indicator.
We learned also, how we can create a trading system based on each mentioned strategy to get automatic signals on the MetaTrader 5 chart by coding these strategies by MQL5. I hope that you tried to apply them by yourself for the sake of deep understanding and getting more insights about the topic of this article or any related topic to get a complete benefit from reading this article.
I confirm again you must test any mentioned strategy before using it on your real account to make sure that it will be profitable. I hope that you found this article useful for you and you learned new things that can be a good enhancement of your trading results. If you found that and you want to read more similar articles you can read my other articles in this series about understanding and creating a trading system based on the most popular technical indicators.
Warning: All rights to these materials are reserved by MetaQuotes Ltd. Copying or reprinting of these materials in whole or in part is prohibited.
This article was written by a user of the site and reflects their personal views. MetaQuotes Ltd is not responsible for the accuracy of the information presented, nor for any consequences resulting from the use of the solutions, strategies or recommendations described.
 Data Science and Machine Learning (Part 08): K-Means Clustering in plain MQL5
 DIY technical indicator
 Market math: profit, loss and costs
- Free trading apps
- Over 8,000 signals for copying
- Economic news for exploring financial markets
You agree to website policy and terms of use
Hi , thank you for such a clear article... i getting an error in my fractal code (2024.11.10 17:42:12.121 _24 Dev 3 EA Strat1 (EURUSD,H1) _24 Dev 3 EA Strat1.mq5:void OnDeinit(const int):OnDeinit:48 Error Code:INDICATOR_DATA_NOT_FOUND ) .
When running your code i get the same error .
Can you please help. I have tried lots of different combinations .
Appreciate the support .
Jay
I would like to know if it is really profitable to apply this system of yours?
I have implemented fractals/alligators (using your codes) and my experience is that there are many false signals. The general problem with fractals is that we are 2 candles ahead of the fractal signal. I'm combining it with the RSI (70/30) and other indicators to see if I can find good quality entries.