MQL4 and MQL5 Programming Articles
Study the MQL5 language for programming trading strategies in numerous published articles mostly written by you - the community members. The articles are grouped into categories to help you quicker find answers to any questions related to programming: Integration, Tester, Trading Strategies, etc.
Follow our new publications and discuss them on the Forum!
Add a new article

You are missing trading opportunities:
- Free trading apps
- Over 8,000 signals for copying
- Economic news for exploring financial markets
Registration
Log in
You agree to website policy and terms of use
If you do not have an account, please register

Creating a Trading Administrator Panel in MQL5 (Part XI): Modern feature communications interface (I)
Today, we are focusing on the enhancement of the Communications Panel messaging interface to align with the standards of modern, high-performing communication applications. This improvement will be achieved by updating the CommunicationsDialog class. Join us in this article and discussion as we explore key insights and outline the next steps in advancing interface programming using MQL5.

Finding custom currency pair patterns in Python using MetaTrader 5
Are there any repeating patterns and regularities in the Forex market? I decided to create my own pattern analysis system using Python and MetaTrader 5. A kind of symbiosis of math and programming for conquering Forex.

High frequency arbitrage trading system in Python using MetaTrader 5
In this article, we will create an arbitration system that remains legal in the eyes of brokers, creates thousands of synthetic prices on the Forex market, analyzes them, and successfully trades for profit.

MQL5 Wizard Techniques you should know (Part 63): Using Patterns of DeMarker and Envelope Channels
The DeMarker Oscillator and the Envelope indicator are momentum and support/resistance tools that can be paired when developing an Expert Advisor. We therefore examine on a pattern by pattern basis what could be of use and what potentially avoid. We are using, as always, a wizard assembled Expert Advisor together with the Patterns-Usage functions that are built into the Expert Signal Class.

Overcoming The Limitation of Machine Learning (Part 1): Lack of Interoperable Metrics
There is a powerful and pervasive force quietly corrupting the collective efforts of our community to build reliable trading strategies that employ AI in any shape or form. This article establishes that part of the problems we face, are rooted in blind adherence to "best practices". By furnishing the reader with simple real-world market-based evidence, we will reason to the reader why we must refrain from such conduct, and rather adopt domain-bound best practices if our community should stand any chance of recovering the latent potential of AI.

MQL5 Trading Tools (Part 1): Building an Interactive Visual Pending Orders Trade Assistant Tool
In this article, we introduce the development of an interactive Trade Assistant Tool in MQL5, designed to simplify placing pending orders in Forex trading. We outline the conceptual design, focusing on a user-friendly GUI for setting entry, stop-loss, and take-profit levels visually on the chart. Additionally, we detail the MQL5 implementation and backtesting process to ensure the tool’s reliability, setting the stage for advanced features in the preceding parts.

From Basic to Intermediate: Arrays and Strings (I)
In today's article, we'll start exploring some special data types. To begin, we'll define what a string is and explain how to use some basic procedures. This will allow us to work with this type of data, which can be interesting, although sometimes a little confusing for beginners. The content presented here is intended solely for educational purposes. Under no circumstances should the application be viewed for any purpose other than to learn and master the concepts presented.

Data Science and ML (Part 38): AI Transfer Learning in Forex Markets
The AI breakthroughs dominating headlines, from ChatGPT to self-driving cars, aren’t built from isolated models but through cumulative knowledge transferred from various models or common fields. Now, this same "learn once, apply everywhere" approach can be applied to help us transform our AI models in algorithmic trading. In this article, we are going to learn how we can leverage the information gained across various instruments to help in improving predictions on others using transfer learning.
Neural Networks in Trading: Superpoint Transformer (SPFormer)
In this article, we introduce a method for segmenting 3D objects based on Superpoint Transformer (SPFormer), which eliminates the need for intermediate data aggregation. This speeds up the segmentation process and improves the performance of the model.

From Basic to Intermediate: Operator Precedence
This is definitely the most difficult question to be explained purely theoretically. That is why you need to practice everything that we're going to discuss here. While this may seem simple at first, the topic of operators can only be understood in practice combined with constant education.

Artificial Showering Algorithm (ASHA)
The article presents the Artificial Showering Algorithm (ASHA), a new metaheuristic method developed for solving general optimization problems. Based on simulation of water flow and accumulation processes, this algorithm constructs the concept of an ideal field, in which each unit of resource (water) is called upon to find an optimal solution. We will find out how ASHA adapts flow and accumulation principles to efficiently allocate resources in a search space, and see its implementation and test results.

Developing a Replay System (Part 66): Playing the service (VII)
In this article, we will implement the first solution that will allow us to determine when a new bar may appear on the chart. This solution is applicable in a wide variety of situations. Understanding its development will help you grasp several important aspects. The content presented here is intended solely for educational purposes. Under no circumstances should the application be viewed for any purpose other than to learn and master the concepts presented.

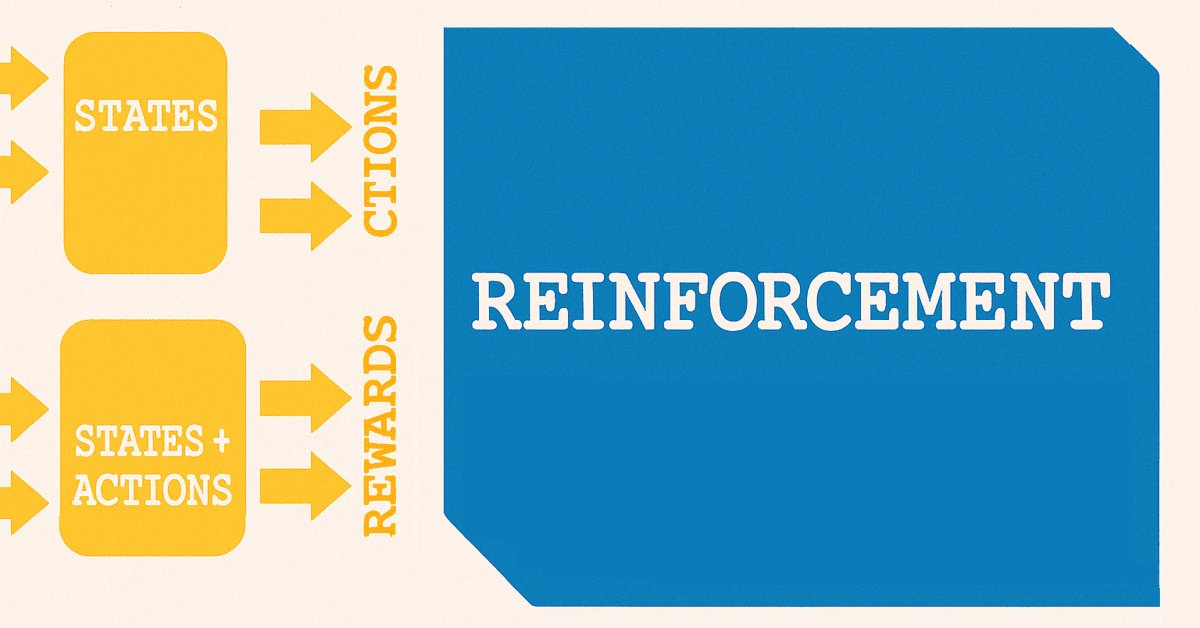
MQL5 Wizard Techniques you should know (Part 62): Using Patterns of ADX and CCI with Reinforcement-Learning TRPO
The ADX Oscillator and CCI oscillator are trend following and momentum indicators that can be paired when developing an Expert Advisor. We continue where we left off in the last article by examining how in-use training, and updating of our developed model, can be made thanks to reinforcement-learning. We are using an algorithm we are yet to cover in these series, known as Trusted Region Policy Optimization. And, as always, Expert Advisor assembly by the MQL5 Wizard allows us to set up our model(s) for testing much quicker and also in a way where it can be distributed and tested with different signal types.

Automating Trading Strategies in MQL5 (Part 16): Midnight Range Breakout with Break of Structure (BoS) Price Action
In this article, we automate the Midnight Range Breakout with Break of Structure strategy in MQL5, detailing code for breakout detection and trade execution. We define precise risk parameters for entries, stops, and profits. Backtesting and optimization are included for practical trading.
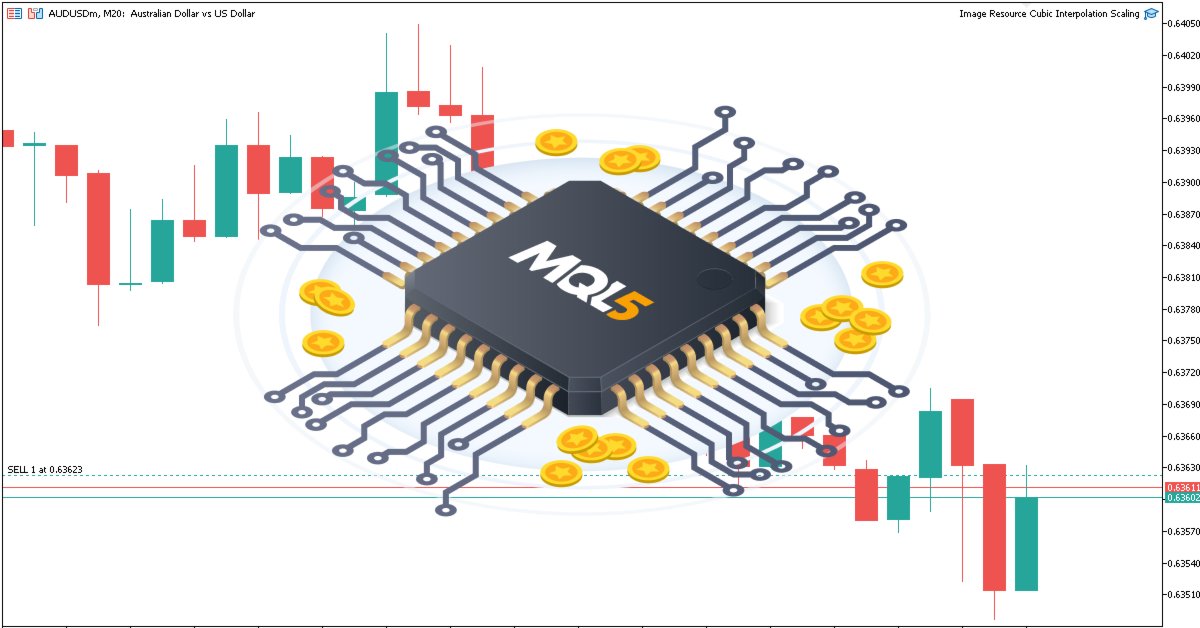
Creating Dynamic MQL5 Graphical Interfaces through Resource-Driven Image Scaling with Bicubic Interpolation on Trading Charts
In this article, we explore dynamic MQL5 graphical interfaces, using bicubic interpolation for high-quality image scaling on trading charts. We detail flexible positioning options, enabling dynamic centering or corner anchoring with custom offsets.

DoEasy. Service functions (Part 3): Outside Bar pattern
In this article, we will develop the Outside Bar Price Action pattern in the DoEasy library and optimize the methods of access to price pattern management. In addition, we will fix errors and shortcomings identified during library tests.

Data Science and ML (Part 37): Using Candlestick patterns and AI to beat the market
Candlestick patterns help traders understand market psychology and identify trends in financial markets, they enable more informed trading decisions that can lead to better outcomes. In this article, we will explore how to use candlestick patterns with AI models to achieve optimal trading performance.

Price Action Analysis Toolkit Development (Part 21): Market Structure Flip Detector Tool
The Market Structure Flip Detector Expert Advisor (EA) acts as your vigilant partner, constantly observing shifts in market sentiment. By utilizing Average True Range (ATR)-based thresholds, it effectively detects structure flips and labels each Higher Low and Lower High with clear indicators. Thanks to MQL5’s swift execution and flexible API, this tool offers real-time analysis that adjusts the display for optimal readability and provides a live dashboard to monitor flip counts and timings. Furthermore, customizable sound and push notifications guarantee that you stay informed of critical signals, allowing you to see how straightforward inputs and helper routines can transform price movements into actionable strategies.

MQL5 Wizard Techniques you should know (Part 61): Using Patterns of ADX and CCI with Supervised Learning
The ADX Oscillator and CCI oscillator are trend following and momentum indicators that can be paired when developing an Expert Advisor. We look at how this can be systemized by using all the 3 main training modes of Machine Learning. Wizard Assembled Expert Advisors allow us to evaluate the patterns presented by these two indicators, and we start by looking at how Supervised-Learning can be applied with these Patterns.

From Basic to Intermediate: FOR Statement
In this article, we will look at the most basic concepts of the FOR statement. It is very important to understand everything that will be shown here. Unlike the other statements we've talked about so far, the FOR statement has some quirks that quickly make it very complex. So don't let stuff like this accumulate. Start studying and practicing as soon as possible.

Building a Custom Market Regime Detection System in MQL5 (Part 2): Expert Advisor
This article details building an adaptive Expert Advisor (MarketRegimeEA) using the regime detector from Part 1. It automatically switches trading strategies and risk parameters for trending, ranging, or volatile markets. Practical optimization, transition handling, and a multi-timeframe indicator are included.

Websockets for MetaTrader 5: Asynchronous client connections with the Windows API
This article details the development of a custom dynamically linked library designed to facilitate asynchronous websocket client connections for MetaTrader programs.

Automating Trading Strategies in MQL5 (Part 15): Price Action Harmonic Cypher Pattern with Visualization
In this article, we explore the automation of the Cypher harmonic pattern in MQL5, detailing its detection and visualization on MetaTrader 5 charts. We implement an Expert Advisor that identifies swing points, validates Fibonacci-based patterns, and executes trades with clear graphical annotations. The article concludes with guidance on backtesting and optimizing the program for effective trading.

Atmosphere Clouds Model Optimization (ACMO): Practice
In this article, we will continue diving into the implementation of the ACMO (Atmospheric Cloud Model Optimization) algorithm. In particular, we will discuss two key aspects: the movement of clouds into low-pressure regions and the rain simulation, including the initialization of droplets and their distribution among clouds. We will also look at other methods that play an important role in managing the state of clouds and ensuring their interaction with the environment.

Neural Networks in Trading: Exploring the Local Structure of Data
Effective identification and preservation of the local structure of market data in noisy conditions is a critical task in trading. The use of the Self-Attention mechanism has shown promising results in processing such data; however, the classical approach does not account for the local characteristics of the underlying structure. In this article, I introduce an algorithm capable of incorporating these structural dependencies.

Data Science and ML (Part 36): Dealing with Biased Financial Markets
Financial markets are not perfectly balanced. Some markets are bullish, some are bearish, and some exhibit some ranging behaviors indicating uncertainty in either direction, this unbalanced information when used to train machine learning models can be misleading as the markets change frequently. In this article, we are going to discuss several ways to tackle this issue.
MQL5 Wizard Techniques you should know (Part 60): Inference Learning (Wasserstein-VAE) with Moving Average and Stochastic Oscillator Patterns
We wrap our look into the complementary pairing of the MA & Stochastic oscillator by examining what role inference-learning can play in a post supervised-learning & reinforcement-learning situation. There are clearly a multitude of ways one can choose to go about inference learning in this case, our approach, however, is to use variational auto encoders. We explore this in python before exporting our trained model by ONNX for use in a wizard assembled Expert Advisor in MetaTrader.

Building a Custom Market Regime Detection System in MQL5 (Part 1): Indicator
This article details creating an MQL5 Market Regime Detection System using statistical methods like autocorrelation and volatility. It provides code for classes to classify trending, ranging, and volatile conditions and a custom indicator.

Creating a Trading Administrator Panel in MQL5 (Part X): External resource-based interface
Today, we are harnessing the capabilities of MQL5 to utilize external resources—such as images in the BMP format—to create a uniquely styled home interface for the Trading Administrator Panel. The strategy demonstrated here is particularly useful when packaging multiple resources, including images, sounds, and more, for streamlined distribution. Join us in this discussion as we explore how these features are implemented to deliver a modern and visually appealing interface for our New_Admin_Panel EA.

Neural Networks in Trading: Scene-Aware Object Detection (HyperDet3D)
We invite you to get acquainted with a new approach to detecting objects using hypernetworks. A hypernetwork generates weights for the main model, which allows taking into account the specifics of the current market situation. This approach allows us to improve forecasting accuracy by adapting the model to different trading conditions.

Developing a Replay System (Part 65): Playing the service (VI)
In this article, we will look at how to implement and solve the mouse pointer issue when using it in conjunction with a replay/simulation application. The content presented here is intended solely for educational purposes. Under no circumstances should the application be viewed for any purpose other than to learn and master the concepts presented.

Reimagining Classic Strategies (Part 14): High Probability Setups
High probability Setups are well known in our trading community, but regrettably they are not well-defined. In this article, we will aim to find an empirical and algorithmic way of defining exactly what is a high probability setup, identifying and exploiting them. By using Gradient Boosting Trees, we demonstrated how the reader can improve the performance of an arbitrary trading strategy and better communicate the exact job to be done to our computer in a more meaningful and explicit manner.

Trading with the MQL5 Economic Calendar (Part 7): Preparing for Strategy Testing with Resource-Based News Event Analysis
In this article, we prepare our MQL5 trading system for strategy testing by embedding economic calendar data as a resource for non-live analysis. We implement event loading and filtering for time, currency, and impact, then validate it in the Strategy Tester. This enables effective backtesting of news-driven strategies.

From Novice to Expert: Programming Candlesticks
In this article, we take the first step in MQL5 programming, even for complete beginners. We'll show you how to transform familiar candlestick patterns into a fully functional custom indicator. Candlestick patterns are valuable as they reflect real price action and signal market shifts. Instead of manually scanning charts—an approach prone to errors and inefficiencies—we'll discuss how to automate the process with an indicator that identifies and labels patterns for you. Along the way, we’ll explore key concepts like indexing, time series, Average True Range (for accuracy in varying market volatility), and the development of a custom reusable Candlestick Pattern library for use in future projects.

From Basic to Intermediate: SWITCH Statement
In this article, we will learn how to use the SWITCH statement in its simplest and most basic form. The content presented here is intended solely for educational purposes. Under no circumstances should the application be viewed for any purpose other than to learn and master the concepts presented.

Integrating AI model into already existing MQL5 trading strategy
This topic focuses on incorporating a trained AI model (such as a reinforcement learning model like LSTM or a machine learning-based predictive model) into an existing MQL5 trading strategy.
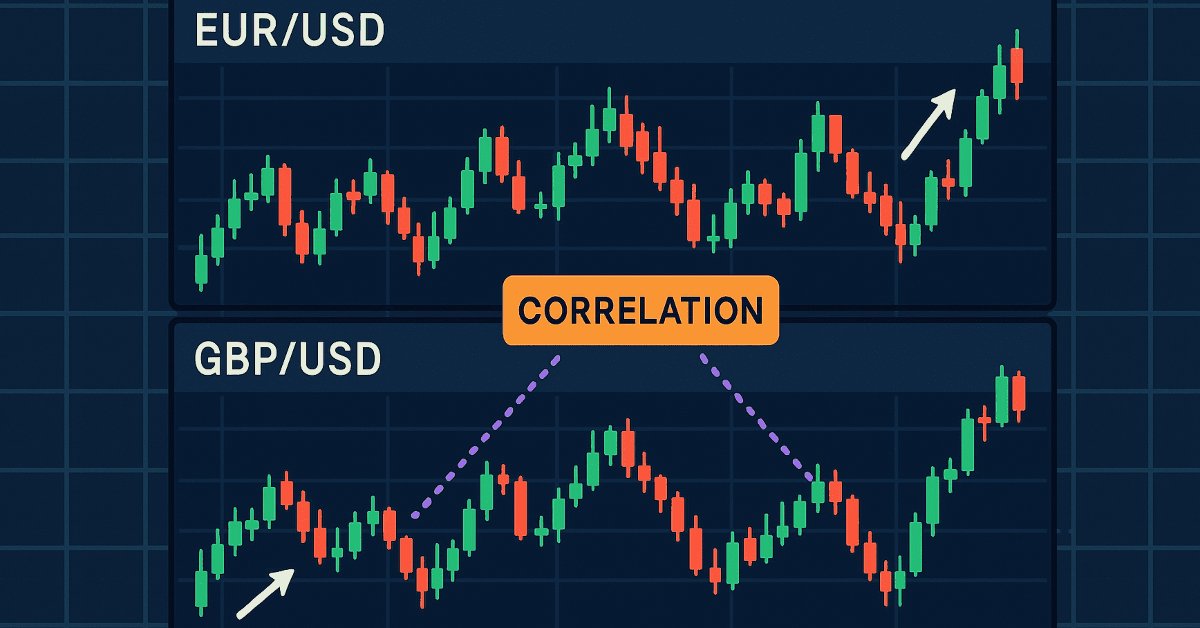
Price Action Analysis Toolkit Development (Part 20): External Flow (IV) — Correlation Pathfinder
Correlation Pathfinder offers a fresh approach to understanding currency pair dynamics as part of the Price Action Analysis Toolkit Development Series. This tool automates data collection and analysis, providing insight into how pairs like EUR/USD and GBP/USD interact. Enhance your trading strategy with practical, real-time information that helps you manage risk and spot opportunities more effectively.

Decoding Opening Range Breakout Intraday Trading Strategies
Opening Range Breakout (ORB) strategies are built on the idea that the initial trading range established shortly after the market opens reflects significant price levels where buyers and sellers agree on value. By identifying breakouts above or below a certain range, traders can capitalize on the momentum that often follows as the market direction becomes clearer. In this article, we will explore three ORB strategies adapted from the Concretum Group.

Neural Networks in Trading: Transformer for the Point Cloud (Pointformer)
In this article, we will talk about algorithms for using attention methods in solving problems of detecting objects in a point cloud. Object detection in point clouds is important for many real-world applications.

Formulating Dynamic Multi-Pair EA (Part 2): Portfolio Diversification and Optimization
Portfolio Diversification and Optimization strategically spreads investments across multiple assets to minimize risk while selecting the ideal asset mix to maximize returns based on risk-adjusted performance metrics.