MQL4 and MQL5 Programming Articles
Study the MQL5 language for programming trading strategies in numerous published articles mostly written by you - the community members. The articles are grouped into categories to help you quicker find answers to any questions related to programming: Integration, Tester, Trading Strategies, etc.
Follow our new publications and discuss them on the Forum!
Add a new article

You are missing trading opportunities:
- Free trading apps
- Over 8,000 signals for copying
- Economic news for exploring financial markets
Registration
Log in
You agree to website policy and terms of use
If you do not have an account, please register
MQL5 Wizard Techniques you should know (Part 74): Using Patterns of Ichimoku and the ADX-Wilder with Supervised Learning
We follow up on our last article, where we introduced the indicator pair of the Ichimoku and the ADX, by looking at how this duo could be improved with Supervised Learning. Ichimoku and ADX are a support/resistance plus trend complimentary pairing. Our supervised learning approach uses a neural network that engages the Deep Spectral Mixture Kernel to fine tune the forecasts of this indicator pairing. As per usual, this is done in a custom signal class file that works with the MQL5 wizard to assemble an Expert Advisor.

Developing a Replay System (Part 74): New Chart Trade (I)
In this article, we will modify the last code shown in this series about Chart Trade. These changes are necessary to adapt the code to the current replay/simulation system model. The content presented here is intended solely for educational purposes. Under no circumstances should the application be viewed for any purpose other than to learn and master the concepts presented.
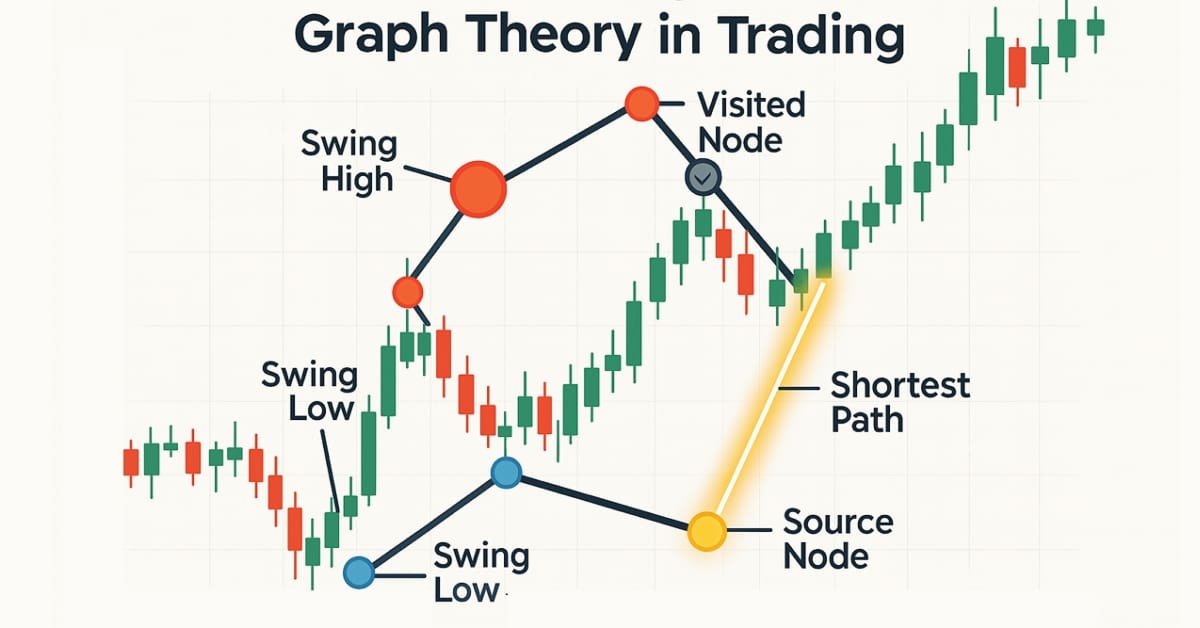
Graph Theory: Dijkstra's Algorithm Applied in Trading
Dijkstra's algorithm, a classic shortest-path solution in graph theory, can optimize trading strategies by modeling market networks. Traders can use it to find the most efficient routes in the candlestick chart data.
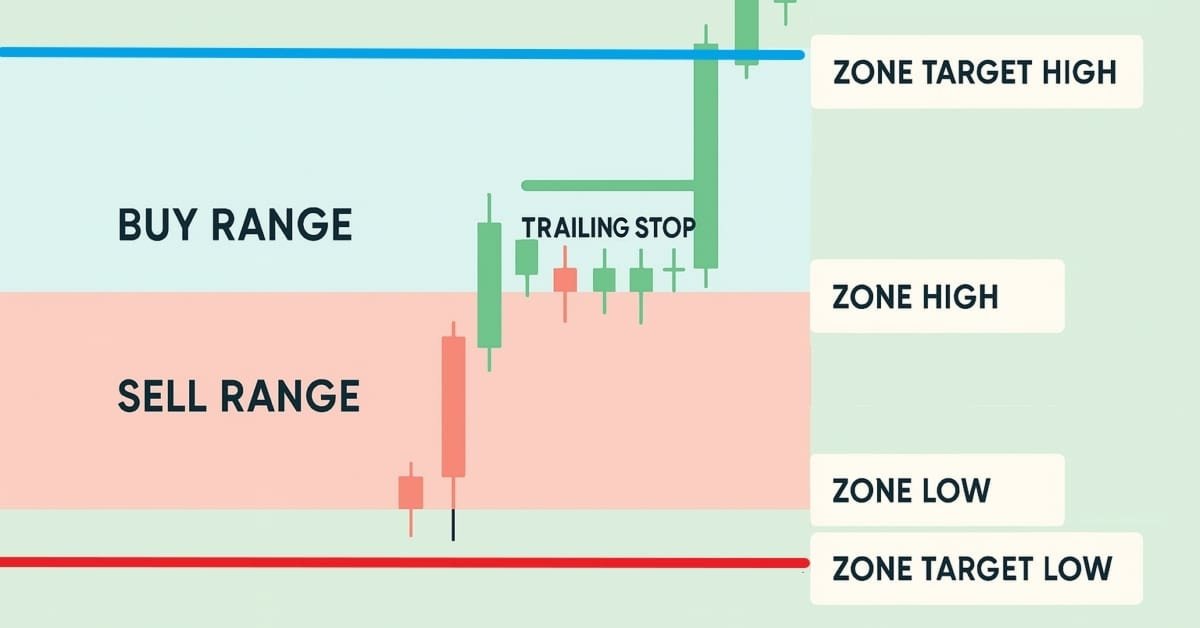
Automating Trading Strategies in MQL5 (Part 23): Zone Recovery with Trailing and Basket Logic
In this article, we enhance our Zone Recovery System by introducing trailing stops and multi-basket trading capabilities. We explore how the improved architecture uses dynamic trailing stops to lock in profits and a basket management system to handle multiple trade signals efficiently. Through implementation and backtesting, we demonstrate a more robust trading system tailored for adaptive market performance.

Neural Networks in Trading: Hyperbolic Latent Diffusion Model (Final Part)
The use of anisotropic diffusion processes for encoding the initial data in a hyperbolic latent space, as proposed in the HypDIff framework, assists in preserving the topological features of the current market situation and improves the quality of its analysis. In the previous article, we started implementing the proposed approaches using MQL5. Today we will continue the work we started and will bring it to its logical conclusion.

Arithmetic Optimization Algorithm (AOA): From AOA to SOA (Simple Optimization Algorithm)
In this article, we present the Arithmetic Optimization Algorithm (AOA) based on simple arithmetic operations: addition, subtraction, multiplication and division. These basic mathematical operations serve as the foundation for finding optimal solutions to various problems.

Formulating Dynamic Multi-Pair EA (Part 3): Mean Reversion and Momentum Strategies
In this article, we will explore the third part of our journey in formulating a Dynamic Multi-Pair Expert Advisor (EA), focusing specifically on integrating Mean Reversion and Momentum trading strategies. We will break down how to detect and act on price deviations from the mean (Z-score), and how to measure momentum across multiple forex pairs to determine trade direction.

From Basic to Intermediate: Union (I)
In this article we will look at what a union is. Here, through experiments, we will analyze the first constructions in which union can be used. However, what will be shown here is only a core part of a set of concepts and information that will be covered in subsequent articles. The content presented here is intended solely for educational purposes. Under no circumstances should the application be viewed for any purpose other than to learn and master the concepts presented.

Neural Networks in Trading: Hyperbolic Latent Diffusion Model (HypDiff)
The article considers methods of encoding initial data in hyperbolic latent space through anisotropic diffusion processes. This helps to more accurately preserve the topological characteristics of the current market situation and improves the quality of its analysis.

From Novice to Expert: Animated News Headline Using MQL5 (IV) — Locally hosted AI model market insights
In today's discussion, we explore how to self-host open-source AI models and use them to generate market insights. This forms part of our ongoing effort to expand the News Headline EA, introducing an AI Insights Lane that transforms it into a multi-integration assistive tool. The upgraded EA aims to keep traders informed through calendar events, financial breaking news, technical indicators, and now AI-generated market perspectives—offering timely, diverse, and intelligent support to trading decisions. Join the conversation as we explore practical integration strategies and how MQL5 can collaborate with external resources to build a powerful and intelligent trading work terminal.
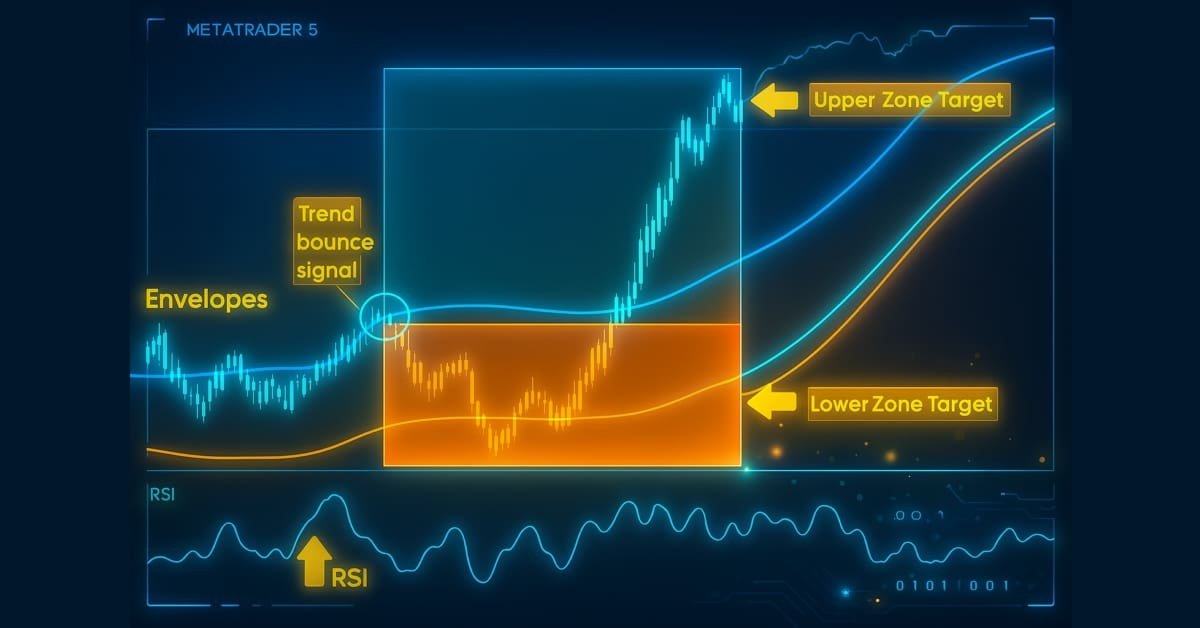
Automating Trading Strategies in MQL5 (Part 22): Creating a Zone Recovery System for Envelopes Trend Trading
In this article, we develop a Zone Recovery System integrated with an Envelopes trend-trading strategy in MQL5. We outline the architecture for using RSI and Envelopes indicators to trigger trades and manage recovery zones to mitigate losses. Through implementation and backtesting, we show how to build an effective automated trading system for dynamic markets

MQL5 Wizard Techniques you should know (Part 73): Using Patterns of Ichimoku and the ADX-Wilder
The Ichimoku-Kinko-Hyo Indicator and the ADX-Wilder oscillator are a pairing that could be used in complimentarily within an MQL5 Expert Advisor. The Ichimoku is multi-faceted, however for this article, we are relying on it primarily for its ability to define support and resistance levels. Meanwhile, we also use the ADX to define our trend. As usual, we use the MQL5 wizard to build and test any potential these two may possess.

Statistical Arbitrage Through Cointegrated Stocks (Part 1): Engle-Granger and Johansen Cointegration Tests
This article aims to provide a trader-friendly, gentle introduction to the most common cointegration tests, along with a simple guide to understanding their results. The Engle-Granger and Johansen cointegration tests can reveal statistically significant pairs or groups of assets that share long-term dynamics. The Johansen test is especially useful for portfolios with three or more assets, as it calculates the strength of cointegrating vectors all at once.

Using association rules in Forex data analysis
How to apply predictive rules of supermarket retail analytics to the real Forex market? How are purchases of cookies, milk and bread related to stock exchange transactions? The article discusses an innovative approach to algorithmic trading based on the use of association rules.

Developing a multi-currency Expert Advisor (Part 20): Putting in order the conveyor of automatic project optimization stages (I)
We have already created quite a few components that help arrange auto optimization. During the creation, we followed the traditional cyclical structure: from creating minimal working code to refactoring and obtaining improved code. It is time to start clearing up our database, which is also a key component in the system we are creating.

Implementing Practical Modules from Other Languages in MQL5 (Part 01): Building the SQLite3 Library, Inspired by Python
The sqlite3 module in Python offers a straightforward approach for working with SQLite databases, it is fast and convenient. In this article, we are going to build a similar module on top of built-in MQL5 functions for working with databases to make it easier to work with SQLite3 databases in MQL5 as in Python.

Price Action Analysis Toolkit Development (Part 30): Commodity Channel Index (CCI), Zero Line EA
Automating price action analysis is the way forward. In this article, we utilize the Dual CCI indicator, the Zero Line Crossover strategy, EMA, and price action to develop a tool that generates trade signals and sets stop-loss (SL) and take-profit (TP) levels using ATR. Please read this article to learn how we approach the development of the CCI Zero Line EA.
MQL5 Wizard Techniques you should know (Part 72): Using Patterns of MACD and the OBV with Supervised Learning
We follow up on our last article, where we introduced the indicator pair of the MACD and the OBV, by looking at how this pairing could be enhanced with Machine Learning. MACD and OBV are a trend and volume complimentary pairing. Our machine learning approach uses a convolution neural network that engages the Exponential kernel in sizing its kernels and channels, when fine-tuning the forecasts of this indicator pairing. As always, this is done in a custom signal class file that works with the MQL5 wizard to assemble an Expert Advisor.

Automating Trading Strategies in MQL5 (Part 21): Enhancing Neural Network Trading with Adaptive Learning Rates
In this article, we enhance a neural network trading strategy in MQL5 with an adaptive learning rate to boost accuracy. We design and implement this mechanism, then test its performance. The article concludes with optimization insights for algorithmic trading.

Atomic Orbital Search (AOS) algorithm: Modification
In the second part of the article, we will continue developing a modified version of the AOS (Atomic Orbital Search) algorithm focusing on specific operators to improve its efficiency and adaptability. After analyzing the fundamentals and mechanics of the algorithm, we will discuss ideas for improving its performance and the ability to analyze complex solution spaces, proposing new approaches to extend its functionality as an optimization tool.

Data Science and ML (Part 45): Forex Time series forecasting using PROPHET by Facebook Model
The Prophet model, developed by Facebook, is a robust time series forecasting tool designed to capture trends, seasonality, and holiday effects with minimal manual tuning. It has been widely adopted for demand forecasting and business planning. In this article, we explore the effectiveness of Prophet in forecasting volatility in forex instruments, showcasing how it can be applied beyond traditional business use cases.

From Novice to Expert: Animated News Headline Using MQL5 (III) — Indicator Insights
In this article, we’ll advance the News Headline EA by introducing a dedicated indicator insights lane—a compact, on-chart display of key technical signals generated from popular indicators such as RSI, MACD, Stochastic, and CCI. This approach eliminates the need for multiple indicator subwindows on the MetaTrader 5 terminal, keeping your workspace clean and efficient. By leveraging the MQL5 API to access indicator data in the background, we can process and visualize market insights in real-time using custom logic. Join us as we explore how to manipulate indicator data in MQL5 to create an intelligent and space-saving scrolling insights system, all within a single horizontal lane on your trading chart.

Moving Average in MQL5 from scratch: Plain and simple
Using simple examples, we will examine the principles of calculating moving averages, as well as learn about the ways to optimize indicator calculations, including moving averages.

Price Action Analysis Toolkit Development (Part 29): Boom and Crash Interceptor EA
Discover how the Boom & Crash Interceptor EA transforms your charts into a proactive alert system-spotting explosive moves with lightning-fast velocity scans, volatility surge checks, trend confirmation, and pivot-zone filters. With crisp green “Boom” and red “Crash” arrows guiding your every decision, this tool cuts through the noise and lets you capitalize on market spikes like never before. Dive in to see how it works and why it can become your next essential edge.

Volumetric neural network analysis as a key to future trends
The article explores the possibility of improving price forecasting based on trading volume analysis by integrating technical analysis principles with LSTM neural network architecture. Particular attention is paid to the detection and interpretation of anomalous volumes, the use of clustering and the creation of features based on volumes and their definition in the context of machine learning.

Mastering Log Records (Part 9): Implementing the builder pattern and adding default configurations
This article shows how to drastically simplify the use of the Logify library with the Builder pattern and automatic default configurations. It explains the structure of the specialized builders, how to use them with smart auto-completion, and how to ensure a functional log even without manual configuration. It also covers tweaks for MetaTrader 5 build 5100.
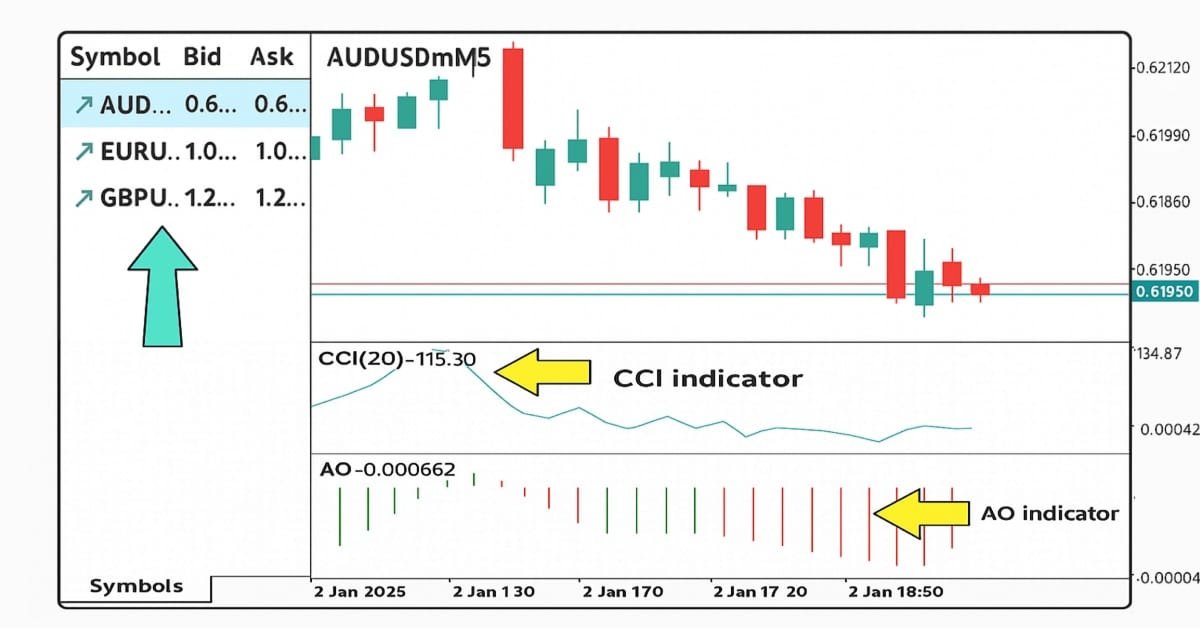
Automating Trading Strategies in MQL5 (Part 20): Multi-Symbol Strategy Using CCI and AO
In this article, we create a multi-symbol trading strategy using CCI and AO indicators to detect trend reversals. We cover its design, MQL5 implementation, and backtesting process. The article concludes with tips for performance improvement.

Self Optimizing Expert Advisors in MQL5 (Part 8): Multiple Strategy Analysis (2)
Join us for our follow-up discussion, where we will merge our first two trading strategies into an ensemble trading strategy. We shall demonstrate the different schemes possible for combining multiple strategies and also how to exercise control over the parameter space, to ensure that effective optimization remains possible even as our parameter size grows.

Fast trading strategy tester in Python using Numba
The article implements a fast strategy tester for machine learning models using Numba. It is 50 times faster than the pure Python strategy tester. The author recommends using this library to speed up mathematical calculations, especially the ones involving loops.

MetaTrader 5 Machine Learning Blueprint (Part 1): Data Leakage and Timestamp Fixes
Before we can even begin to make use of ML in our trading on MetaTrader 5, it’s crucial to address one of the most overlooked pitfalls—data leakage. This article unpacks how data leakage, particularly the MetaTrader 5 timestamp trap, can distort our model's performance and lead to unreliable trading signals. By diving into the mechanics of this issue and presenting strategies to prevent it, we pave the way for building robust machine learning models that deliver trustworthy predictions in live trading environments.

Sending Messages from MQL5 to Discord, Creating a Discord-MetaTrader 5 Bot
Similar to Telegram, Discord is capable of receiving information and messages in JSON format using it's communication API's, In this article, we are going to explore how you can use discord API's to send trading signals and updates from MetaTrader 5 to your Discord trading community.

Developing a Replay System (Part 73): An Unusual Communication (II)
In this article, we will look at how to transmit information in real time between the indicator and the service, and also understand why problems may arise when changing the timeframe and how to solve them. As a bonus, you will get access to the latest version of the replay /simulation app.

Developing Advanced ICT Trading Systems: Implementing Order Blocks in an Indicator
In this article, we will learn how to create an indicator that detects, draws, and alerts on the mitigation of order blocks. We will also take a detailed look at how to identify these blocks on the chart, set accurate alerts, and visualize their position using rectangles to better understand the price action. This indicator will serve as a key tool for traders who follow the Smart Money Concepts and the Inner Circle Trader methodology.

Installing MetaTrader 5 and Other MetaQuotes Apps on HarmonyOS NEXT
Easily install MetaTrader 5 and other MetaQuotes apps on HarmonyOS NEXT devices using DroiTong. A detailed step-by-step guide for your phone or laptop.

Atomic Orbital Search (AOS) algorithm
The article considers the Atomic Orbital Search (AOS) algorithm, which uses the concepts of the atomic orbital model to simulate the search for solutions. The algorithm is based on probability distributions and the dynamics of interactions in the atom. The article discusses in detail the mathematical aspects of AOS, including updating the positions of candidate solutions and the mechanisms of energy absorption and release. AOS opens new horizons for applying quantum principles to computing problems by offering an innovative approach to optimization.

Data Science and ML (Part 44): Forex OHLC Time series Forecasting using Vector Autoregression (VAR)
Explore how Vector Autoregression (VAR) models can forecast Forex OHLC (Open, High, Low, and Close) time series data. This article covers VAR implementation, model training, and real-time forecasting in MetaTrader 5, helping traders analyze interdependent currency movements and improve their trading strategies.

Price Action Analysis Toolkit Development (Part 28): Opening Range Breakout Tool
At the start of each trading session, the market’s directional bias often becomes clear only after price moves beyond the opening range. In this article, we explore how to build an MQL5 Expert Advisor that automatically detects and analyzes Opening Range Breakouts, providing you with timely, data‑driven signals for confident intraday entries.

From Novice to Expert: Animated News Headline Using MQL5 (II)
Today, we take another step forward by integrating an external news API as the source of headlines for our News Headline EA. In this phase, we’ll explore various news sources—both established and emerging—and learn how to access their APIs effectively. We'll also cover methods for parsing the retrieved data into a format optimized for display within our Expert Advisor. Join the discussion as we explore the benefits of accessing news headlines and the economic calendar directly on the chart, all within a compact, non-intrusive interface.

MQL5 Wizard Techniques you should know (Part 71): Using Patterns of MACD and the OBV
The Moving-Average-Convergence-Divergence (MACD) oscillator and the On-Balance-Volume (OBV) oscillator are another pair of indicators that could be used in conjunction within an MQL5 Expert Advisor. This pairing, as is practice in these article series, is complementary with the MACD affirming trends while OBV checks volume. As usual, we use the MQL5 wizard to build and test any potential these two may possess.

Training a multilayer perceptron using the Levenberg-Marquardt algorithm
The article presents an implementation of the Levenberg-Marquardt algorithm for training feedforward neural networks. A comparative analysis of performance with algorithms from the scikit-learn Python library has been conducted. Simpler learning methods, such as gradient descent, gradient descent with momentum, and stochastic gradient descent are preliminarily discussed.