Articles on data analysis and statistics in MQL5
Articles on mathematical models and laws of probability are interesting for many traders. Mathematics is the basis of technical indicators, and statistics is required to analyze trading results and develop strategies.
Read about the fuzzy logic, digital filters, market profile, Kohonen maps, neural gas and many other tools that can be used for trading.
Add a new article

You are missing trading opportunities:
- Free trading apps
- Over 8,000 signals for copying
- Economic news for exploring financial markets
Registration
Log in
You agree to website policy and terms of use
If you do not have an account, please register

Other classes in DoEasy library (Part 72): Tracking and recording chart object parameters in the collection
In this article, I will complete working with chart object classes and their collection. I will also implement auto tracking of changes in chart properties and their windows, as well as saving new parameters to the object properties. Such a revision allows the future implementation of an event functionality for the entire chart collection.
Other classes in DoEasy library (Part 71): Chart object collection events
In this article, I will create the functionality for tracking some chart object events — adding/removing symbol charts and chart subwindows, as well as adding/removing/changing indicators in chart windows.
Other classes in DoEasy library (Part 70): Expanding functionality and auto updating the chart object collection
In this article, I will expand the functionality of chart objects and arrange navigation through charts, creation of screenshots, as well as saving and applying templates to charts. Also, I will implement auto update of the collection of chart objects, their windows and indicators within them.
Combination scalping: analyzing trades from the past to increase the performance of future trades
The article provides the description of the technology aimed at increasing the effectiveness of any automated trading system. It provides a brief explanation of the idea, as well as its underlying basics, possibilities and disadvantages.
Other classes in DoEasy library (Part 69): Chart object collection class
With this article, I start the development of the chart object collection class. The class will store the collection list of chart objects with their subwindows and indicators providing the ability to work with any selected charts and their subwindows or with a list of several charts at once.
Other classes in DoEasy library (Part 68): Chart window object class and indicator object classes in the chart window
In this article, I will continue the development of the chart object class. I will add the list of chart window objects featuring the lists of available indicators.
Other classes in DoEasy library (Part 66): MQL5.com Signals collection class
In this article, I will create the signal collection class of the MQL5.com Signals service with the functions for managing signals. Besides, I will improve the Depth of Market snapshot object class for displaying the total DOM buy and sell volumes.
Prices and Signals in DoEasy library (Part 65): Depth of Market collection and the class for working with MQL5.com Signals
In this article, I will create the collection class of Depths of Market of all symbols and start developing the functionality for working with the MQL5.com Signals service by creating the signal object class.
Prices in DoEasy library (Part 64): Depth of Market, classes of DOM snapshot and snapshot series objects
In this article, I will create two classes (the class of DOM snapshot object and the class of DOM snapshot series object) and test creation of the DOM data series.

Machine learning in Grid and Martingale trading systems. Would you bet on it?
This article describes the machine learning technique applied to grid and martingale trading. Surprisingly, this approach has little to no coverage in the global network. After reading the article, you will be able to create your own trading bots.

Self-adapting algorithm (Part IV): Additional functionality and tests
I continue filling the algorithm with the minimum necessary functionality and testing the results. The profitability is quite low but the articles demonstrate the model of the fully automated profitable trading on completely different instruments traded on fundamentally different markets.
Prices in DoEasy library (part 63): Depth of Market and its abstract request class
In the article, I will start developing the functionality for working with the Depth of Market. I will also create the class of the Depth of Market abstract order object and its descendants.

Neural networks made easy (Part 11): A take on GPT
Perhaps one of the most advanced models among currently existing language neural networks is GPT-3, the maximal variant of which contains 175 billion parameters. Of course, we are not going to create such a monster on our home PCs. However, we can view which architectural solutions can be used in our work and how we can benefit from them.
Prices in DoEasy library (part 62): Updating tick series in real time, preparation for working with Depth of Market
In this article, I will implement updating tick data in real time and prepare the symbol object class for working with Depth of Market (DOM itself is to be implemented in the next article).
Prices in DoEasy library (part 61): Collection of symbol tick series
Since a program may use different symbols in its work, a separate list should be created for each of them. In this article, I will combine such lists into a tick data collection. In fact, this will be a regular list based on the class of dynamic array of pointers to instances of CObject class and its descendants of the Standard library.
Prices in DoEasy library (part 60): Series list of symbol tick data
In this article, I will create the list for storing tick data of a single symbol and check its creation and retrieval of required data in an EA. Tick data lists that are individual for each used symbol will further constitute a collection of tick data.

Self-adapting algorithm (Part III): Abandoning optimization
It is impossible to get a truly stable algorithm if we use optimization based on historical data to select parameters. A stable algorithm should be aware of what parameters are needed when working on any trading instrument at any time. It should not forecast or guess, it should know for sure.

Neural networks made easy (Part 10): Multi-Head Attention
We have previously considered the mechanism of self-attention in neural networks. In practice, modern neural network architectures use several parallel self-attention threads to find various dependencies between the elements of a sequence. Let us consider the implementation of such an approach and evaluate its impact on the overall network performance.

Developing a self-adapting algorithm (Part II): Improving efficiency
In this article, I will continue the development of the topic by improving the flexibility of the previously created algorithm. The algorithm became more stable with an increase in the number of candles in the analysis window or with an increase in the threshold percentage of the overweight of falling or growing candles. I had to make a compromise and set a larger sample size for analysis or a larger percentage of the prevailing candle excess.

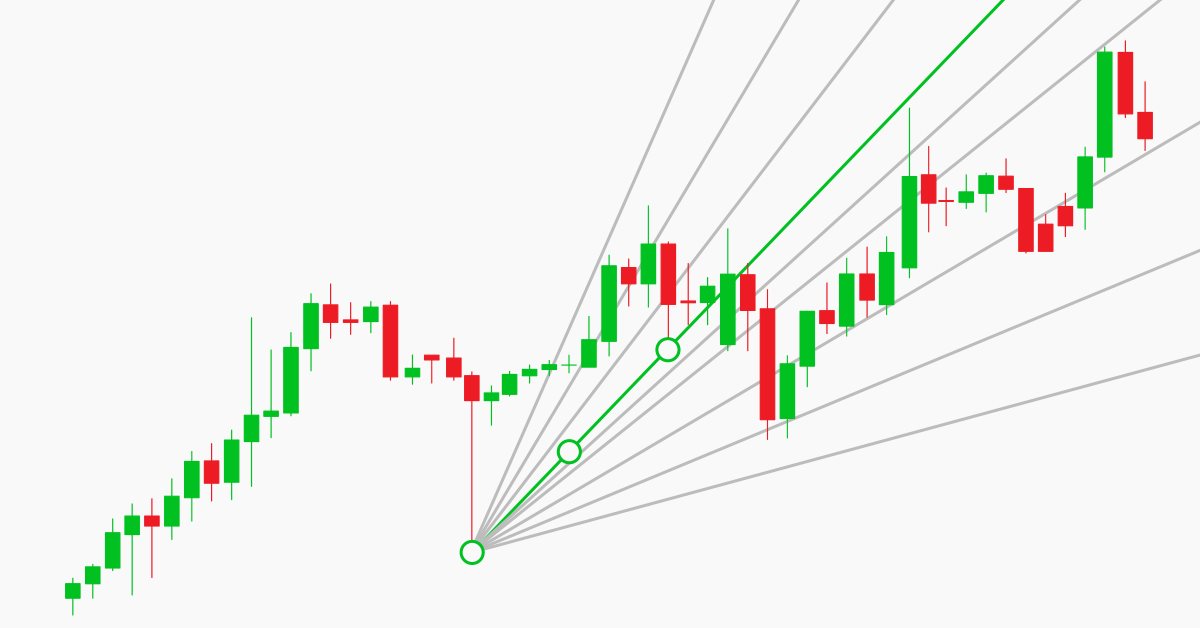
Brute force approach to pattern search (Part III): New horizons
This article provides a continuation to the brute force topic, and it introduces new opportunities for market analysis into the program algorithm, thereby accelerating the speed of analysis and improving the quality of results. New additions enable the highest-quality view of global patterns within this approach.

Finding seasonal patterns in the forex market using the CatBoost algorithm
The article considers the creation of machine learning models with time filters and discusses the effectiveness of this approach. The human factor can be eliminated now by simply instructing the model to trade at a certain hour of a certain day of the week. Pattern search can be provided by a separate algorithm.

The market and the physics of its global patterns
In this article, I will try to test the assumption that any system with even a small understanding of the market can operate on a global scale. I will not invent any theories or patterns, but I will only use known facts, gradually translating these facts into the language of mathematical analysis.

Neural networks made easy (Part 9): Documenting the work
We have already passed a long way and the code in our library is becoming bigger and bigger. This makes it difficult to keep track of all connections and dependencies. Therefore, I suggest creating documentation for the earlier created code and to keep it updating with each new step. Properly prepared documentation will help us see the integrity of our work.

Developing a self-adapting algorithm (Part I): Finding a basic pattern
In the upcoming series of articles, I will demonstrate the development of self-adapting algorithms considering most market factors, as well as show how to systematize these situations, describe them in logic and take them into account in your trading activity. I will start with a very simple algorithm that will gradually acquire theory and evolve into a very complex project.

Neural networks made easy (Part 8): Attention mechanisms
In previous articles, we have already tested various options for organizing neural networks. We also considered convolutional networks borrowed from image processing algorithms. In this article, I suggest considering Attention Mechanisms, the appearance of which gave impetus to the development of language models.
Prices in DoEasy library (part 59): Object to store data of one tick
From this article on, start creating library functionality to work with price data. Today, create an object class which will store all price data which arrived with yet another tick.

Using spreadsheets to build trading strategies
The article describes the basic principles and methods that allow you to analyze any strategy using spreadsheets (Excel, Calc, Google). The obtained results are compared with MetaTrader 5 tester.

Timeseries in DoEasy library (part 58): Timeseries of indicator buffer data
In conclusion of the topic of working with timeseries organise storage, search and sort of data stored in indicator buffers which will allow to further perform the analysis based on values of the indicators to be created on the library basis in programs. The general concept of all collection classes of the library allows to easily find necessary data in the corresponding collection. Respectively, the same will be possible in the class created today.
Manual charting and trading toolkit (Part II). Chart graphics drawing tools
This is the next article within the series, in which I show how I created a convenient library for manual application of chart graphics by utilizing keyboard shortcuts. The tools used include straight lines and their combinations. In this part, we will view how the drawing tools are applied using the functions described in the first part. The library can be connected to any Expert Advisor or indicator which will greatly simplify the charting tasks. This solution DOES NOT use external dlls, while all the commands are implemented using built-in MQL tools.

Brute force approach to pattern search (Part II): Immersion
In this article we will continue discussing the brute force approach. I will try to provide a better explanation of the pattern using the new improved version of my application. I will also try to find the difference in stability using different time intervals and timeframes.

How to make $1,000,000 off algorithmic trading? Use MQL5.com services!
All traders visit the market with the goal of earning their first million dollars. How to do that without excessive risk and start-up budget? MQL5 services provide such opportunity for developers and traders from around the world.

Neural networks made easy (Part 7): Adaptive optimization methods
In previous articles, we used stochastic gradient descent to train a neural network using the same learning rate for all neurons within the network. In this article, I propose to look towards adaptive learning methods which enable changing of the learning rate for each neuron. We will also consider the pros and cons of this approach.
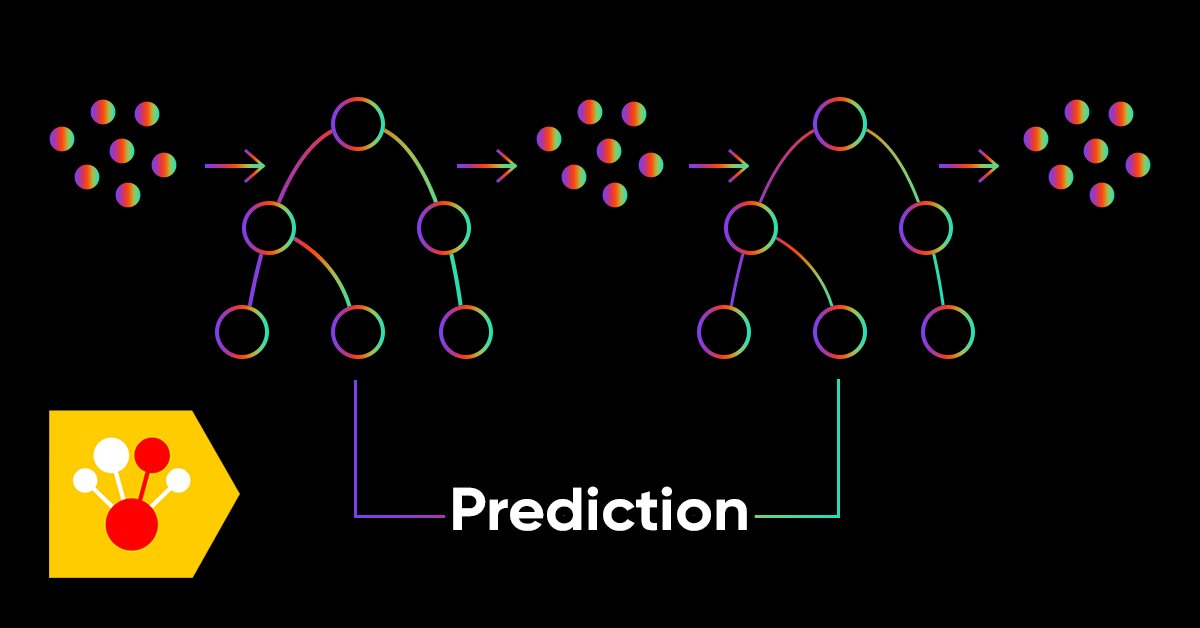
Gradient boosting in transductive and active machine learning
In this article, we will consider active machine learning methods utilizing real data, as well discuss their pros and cons. Perhaps you will find these methods useful and will include them in your arsenal of machine learning models. Transduction was introduced by Vladimir Vapnik, who is the co-inventor of the Support-Vector Machine (SVM).

Neural networks made easy (Part 6): Experimenting with the neural network learning rate
We have previously considered various types of neural networks along with their implementations. In all cases, the neural networks were trained using the gradient decent method, for which we need to choose a learning rate. In this article, I want to show the importance of a correctly selected rate and its impact on the neural network training, using examples.

Optimal approach to the development and analysis of trading systems
In this article, I will show the criteria to be used when selecting a system or a signal for investing your funds, as well as describe the optimal approach to the development of trading systems and highlight the importance of this matter in Forex trading.
Timeseries in DoEasy library (part 57): Indicator buffer data object
In the article, develop an object which will contain all data of one buffer for one indicator. Such objects will be necessary for storing serial data of indicator buffers. With their help, it will be possible to sort and compare buffer data of any indicators, as well as other similar data with each other.

Neural networks made easy (Part 5): Multithreaded calculations in OpenCL
We have earlier discussed some types of neural network implementations. In the considered networks, the same operations are repeated for each neuron. A logical further step is to utilize multithreaded computing capabilities provided by modern technology in an effort to speed up the neural network learning process. One of the possible implementations is described in this article.

Timeseries in DoEasy library (part 55): Indicator collection class
The article continues developing indicator object classes and their collections. For each indicator object create its description and correct collection class for error-free storage and getting indicator objects from the collection list.

Neural networks made easy (Part 4): Recurrent networks
We continue studying the world of neural networks. In this article, we will consider another type of neural networks, recurrent networks. This type is proposed for use with time series, which are represented in the MetaTrader 5 trading platform by price charts.

Timeseries in DoEasy library (part 54): Descendant classes of abstract base indicator
The article considers creation of classes of descendant objects of base abstract indicator. Such objects will provide access to features of creating indicator EAs, collecting and getting data value statistics of various indicators and prices. Also, create indicator object collection from which getting access to properties and data of each indicator created in the program will be possible.