
Optimal approach to the development and analysis of trading systems

Introduction
Currently, Forex trading is becoming more and more popular, new signals and trading systems are emerging constantly. This is inevitable, since there have always been a lot of people who want to make quick and easy money. With the expansion of the Internet infrastructure around the world, this market gets only bigger. This website is an illustrative example of this. It contains the most developed ecosystem with numerous functions allowing users to buy a product or a service, as well as to make money by contributing to the website development. In this article, I will highlight the criteria to be used when selecting products and signals, as well as the rules to be followed when developing and applying your own trading systems.
My philosophy
Let me tell you a bit about my motivation and the principles of my approach to constructing trading systems. I have developed multiple different EAs, mostly on MetaTrader 4, although it is time to get used to MetaTrader 5. Some systems have then been adapted for MetaTrader 5.
In terms of functionality, MetaTrader 5 leaves its predecessor far behind, of course. I believe that in order to understand the market, one should first of all combine theory and practice. MetaTrader 4 provides the necessary practice well enough.
I try to develop as simply and quickly as possible, and then look at the result. If the result resembles a pattern, I try to add filters, increase the signal strength and re-check the result. If it is improved, I try to delve into the process and find out the reasons behind improvement or deterioration.
Besides, it is necessary to develop different and, at the same time, simple systems to arrange a sort of an assembly line. Tinkering around with a single system for months in an attempt to make it perfect is a sure way to failure. Some traders also believe that the more inputs and other complexities the system has, the better. ) Actually, the opposite is true.
Some of the EAs I have developed contain 2000-3000 code strings and yield no results, while some of the working codes consisting of 20-50 strings work on the entire history across multiple currencies. ) The quality of your knowledge of the market is the main success factor here. Talented programmers are not the ones who are able to develop the most complex system imaginable, but the ones who understand their objectives and know what they actually need to add to the system.
Another advantage of this approach is that the simpler the output system is, the easier it is to fix and modify it. Another interesting feature is that an EA you have developed may eventually follow completely different logic which sometimes takes years to understand.
At the next level of knowledge, you begin to understand the market and almost all robots you develop become as simple as possible, while being as profitable and stable as possible. I am currently at this very level. I know what works and what does not, as well as what are the key issues to be addressed. After reaching this level, you realize that 99% of information circulating in the trading community is complete nonsense, including candlestick patterns and indicators. Some other information, like trend and flat, may look relatively credible but the trick is in the fact that it can be interpreted in various ways. So, if you lose, trading "experts" can always say that you have missed something or your trend line has been set incorrectly.
Instead of wasting time, we should start thinking what actually drives the price. Another necessary prerequisite is the knowledge of math and the ability to apply it when analyzing results, detecting reasonable regularities and understanding the physics behind them. All this can be achieved only by combining theory and practice. In the end, it all depends on the number of trading systems you have developed and tested. Do not use someone else's code, create your own from scratch. Also, do not think you can find a grail any time soon. I thought I could find it for several years. To think does not mean to know.
Signals, EAs, indicators
All of these tools are designed to help Forex traders and subscribers, and each of them can be beneficial if used correctly. In this regard, I believe that it is very important to have a correct understanding of each of these tools separately in order to form a correct vision of the situation as a whole. The most important thing is to understand that any service is only meant to give you a tool, not a solution. It is very important to understand what actually lies behind the price tag. Personally, I have long developed an understanding of these issues, and I believe that it may help someone. Another reason is that I want to share my thoughts about developing custom trading systems.
Signals
Signals are traded on real and demo accounts. Signals allow monitoring your own trading account and accounts of other traders, as well as subscribing to signals and copying deals of other traders. Personally, I do not recommend subscribing to signals where the average position holding time is less than one minute. The fact is that such short deals are either arbitrage or scalpers. In both cases, such strategies are very sensitive to ping, and even 10 milliseconds may be enough for a position to open in the wrong way. The longer the average deal duration, the less your deals differ from the original ones.
Let me provide examples of bad and good signals below:
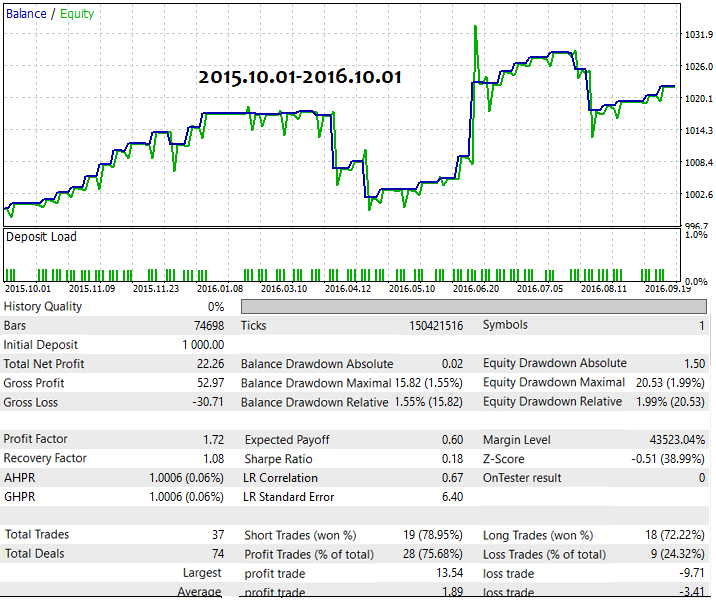
Safe signal:
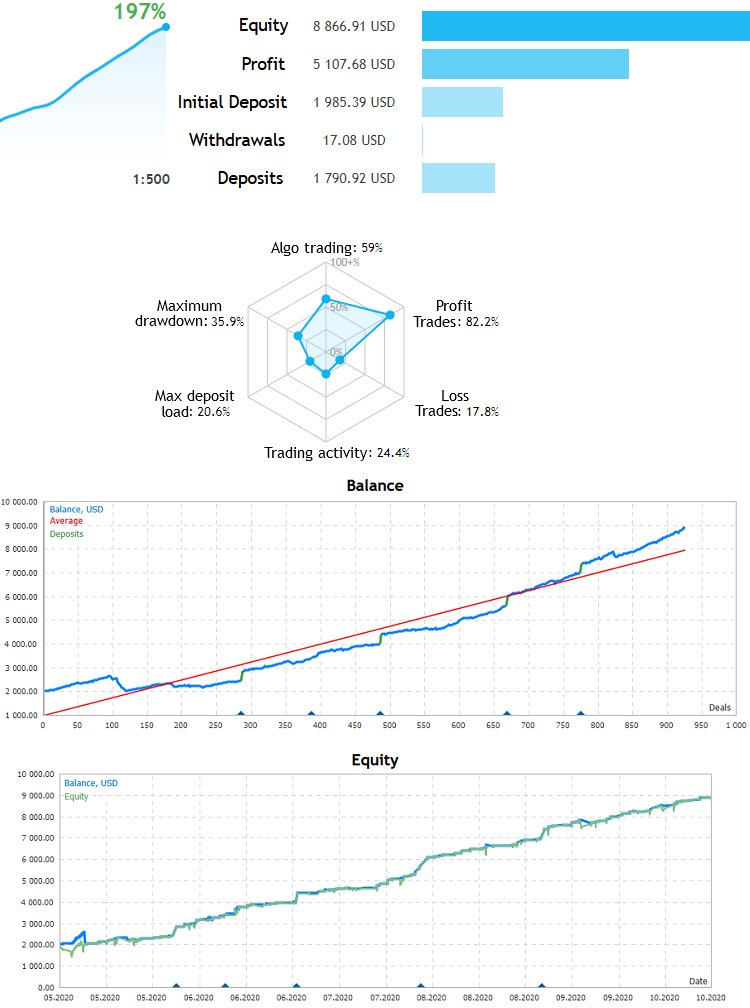
It is safe because the equity line is as close to the balance line as possible meaning it features no protracted deals, positions are opened and closed in turn, there are no martingale and grid. It is clear that the signal is stable. It strongly resembles a straight line and features a relatively small load on the deposit and a high percentage of profitable deals.
The next signal:
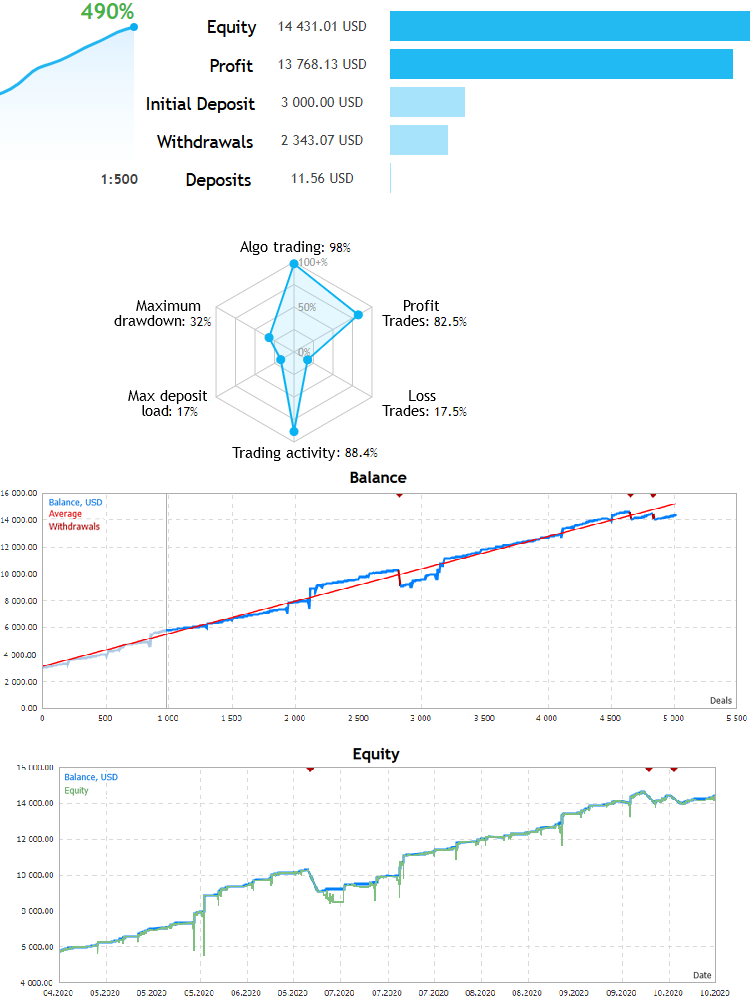
The signal is also quite good, but large green downward peaks indicate that the system actively applies martingale. The beginning of the test features a couple of peaks which potentially could destroy the entire profit earned. There are no guarantees that this will not happen again. It may turn out that the entire deposit will be blown away. Despite this, the Market has a very large selection of signals, and you can find quite good specimens.
Expert Advisors
No one will ever publish a stable and profitable EA on the Market without the consideration that selling this EA will bring much more than just using it by the developer. Another possible option is that the developer is not sure of the system and does not want to take risks investing large amounts of money. Instead, he or she trades with small funds cutting the risks. In order for the purchase of an EA to pay off, you will need a large deposit. For example, if you rent an EA presumably bringing $200 from the initial $100 at the cost of $200, you will get nothing even if the EA remains operational.
The predicted profit should be at least several times higher than the EA price. Besides, keep in mind that no one can guarantee that the EA's performance remains profitable for the necessary period. The multi-currency nature serves as an additional advantage for the EA. If it works at least on several currency pairs, then it applies the market physics greatly increasing the chances of profit. As an example, I will show the performance of my recent system and one of the results in the table in the form of a real test.
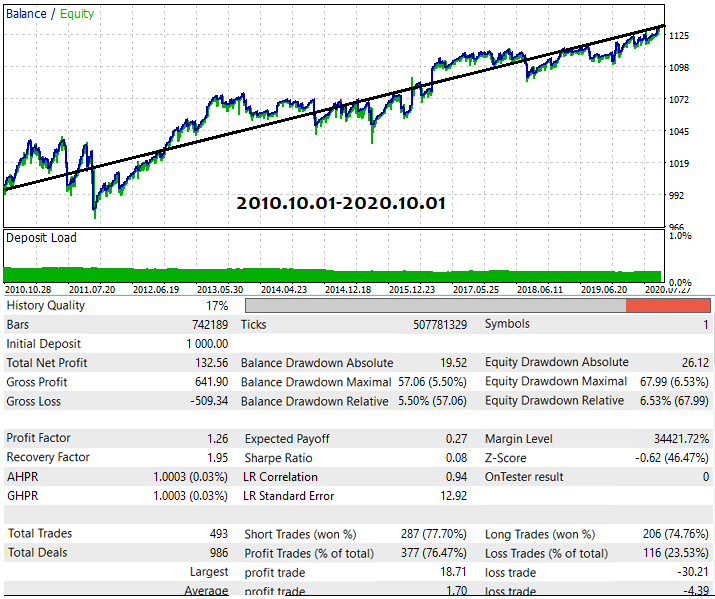
First, I will show the general EA testing table on the last 10 years of history of the main currency pairs:
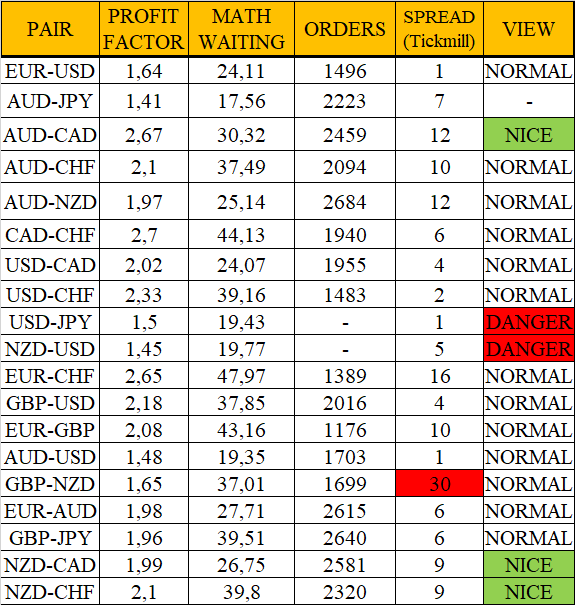
All these results have been achieved by using a single set file with no adjustments for any specific currency pair and with no optimization.
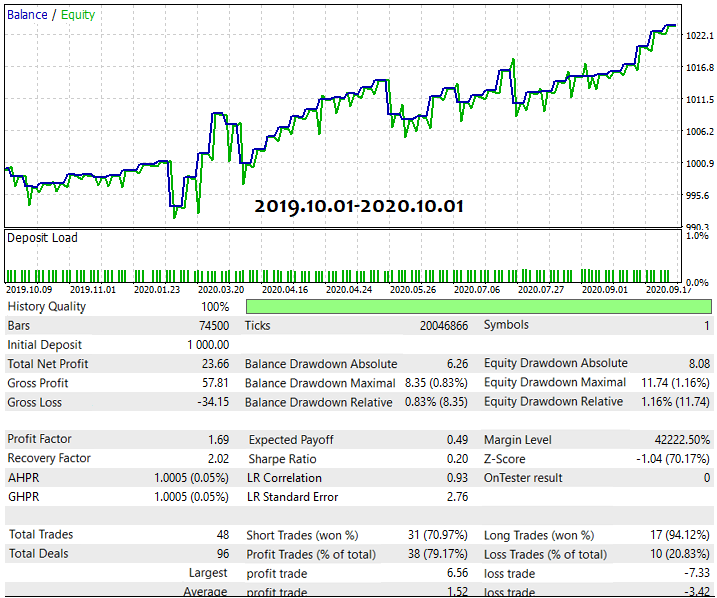
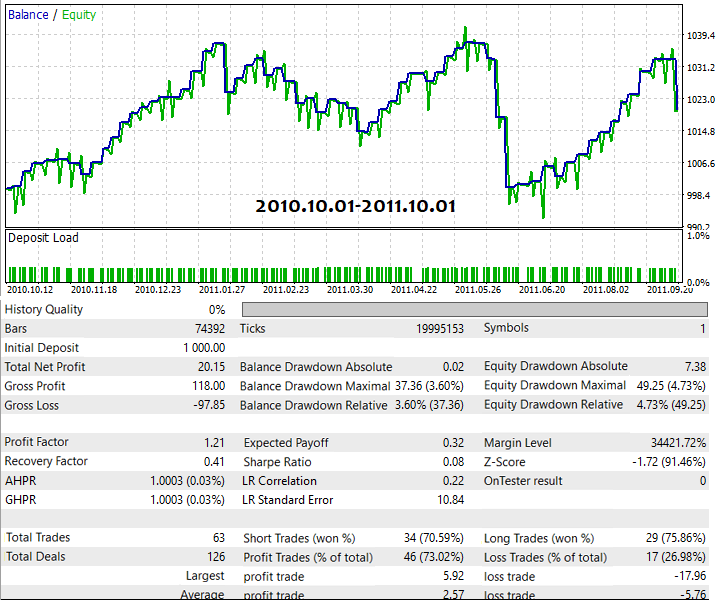
Below is one of the options provided in the table:
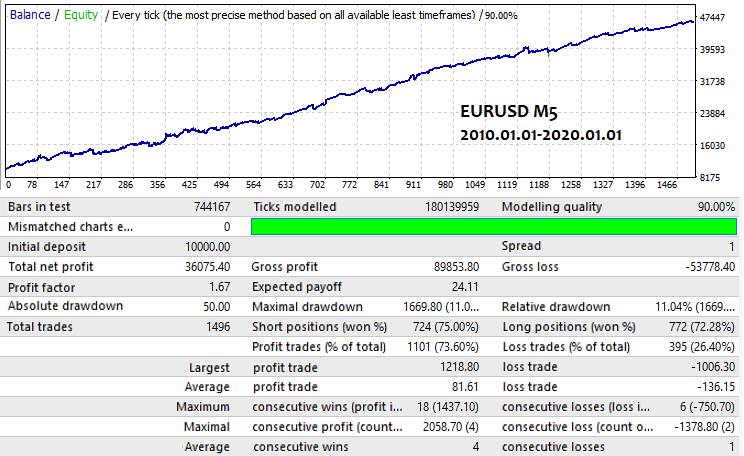
This option confirms that this is not just a random table. Besides, it demonstrates the results that can be achieved using an automated trading system. It is quite difficult to find such EAs in the Market, so I have decided to show my own results. This EA is not present in my products yet. The fixed lot of 1 was used in trading.
Indicators
My attitude to indicators is mostly negative. I believe, they are more suited for manual trading. Although it is possible to integrate them into a code, they work extremely slowly and, generally, represent a slightly changed price. This is natural when the indicator is drawn in the quote window. As for indicators in a separate window, they mostly calculate a function or perform recurrent calculations, i.e. the following values are calculated from the previous ones. In both cases, the efficiency of these tools is severely limited.
You should never count on a signal in the form of indicators' crossing. This is only a psychological moment and nothing more. I think that the most useful indicators are the ones that detect the market geometry (patterns). They should have a sound signal. Anyway, a trader should always make the final decision about following or not following a pattern.
If it had been possible to develop an indicator detecting entry points correctly, then an EA based on it would have been created long ago. All indicators I tested (including the ones I developed) do not show entry points. EAs based on them turned out to be useless. They are mostly useful as auxiliary tools for clarification, and, honestly speaking, for calming trader's mind. Traders want to remain sure both about entry and exit.
Below is an example of my indicator:
The indicator illustrates a non-standard approach. It defines simple math functions, looks for them on the chart and notifies you if they are detected. Again, this indicator is only a tool designed to save your time. These indicators can be useful in manual trading, but the final decision is always yours.
After the short tour into additional features of investing and trading, it is time to have a look at testing and development in terms of math for a deeper understanding.
Math behind the optimal search
If the ultimate goal of the development is to obtain the n number of systems that meet our requirements, then the first question is how complex the system should be to maximize the efficiency of our work? Here, the eficiency is the probability of the initial prototype falling within the prototype criteria I have defined. In other words, the prototype should provide certain parameters at the initial stage already, while working on a certain pair or several pairs. Personally, I always consider the multi-currency nature as a mandatory criterion. As a result, it all boils down to some kind of dependence, which cannot be reliably determined, but it can be roughly probed through experiments:
- Ps=Ps(L)
where L is a number of working code strings. In other words, the probability of the first parameters of the created system being in the acceptable range directly depends on the amount of code we write. You may think that the more strings the system has the better, but this is not always the case. Keep in mind that:
- T=K*L
The more the strings, the more it takes to complete the development. But our top priority is not the number of code strings but their efficiency and how many working systems we can develop in a unit of time. This parameter affects all the remaining ones:
- E= Ps/T
- E --> Max
In other words, we should maximize the E parameter in all possible ways. The main two ways are to improve the quality of the market knowledge and find the optimal prototype code size. Defining the prototype size, as well as the market knowledge and the ability to apply it provide a certain E0. It can be used as an indicator of your efficiency. Besides, we obtain an average time it takes to develop one system.
The development is always followed by testing and modification. These processes also have their own probability. In our case, it is the probability of successful modification+optimization. One is inseparable from the other. It is impossible to make corrections and modifications without testing. As a result, it all comes down to several repetitive cycles of "testing-analysis-modification". As a result, we either discard the system, or improve it and keep it for ourselves for application or selling.
Also, keep in mind that optimizing your approach to development and initial testing does not guarantee that you will find at least one such system. All you can count on is the maximum chance of getting the desired result, and you need to know how much time you have for development and initial testing. Using Bernoulli's equation, we can write as follows:
- Pa=Sum(m0...m...n)[C(n,m)*Pow(Ps ,m)*Pow(1-Ps ,n-m)]
- m0 - minimum number of satisfactory prototypes
- Pa — probability of obtaining at least "m0" or more from "n" development cycles
- n — maximum available number of cycles of searching for working prototypes
I use the sum in the equation since I am also satisfied by those options where the number of satisfactory prototypes turns out to be more than I need. The equation I will provide later applies the same idea.
Make sure not to overestimate your capabilities here. Also, do not expect a lot of good prototypes. Even if you find them, no one can guarantee they will work the way you want. You can count on many simple prototypes, or you can count on more complex ones. The choice is yours. I rely on simple ones.
While modifying and testing, there are also parameters that can and should be maximized. I will start with the probability of finding an acceptable option in the testing scheme. The entire process of finding acceptable results from the initially selected prototype ultimately merges into a single testing-modification-optimization process. It is a batch process that can be described using Bernoulli's equation:
- Pf= Sum(1...m...n)[C(n,m)*Pow(Po,m)*Pow(1-Po,n-m)]
- Po — probability of getting an acceptable result during an iteration
- n — maximum available number of search cycles
I assume that we need at least one satisfactory event while looking for acceptable results. In other words, we have a certain amount of time for testing and revision, which ultimately translates into the number of available iterations (test or modification) in order to find something more in the prototype than the initial result, and this result should suit us. Getting Pf is not mandatory as the rational use of time is more important:
- Ef= Pf/m
- Ef--> Max
At the current stage, it is important to maintain the balance between editing and testing and define how a certain parameter affects the final result and whether there is any sense in further testing. Tests and improvements always take roughly the same time, so "m" is a number of tests you should define on your own using your intuition or experience. There are no specific guidelines or recommendations here. Of course, it is possible to adhere to the standard algorithm, in which you take "n" cycles and see the results but in many cases it is possible to reduce the number of iterations and, for example, discard the system at the initial stage, or, conversely, decide that it is efficient and flexible. I always try to stick to this particular approach, because it saves time. Time is the most valuable thing we have. Based on the previous findings, we can create a more complete and general measure of the development efficiency considering that you use "m" tests instead of full "n" ones on average:
- ET= ( Ps*Pf)/(TSumm)
- TSumm = T + m*Tm
- Tm — average cycle time (testing-modification-optimization)
Since the events of the Pf and Ps probabilities are inconsistent, we have the right to compare a new event space, in which a new event is finding the prototype. The comparison is then followed by a successful improvement basically meaning an acceptable trading system has been found. Therefore, we multiply the probabilities to get the probability of a given event.
But we also know that every detected option requires "T" prototype development time and "m*Tm" improvement time. The more the probability of success related to one full development cycle, the more effective the approach. In many ways, the final time depends on the testing time. Initially, I made tick-based robots, but I recommend everyone to develop bar-based prototypes. First, you will speed up your tests several times, and second, you will get away from ticks and will not waste time on tests with real ticks greatly accelerating your development. Now it is time to analyze the most important strategy criteria.
Main strategy parameters
There are certain quantitative values for evaluating the quality of the strategy reflecting its certain parameters. Some values are more important than others, but, generally, they are able to say everything about the strategy. There are the following quantitative strategy parameters:
- Expected payoff
- Profit factor
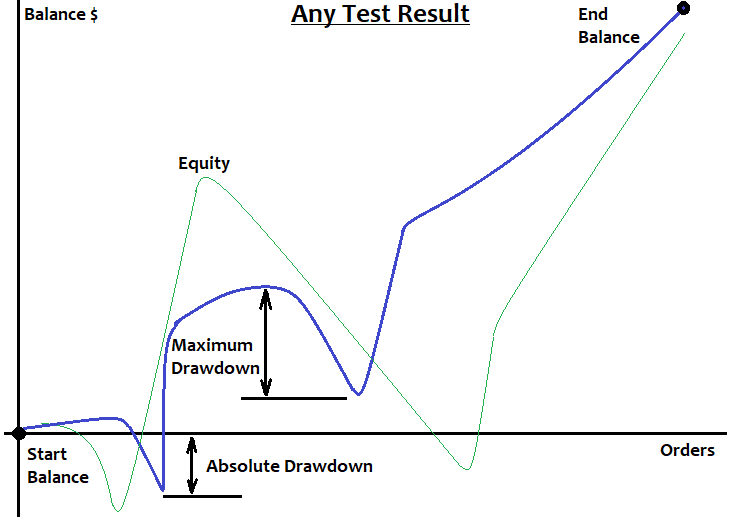
- Absolute drawdown
- Relative drawdown
- Maximum drawdown
- Recovery factor
- Percentage of profitable trades
Expected payoff
Expected payoff is the most important parameter of any EA or manual trading system. If you have no decent expected payoff, your have no chance to succeed except for cases of pure luck. The expected payoff can be of two types: in points and deposit currency.
- M_Points=( Sum(1,n)(PrPoints[i]) - Sum(1,n)(LsPoints[i]) )/n
- M=( Sum(1,n)(Pr[i]) - Sum(1,n)(Ls[i]) )/n
where:
- PrPoints[i] — if the i th deal is profitable, then this is the profit amount in points
- LsPoints[i] — if the i th deal is loss-making, then this is the loss amount in points
- Pr[i] — if the i th deal is profitable, then this is the profit amount in the deposit currency
- Ls[i] — if the i th deal is loss-making, then this is the loss amount in the deposit currency
- n — number of deals
All values I am going to describe here, do not characterize a strategy with 100% accuracy, since, in order to accurately determine them, it is necessary that n tends to infinity. But even in case of a moderate amount of deals, all these values can tell us a lot about the strategy with a very high degree of reliability.
To ensure the strategy profitability, the value should exceed zero. At the same time, we should keep in mind that part of the profit is diminished by spread, commission and swap.
- PrPoints[i]=PrPoints_0[i] - (SpreadOpen[i]/2 + SpreadClose[i]/2) - (OrderComission[i]/OrderLots[i])/TickValue + (OrderSwap[i]/OrderLots[i])/TickValue
- Pr[i]=Pr_0[i] - (SpreadOpen[i]/2 + SpreadClose[i]/2)*OrderLots[i])*TickValue - OrderComission[i] + OrderSwap[i]
TickValue needs a special mention here. This is the price of one point of the deposit provided that we use the lot of 1. This value is different for all currency pairs and is taken so that the minimum price change yields the integer TickValue. In fact, this is the most important parameter of the strategy, since the spread is essentially a part of the expected payoff that goes to the broker. Therefore, we should pay the utmost attention to it. If the expected payoff only slightly exceeds the spread, all other strategy parameters do not matter.
Profit factor
The profit factor is the second most important parameter of your strategy. If you have obtained a good expected payoff, this is the next parameter you should focus on since it reflects the quality of your signal or, in other words, the forecast quality. The greater the total amount of profit from your deals and the smaller their total loss, the greater the parameter value.
- PrFactor = Sum(1,n)(Pr[i]) / Sum(1,n)(Ls[i])
As we can see, if the denominator of the equation turns to zero, then the profit factor cannot be calculated, or, formally, it can be assumed that this is the limit when the denominator tends to zero from the positive part of the argument. The limit is plus infinity. This means that if there are no unprofitable deals, this indicator turns to infinity, and if there are no profitable deals, the indicator turns to 0. So, the range of values is [0,+infinity]. The average value is 1. Everything that exceeds it is profitable, everything that is less is loss-making.
The next two parameters reflect the same thing, but in slightly different ways.
Maximum drawdown
Maximum drawdown is the maximum difference between two adjacent equity highs and lows, if we assume that a high comes first. If we set the peak array prices as PriceExtremum[i], then the maximum drawdown is:
- MaximumDrawdown = MaxOf( PriceExtremum[i+1]- PriceExtremum[i] )
If you have two or more strategies with the same final profit, choose the one with the least maximum drawdown. The next parameter reflects that without the need to make this assumption:
Recovery factor
This parameter is almost identical to the previous one except that the profit is present in the equation:
- RecoveryFactor = TotalProfit/MaximumDrawdown
I believe, this parameter is more informative. The higher the recovery factor, the more stable the strategy. For example, the higher the parameter, the more a strategy is suitable for using martingale because the sequence of losses becomes smaller and we can start increasing the lot in case of losses without fear of losing the deposit.
Percentage of profitable trades
This parameter is only relevant when the value of an average profitable trade is very close or equal to the value of an average losing trade. We are accustomed to the level of 50%. All values exceeding it indicate that the strategy is profitable, otherwise, it is a loss-making one. Personally, I recommend using 60%. I believe, this level is quite important, especially for a manual trading system since this parameter greatly affects any trader. But this parameter does not reveal the profit factor. Moreover, this parameter is not always informative.
- WinPercent= (100*NProfit)/(NProfit + NLoss)
Absolute drawdown
This parameter is important in case your strategy implies a heave load on your deposit or the balance curve is not similar to a straight line, but rather to a chaotic mess with only a slight inclination towards profit, or at least if there are some prerequisites to this in the future. It may seem to someone that the absolute drawdown is able to indicate the minimum deposit allowing us to save funds from ruin but this is a delusion, and I would not advise anyone to stick to the idea. This value is equal to the difference between the starting balance and the bottom point on the balance graph within the tested or traded segment:
- AbsoluteDrawdown = StartBalance - MinimumBalance
I think, this parameter is more informative than the profitability or stability of a trading system since it considers the total profit. The difference is roughly the same as between the maximum drawdown and the recovery factor:
- 100*AbsoluteDrawdown/EndProfit
The value is measured as a percentage and shows how much the absolute drawdown affects the final profit. The informative value of this factor is also very limited. The less the value, the better the strategy.
Other strategy parameters
Below are some less important strategy parameters. However, they should not be underestimated
- Maximum profit
- Maximum loss
- Average profit
- Average loss
- Maximum consecutive wins
- Maximum consecutive losses
- Average consecutive wins
- Average consecutive losses
Maximum profit
A deal with the maximum profit. This parameter can be either in the deposit currency or in points. It all depends on why we need the parameter. Its importance is rather abstract. The same can be said about the next parameter.
Maximum loss
A deal with the maximum loss.
Average profit
The sum of profits of all deals divided by the number of deals. This parameter is informative only if the expected payoff and the profit factor are positive.
- MiddleProfit= Sum(Pr[i])/n;
Average loss
The sum of losses of all deals divided by the number of deals:
- MiddleLoss= Sum(Ls[i])/n;
Maximum consecutive wins
This parameter is quite useful, because if it is limited from the above, then it is perfect for using a reverse martingale. The smaller the number of consecutive wins, the better for the reverse martingale.
Maximum consecutive losses
In contrast to the previous parameter, limiting the current one allows using the direct martingale. If you somehow manage to limit this value for any signal, then you will be able to make money quickly and safely using martingale without fear of losing your deposit.
Average consecutive wins
The parameter is almost identical to the percentage of winning trades. In fact, it reflects almost the same indicator of the trading system in a slightly different manner
- MiddleWins= Sum(Wins[i])/n
where Wins[i] is a length of a specific half-wave. If we divide the entire balance graph into rising and falling segments highlighting rising ones and calculating the number of trades in them, as well as the number of rising half-ways (n), it will be possible to calculate the parameter itself, which is nothing more than the arithmetic mean of certain half waves.
Average consecutive losses
The same parameter as the above. The only difference is that it considers negative half-waves:
- MiddleLosses= Sum(Loss[i])/n
My additions
I believe, there is yet another parameter, which provides more complete strategy evaluation:
- Linearity factor
It reflects the deviation of the balance curve from the straight line connecting the beginning and the end of the balance graph. The more the balance graph looks like a straight line when trading a fixed lot, the better the system. This gives a higher chance of high efficiency in the future. This parameter is especially useful when trading a fixed lot. The market volatility is constantly changing, which means the average candle size (the overall market dynamics) is changing as well. If we understand this, then we can say why the expected payoff of some strategies decreases by the end of the test or, conversely, the graph is very curved leaving no guarantees that the slope angle, and hence the expected payoff, will remain stable.
- LinearFactor = MaxDeviation/EndBalance
- MaxDeviaton = Max(MathAbs(Balance[i]-AverageLine))
- AverageLine=StartBalance+K*i
- K=(EndBalance-StartBalance)/n
- n - number of deals in the test
The reason such parameters are absent in the MetaTrader 4 and MetaTrader 5 strategy testers is very simple. In order to calculate such parameters, you always need two runs since they feature the final profit. The lower the parameter, the better the strategy. If you wish, you may measure it in %.
The image below provides some explanation:
What indicators to focus on when testing or reviewing a system?
I believe, there are only a few basic system parameters worth focusing on:
- Expected payoff in points
- Profit factor or its equivalent
- Maximum drawdown
- Maximum consecutive losses
- Linearity factor
Other parameters are very difficult to use as an additional information about a system or market. In any case, I have not yet found algorithms able to apply them, and there are even no prerequisites for their use. I believe, there is no point in complicating things that are much simpler than they seem. This brings confusion and distracts from actually important things.
I will try to describe selecting these criteria in as simple manner as possible:
In order for the strategy to be profitable, it is necessary to provide the expected payoff in points to exceed spread+commission+swap measured in points. The expected payoff should preferably be two times the average spread+commission+swap. Then we will compensate the losses and get a profit greater than or equal to the parameter modulus.
After we are convinced of the strategy profitability, we should take care of the forecast quality, i.e. the profit factor. The more the indicator exceeds one, the better the forecast quality. The better the forecast quality, the greater the parameter affects all the remaining ones. If it had been possible to disregard the expected payoff, the profit factor would have been the most important parameter. It affects all other parameters directly or indirectly.
After obtaining suitable profitability, it is time to think about the maximum drawdown. This parameter defines the minimum deposit required to ensure the maximum profitability at the current deposit stage. Based on the maximum drawdown, we can choose the starting deposit in such a way as to ensure the maximum annual profit percentage without worrying about losing our deposit. If we are sure the maximum consecutive losses or the maximum drawdown have extreme values, it is possible to apply martingale in the signal without a fear of stop out.
The linearity factor makes sure this is a regularity, and not a random result. The more the graph resembles a straight line, the more likely it is that this is a real regularity or market feature.
The test time is also one of the underestimated parameters. The longer the tested segment and the more similar the profitability results, the higher the probability that the system reflects a global pattern, rather than some random result.
Balance and equity
This topic is very important for beginners who do not see the difference between these values. Equity is the current floating profit, while the balance is the current fixed one. Traders often look at the balance line rather than at the equity. In good trading systems, equity is located as close to the balance line as possible. This suggests that the strategy does not apply grid, martingale or pyramiding. I am not implying these methods do not work but they need a good signal. I dwell more on this in my previous articles. In the MetaTrader 5 strategy tester and MQL5 website, the balance line is displayed in dark blue, while the equity line is shown in green. The closer the equity line to the balance one, the safer the strategy provided that both lines go up.
Real trading system parameters and viability
I consider this matter based on my practice and actual trading systems I developed. I want to protect you from investments in signals or EAs that only show a nice picture and nothing more. In my humble experience, systems that have been tested for less than 10 years of history have an increased risk of ending up in a loss. This is even more true if a tested segment is two years or less.
My experience tells me that the system capable of trading with profit throughout its history has approximately 5-50 points of the expected payoff, while the profit factor lies in the range of 1.05-3.0. I really like the M5 timeframe, since all functioning systems that I created work on this timeframe, and you can also run them on M1 if you want. This is also a very good chart, probably because it contains the smallest bars with the highest amount of data per unit of time ( High[i],Low[i],Close[i],Open[i] ). These bar points are actually saved real ticks. The shorter the chart period, the more real ticks are saved inside candles. For many systems, this is of great importance when checking a system in the tester unless you use real ticks in your test.
Personally, I never use real ticks. All my EAs are based on bar closure and I don't need to worry about artificial tick generation, because bar closing is always a real tick. The average profit factor of my systems is around 1.2, while the expected payoff is about 15 points because I use fairly small timeframes. It is much more difficult to find something that works on high timeframes. You may raise the expected payoff but not the profit factor.
Many sellers claim that EA optimization is paramount indicating a certain predicted time before a re-optimization. Do not be fooled by such statements, since it is impossible to predict the time of the EA's work in the future by any means. I also advise you to forget the word "optimization" until you learn how to use this tool. You are able to optimize anything obtaining the desired result, but most likely it will be the result of randomness. Optimization requires a thorough approach. I hardly use this tool at all checking everything manually instead. The human brain is a much more efficient system than a blunt enumeration of parameters.
How to properly test the system
I use the following approach to test both my own and other people's systems (although in 99% of cases I test my own systems):
For the first test, I always select the last year from the current date, or a little more. If I like the test results, I take a few more segments. Keep in mind that comprehensive analysis requires a segment of at least 10 years. A 20-year segment is better.
If the first and last years are good, take a couple of segments closer to the middle. If the results there are acceptable as well, test all 10 years and assess the balance curve and equity. If they resemble a straight line, the system deserves attention. This approach has a single goal - save time and maximize the quality of the resulting systems.
After conducting the analysis, it is time to determine further actions. To strengthen the confidence in the system even further, it should be tested on several other currency pairs. If it at least retains some part of its efficiency there, then it is based on the market physics and can be improved. Check the main system parameters one by one and define how they affect the result. In most cases, it turns out that the influence of a particular parameter is almost completely independent of another one.
After achieving the best performance, it is time to test the system on a demo account. If the system shows an acceptable result on a demo account, then it can be tried on a real one. Another advantage of using bars is that the result on a demo account does not differ from the real one provided that the broker is competent. I personally recommend Alp***. I believe, you are able to insert the missing letters. Historical data of this broker is not distorted. I do not recommend testing tick robots as there are no guarantees there. Use only EAs based on bar openings or closures.
Bar parameters
To get a proper understanding of a quote, we need to define the bar or candle, and the data it contains, as well as what data we can obtain based on the look of the bar or candle. Bar (candle) is a tick history segment of a fixed length, which does not save all ticks but instead saves Open, Close, High and Low ticks, as well as the bar open time changed to datetime. This is the number of seconds that have passed since January 1, 1970. There are six values inside the bar:
- Close[]
- Open[]
- Low[]
- High[]
- Time[]
- Volume[]
The first four values are four ticks saved in the bar followed by bar open time and volume. The volume is the number of ticks fitting into the bar. Price data is most important, however do not forget about time and volumes. If you can handle this data correctly, you are able to find good signals. Bars and candles mean the same thing. The only difference is the graphical representation of the same values:
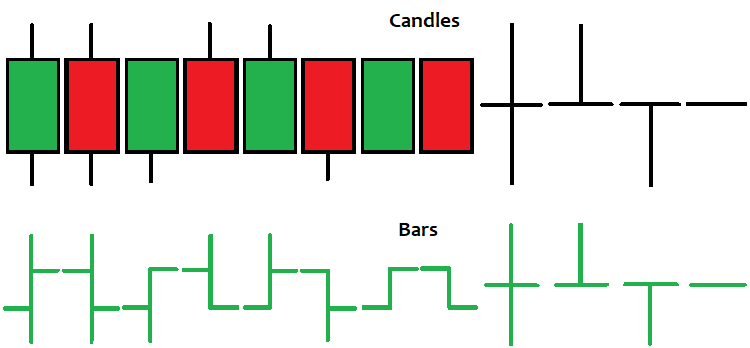
There are various methods of analyzing bars and candles. I do not recommend applying them too rigorously since this is only graphical data. It may be helpful only in tandem with indicators and other analysis methods.
Writing and testing a simple volume-based EA
Let's consider developing an EA using volumes and time corridors as an additional market data and trading restriction. Volume spikes allow us to detect important decisions made by market participants. The ability to limit the EA server operation time allows detecting areas where the volumes are of great importance. Let's write the EA and perform several tests and full analysis to draw conclusions about the system. The system itself is only needed to delve into the market parameters and study their relationships. The system is needed primarily to show that each bar parameter has its own weight and contributes to the overall quality of the system. The EA itself is attached to the article so that everyone is able to use and modify it if necessary.
Let's start from the well-known libraries for working with positions:
#include <Trade\PositionInfo.mqh>
#include <Trade\Trade.mqh>
CPositionInfo  m_position=CPositionInfo();// trade position object
CTrade         m_trade=CTrade();          // trading object
They are primarily needed to simplify the code. I believe, I do not need to explain their operation principles. The website has plenty of data about the topic.
Next, define the numbered list to be able to switch operation modes:
enum MODE_CALCULATE
   {
   MODE_1=0,
   MODE_2=1,
   MODE_3=2,
   MODE_4=3
   };
This is done with the expectation that there will be several modes in order to determine the most effective market equation. Initially, there should be some general ideas about what physics we want to exploit, but we do not know which equation will be most effective for our case. In the current EA, I have implemented four equation variants. We will see, which of the options describes the market in the best possible way. There is no point in producing too many modes. If our assumption is correct, we will certainly see that. I usually make no more than four modes.
Next, define the inputs and their objectives:
input MODE_CALCULATE MODEE=MODE_1;//Mode
input int TradeHour=0;//Start Trading Hour
input int TradeMinute=1;//Start Trading Minute
input int TradeHourEnd=23;//End Trading Hour
input int TradeMinuteEnd=59;//End Trading Minute

input bool bWriteValuesE=false;//Log
input int CandlesE=50;//Bars To Analyse
input int Signal=200;//Signal Power
input int PercentE=52;//Percent Signals To One Side

input bool bInvert=false;//Trade Invert

input int SLE=3000;//Stop Loss Points
input int TPE=3000;//Take Profit Points
input double Lot=0.01;//Lot

input int MagicF=15670867;//Magic
The operation mode is followed by the block having four parameters describing the server time corridor, within which we open positions (or a trading session). Strange as it may seem, this value defines a lot. Next is the block of operating parameters describing the most important system variables. If necessary, you can write in the log the data on the current states of the tracked values to be able to adjust inputs when switching the modes.
Next is the market segment in bars we are going to analyze. All candles that are deeper in history are not considered in the calculation. Next comes the signal strength having different scales for each mode. This is why we need the log. The final component is an additional signal control element. It may happen that the signal is large but there is no point in setting its power without understanding the percentage of the major part of the signal relative to all signals. The last variables allow us to invert trading, set stop loss and take profit, as well as define trading volume and magic number of all orders.
Add the following functions to calculate the values of all predefined arrays quickly and conveniently:
MqlTick LastTick;//the last tick

double High[];
double Low[];
double Close[];
double Open[];
datetime Time[];
long Volume[];

void DimensionAllMQL5Values()//prepare the arrays
   {
   ArrayResize(Time,CandlesE,0);
   ArrayResize(High,CandlesE,0);
   ArrayResize(Close,CandlesE,0);
   ArrayResize(Open,CandlesE,0);
   ArrayResize(Low,CandlesE,0);
   ArrayResize(Volume,CandlesE,0);
   }

void CalcAllMQL5Values()//recalculate the arrays
   {
   ArraySetAsSeries(High,false);
   ArraySetAsSeries(Low,false);
   ArraySetAsSeries(Close,false);
   ArraySetAsSeries(Open,false);
   ArraySetAsSeries(Time,false);
   ArraySetAsSeries(Volume,false);
   CopyHigh(_Symbol,_Period,0,CandlesE,High);
   CopyLow(_Symbol,_Period,0,CandlesE,Low);
   CopyClose(_Symbol,_Period,0,CandlesE,Close);
   CopyOpen(_Symbol,_Period,0,CandlesE,Open);
   CopyTime(_Symbol,_Period,0,CandlesE,Time);
   CopyTickVolume(_Symbol,_Period,0,CandlesE,Volume);
   ArraySetAsSeries(High,true);
   ArraySetAsSeries(Low,true);
   ArraySetAsSeries(Close,true);
   ArraySetAsSeries(Open,true);
   ArraySetAsSeries(Time,true);
   ArraySetAsSeries(Volume,true);
   }
I have already mentioned these functions in the previous articles, albeit in abridged form. Besides, there is also the LastTick variable here, which is to store the values of all parameters of the last tick arrived from the server. They are needed to access the arrays just like in MQL4.
The main variables and logic are placed in 'static class':
class TickBox
   {
   public:
   static int BarsUp;
   static int BarsDown;
   static double PowerUp;
   static double PowerDown;
   static double PercentUp;
   static double PercentDown;
   static double PercentPowerUp;
   static double PercentPowerDown;

   static void CalculateAll(MODE_CALCULATE MODE0)//calculate all the necessary parameters
      {
      BarsUp=0;
      BarsDown=0;
      PercentUp=0.0;
      PercentDown=0.0;
      PowerUp=0.0;
      PowerDown=0.0;
      if ( MODE0 == MODE_1 )
         {
         for ( int i=0; i<CandlesE; i++ )
            {
            if ( Open[i] < Close[i] )
               {
               BarsUp++;
               PowerUp+=(MathAbs(Open[i] - Close[i])/(High[i] - Low[i]))*Volume[i];
               }
            if ( Open[i] > Close[i] )
               {
               BarsDown++;
               PowerDown+=(MathAbs(Open[i] - Close[i])/(High[i] - Low[i]))*Volume[i];
               }
            }
         }

      if ( MODE0 == MODE_2 )
         {
         for ( int i=0; i<CandlesE; i++ )
            {
            if ( Open[i] < Close[i] )
               {
               BarsUp++;
               PowerUp+=(MathAbs(Open[i] - Close[i])/_Point)*Volume[i];
               }
            if ( Open[i] > Close[i] )
               {
               BarsDown++;
               PowerDown+=(MathAbs(Open[i] - Close[i])/-_Point)*Volume[i];
               }
            }
         }

      if ( MODE0 == MODE_3 )
         {
         for ( int i=0; i<CandlesE; i++ )
            {
            if ( Open[i] < Close[i] )
               {
               BarsUp++;
               PowerUp+=(double(CandlesE-i)/double(CandlesE))*(MathAbs(Open[i] - Close[i])/_Point)*Volume[i];
               }
            if ( Open[i] > Close[i] )
               {
               BarsDown++;
               PowerDown+=(double(CandlesE-i)/double(CandlesE))*(MathAbs(Open[i] - Close[i])/_Point)*Volume[i];
               }
            }
         }

      if ( MODE0 == MODE_4 )
         {
         for ( int i=0; i<CandlesE; i++ )
            {
            if ( Open[i] < Close[i] )
               {
               BarsUp++;
               PowerUp+=(double(CandlesE-i)/double(CandlesE))*(MathAbs(Open[i] - Close[i])/(High[i] - Low[i]))*Volume[i];
               }
            if ( Open[i] > Close[i] )
               {
               BarsDown++;
               PowerDown+=(double(CandlesE-i)/double(CandlesE))*(MathAbs(Open[i] - Close[i])/(High[i] - Low[i]))*Volume[i];
               }
            }
         }

      if ( BarsUp > 0 && BarsDown > 0 )
         {
         PercentUp=(double(BarsUp)/double(BarsUp+BarsDown))*100.0;
         PercentDown=(double(BarsDown)/double(BarsUp+BarsDown))*100.0;
         PercentPowerUp=(double(PowerUp)/double(PowerUp+PowerDown))*100.0;
         PercentPowerDown=(double(PowerDown)/double(PowerUp+PowerDown))*100.0;
         }
      }
   };
   int TickBox::BarsUp=0;
   int TickBox::BarsDown=0;
   double TickBox::PowerUp=0;
   double TickBox::PowerDown=0;
   double TickBox::PercentUp=0;
   double TickBox::PercentDown=0;
   double TickBox::PercentPowerUp=0;
   double TickBox::PercentPowerDown=0;
All its functions and variables are static. Creating instances is not provided since we do not need them. The entire calculation is performed in a single function in the class. It defines the number of bullish and bearish bars, as well as similar components of the signal strength, which are summed up into a common variable. All four equations for each mode are implemented in this function.
The first two equation variants are implemented without attenuation to the far end of the analyzed area, the next two are an exact copy, however they implement attenuation. In this case, the attenuation is linear. You can always make any other attenuation, but for simplicity, it is better to initially try the one requiring the least amount of calculations.
An elementary term contributing to the overall sum is calculated for each candle. The first equation variant considers that the entire volume present in the candle is a signal in one direction or another. Besides, it is considered how close the final movement is to being the only one. The greater the wicks at the bottom and top of the candlestick relative to the final movement, the less the volume weight. If desired, you can make other ratios.
The second equation variant calculates the total candle movement in points. The sign depends on the candle movement direction. Besides, the value is multiplied by the volume, thus we consider that the volume is a weight ratio that shows how reliable the bar movement is. The rest of the variables calculate the percentage of bars that went up or down, as well as the percentage for the signal itself.
Next, describe the main function, in which we are to open and close positions:
void Trade()
   {
   SymbolInfoTick(Symbol(),LastTick);
   MqlDateTime tm;
   TimeToStruct(LastTick.time,tm);
   int MinuteEquivalent=tm.hour*60+tm.min;
   int BorderMinuteStartTrade=HourCorrect(TradeHour)*60+MinuteCorrect(TradeMinute);
   int BorderMinuteEndTrade=HourCorrect(TradeHourEnd)*60+MinuteCorrect(TradeMinuteEnd);
   if ( MathAbs(TickBox::BarsUp-TickBox::BarsDown) >= 1.0 && TickBox::PercentPowerUp >= 50.0 )
      {
      if ( !bInvert ) ClosePosition(POSITION_TYPE_BUY);
      else ClosePosition(POSITION_TYPE_SELL);
      }

   if ( MathAbs(TickBox::BarsUp-TickBox::BarsDown) >= 1.0 && TickBox::PercentPowerDown >= 50.0 )
      {
      if ( !bInvert ) ClosePosition(POSITION_TYPE_SELL);
      else ClosePosition(POSITION_TYPE_BUY);
      }

     if ( BorderMinuteStartTrade > BorderMinuteEndTrade )
        {
        if ( PositionsTotal() == 0 && !(MinuteEquivalent>=BorderMinuteEndTrade && MinuteEquivalent<= BorderMinuteStartTrade) )
           {
           if ( MathAbs(TickBox::BarsUp-TickBox::BarsDown) >= Signal && TickBox::PercentPowerUp >= PercentE )
              {
              if ( !bInvert ) m_trade.Sell(Lot,_Symbol,LastTick.ask,LastTick.ask+double(SLE)*_Point,LastTick.bid-double(TPE)*_Point);
              else m_trade.Buy(Lot,_Symbol,LastTick.ask,LastTick.bid-double(SLE)*_Point,LastTick.ask+double(TPE)*_Point);
              }

           if ( MathAbs(TickBox::BarsUp-TickBox::BarsDown) >= Signal && TickBox::PercentPowerDown >= PercentE )
              {
              if ( !bInvert ) m_trade.Buy(Lot,_Symbol,LastTick.ask,LastTick.bid-double(SLE)*_Point,LastTick.ask+double(TPE)*_Point);
              else m_trade.Sell(Lot,_Symbol,LastTick.ask,LastTick.ask+double(SLE)*_Point,LastTick.bid-double(TPE)*_Point);
              }
           }
        }
     if ( PositionsTotal() == 0 && BorderMinuteStartTrade <= BorderMinuteEndTrade )
        {
        if ( MinuteEquivalent>=BorderMinuteStartTrade && MinuteEquivalent<= BorderMinuteEndTrade )
           {
           if ( MathAbs(TickBox::BarsUp-TickBox::BarsDown) >= Signal && TickBox::PercentPowerUp >= PercentE )
              {
              if ( !bInvert ) m_trade.Sell(Lot,_Symbol,LastTick.ask,LastTick.ask+double(SLE)*_Point,LastTick.bid-double(TPE)*_Point);
              else m_trade.Buy(Lot,_Symbol,LastTick.ask,LastTick.bid-double(SLE)*_Point,LastTick.ask+double(TPE)*_Point);
              }

           if ( MathAbs(TickBox::BarsUp-TickBox::BarsDown) >= Signal && TickBox::PercentPowerDown >= PercentE )
              {
              if ( !bInvert ) m_trade.Buy(Lot,_Symbol,LastTick.ask,LastTick.bid-double(SLE)*_Point,LastTick.ask+double(TPE)*_Point);
              else m_trade.Sell(Lot,_Symbol,LastTick.ask,LastTick.ask+double(SLE)*_Point,LastTick.bid-double(TPE)*_Point);
              }
           }
        }
   }
Positions are opened based on a signal strength and its quality measured in percentage, and closed if there is at least the slightest hint at the signal change.
The following function is used to close only a position open in a certain direction. It is simple.
void ClosePosition(ENUM_POSITION_TYPE Direction)//close a position by a symbol
   {
   bool ord;
   ord=PositionSelect(Symbol());
   if ( ord && int(PositionGetInteger(POSITION_MAGIC)) == MagicF  && Direction == ENUM_POSITION_TYPE(PositionGetInteger(POSITION_TYPE)) )
      {
      if(m_position.SelectByIndex(0)) m_trade.PositionClose(m_position.Ticket());
      }
   }
Next, let's describe the main events and the function for working with bars:
int OnInit()
  {
  m_trade.SetExpertMagicNumber(MagicF);//set the magic number for positions
  DimensionAllMQL5Values();//prepare the predefined arrays
  return(INIT_SUCCEEDED);
  }

datetime Time0;
datetime TimeX[1];
bool bNewBar()
   {
   CopyTime(_Symbol,_Period,0,1,TimeX);
   if ( Time0 < TimeX[0] )
      {
      if (Time0 != 0)
         {
         Time0=TimeX[0];
         return true;
         }
      else
         {
         Time0=TimeX[0];
         return false;
         }
      }
   else return false;
   }

void OnTick()
  {
  if ( bNewBar())//work by bars
     {
     CalcAllMQL5Values();
     TickBox::CalculateAll(MODEE);
     if (bWriteValuesE)
        {
        Print("% Sit in buy = ",TickBox::PercentUp);
        Print("% Sit in sell = ",TickBox::PercentDown);
        Print("Signal = ",MathAbs(TickBox::BarsDown-TickBox::BarsUp));
        Print("% Resistance = ",TickBox::PercentPowerUp);
        Print("% Support = ",TickBox::PercentPowerDown);
        Print("***************************************************************************");
        }
     Trade();
     }
  }
When launching the EA, we need to prepare the array and set their size, as well as the magic number for positions. After that, describe the predicate function to detect the change of the bar and the variables needed for its work. After that, describe the main tick event and recalculate the values of predefined arrays followed by the calculation of system parameters, as well as add the block to write the main system parameters to the log if the function is enabled. Of course, you can do it differently if you want. The main thing is that everything is simple and clear.
The idea behind the EA is that each bar contributes to the current picture. Keep in mind that it is impossible to even roughly determine what happens next by two-three bars. Each bar contributes to the final signal but their weight is different due to the market physics. I will dwell more on that in the next article.
Testing the EA
Let's test the EA and try to detect promising features. I will start from the last year and use EURUSD M5. Going through operation modes within 10 years of history, as well as using different time corridors, I have found the following acceptable result. The set used to test the EA is attached below. Following my own rules for analyzing systems, I alternately changed both the operation modes and the server time interval. As a result, I have detected the following parameters in about 30-60 minutes.
Below is the test on the last year:
Next, I tested the first year on a 10-year segment:
The graph is not as good as on the near segment, but the final movement is still preserved. It seems that everything works here, too.
After that, I took the middle of the segment and checked how the system behaves there:
As we can see, there are signs of a global pattern here as well, and we just have to test the entire interval and see how it looks on a global scale:
The graph is far from perfect, but we can see the working segments. We may also try to introduce filters or carry out deep optimization. The choice of a specific tool is always optional. If we conduct a test on other pairs, then the result will probably be different, but after a certain amount of time spent, we will most likely find the optimal parameters for several pairs at the same time. If we manage to grasp and reinforce the physics, then the results will be even greater.
Even in its current form, the robot yielded acceptable results. There were very few deals but the EA worked on multiple currencies. Even the simplest code can serve as a powerful basis for developing an idea. Some systems can even be used without modifications.
It would be nice, of course, to get the multicurrency ability, but this is achieved by more work and active modifications. I will not do that in this article and leave this task to the reader. Do not spend too much time on the system trying to squeeze out everything from it. If it works, you will see that almost immediately. If the result is not visible, then it is better to draw conclusions and change your thinking. Sometimes, it is possible to correct something, but this is not always the case.
You can still test it but it is evident that absolutely all bar parameters affect the result in different ways, and there are extreme parameter values with different combinations on different pairs. There are also extreme values working simultaneously for all pairs, but finding them takes time and practice. The MQL4 version is also attached to the article.
Conclusion
Do not be afraid of writing and testing the code on your own. Also, do not be discouraged by the fact that your system looks too simple (seemingly simple systems are usually the ones that actually work). The more complex the system, the more degrees of freedom it has and the more inputs and unpredictable options it features. Avoid complexities in your code as much as you can and keep it as simple as possible.
Besides, the more complex the system, the longer you have to test it. Do not develop systems that are not based on anything at all. Do not believe those who say "I have performed 30 deals. Everything should work now". This is an unprofessional approach. In particular, do not write systems based on some indicators. This is the silliest thing you can do as a developer.
Generally, make sure you realize how much time you are ready to spend for the development. You should have a goal and an acceptable timeframe. Eventually, you may narrow your goal down to make it more realistic, but you should have one anyway.
I have seen plenty of long-time community members setting thousands of indicators on the chart in attempts to see something. This is the road to nowhere. First, you need to determine whether you want to get a certain result or trading is just your hobby. I believe, there are much more interesting hobbies out there than looking at dull quote charts for years. Forex is a black hole. If you get stuck in it, you will never return.
Translated from Russian by MetaQuotes Ltd.
Original article: https://www.mql5.com/ru/articles/8410
Warning: All rights to these materials are reserved by MetaQuotes Ltd. Copying or reprinting of these materials in whole or in part is prohibited.
This article was written by a user of the site and reflects their personal views. MetaQuotes Ltd is not responsible for the accuracy of the information presented, nor for any consequences resulting from the use of the solutions, strategies or recommendations described.

 Neural networks made easy (Part 6): Experimenting with the neural network learning rate
 Gradient boosting in transductive and active machine learning
- Free trading apps
- Over 8,000 signals for copying
- Economic news for exploring financial markets
You agree to website policy and terms of use
It's funny to read this on a programming forum....
I was more surprised by "excellent result" ))). The code ***s him DDD. Well, it happens ). What's a shame few people understood what the article was about at all. Maybe I believed too much in the interest of the audience
Great article, thank you for spending time publishing this. I have managed to grasp the main idea of system development steps and apply these ideas to my price-action based system. But few parts I didn't understand like Modes idea in general, it will be nice if you explain more in your next articles. 👍
.
Thanks to the author. I, like many people, have always paid most attention to the linearity of profit growth. I use it for optimisation in this form, though without additional classes and other complications (I don't know how to do that). I calculate the balance and fill the array in OnTradeTransaction() after each trade DEAL_ENTRY_OUT, and in OnTester() I compare it with the ideal line. Works for 1 run. I added the possibility to switch the custom criterion. I also use the variant of mean deviation from the ideal balance line and the variant of ecuaiti deviation from the ideal balance line. I agree that"flatness of the curve" ))) gives the best idea of the system performance in the future compared to other criteria, but of course not 100%.
Well, in OnTester() I also discard unnecessary variants such as "few trades" and "small expectation" by zeroing LinearFactor, so the optimiser does not use such genes either and focuses on "more correct" results.
Thanks again.